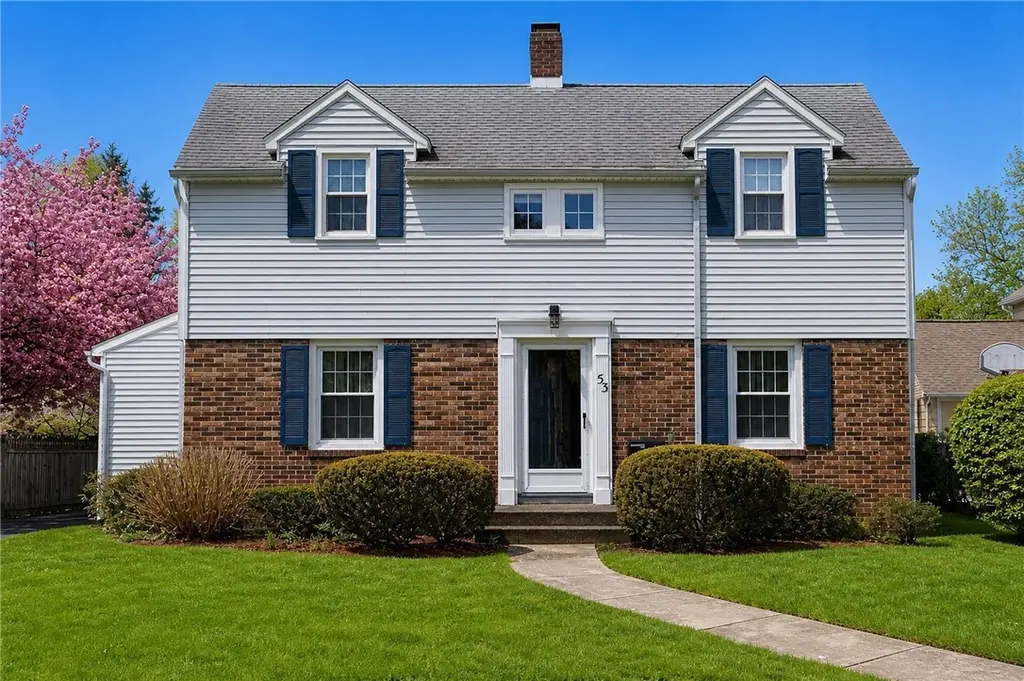
53 Dake Ave · Irondequoit, NY
Flood risk 1/10 · Minimal
- FEMA flood zone
- X (unshaded)
- Chance of flooding over 30 yrs
- 0.0%
- Est. flood insurance / yr
- $473 – $860
Fire risk 2/10 · Minimal
- Est. fire insurance / yr
- $691 – $1,283
Heat risk 2/10 · Minimal
- Hot days now (above 95°F)
- 7 days/yr
- Hot days in 30 yrs
- 15 days/yr
Wind risk 1/10 · Minimal
- Chance of severe wind over 30 yrs
- —
Air-quality risk 2/10 · Minimal
- Unhealthy air days now
- 1 days/yr
- Unhealthy air days in 30 yrs
- 2 days/yr
Risk factors via First Street. Map © Google.
Why this score? — see what drove the C+ grade
The composite is a weighted blend of 9 inputs, each scored 0–100. Each bar is that input's sub-score; the figure is the points it added to the 100-point composite (weight × sub-score).
- Cash flow +18.4/30.0
- ARV discount +15.0/15.0
- Schools +6.2/10.0
- 1% rule +6.1/10.0
- DSCR +5.8/10.0
- Livability +4.0/5.0
- Rent growth +2.5/5.0
- Condition / age +2.5/5.0
- Appreciation +0.0/10.0
$249,900
🖨 Deal sheet 📄 Offer letter ✓ Due diligence
Listing remarks
Classic Colonial located in West Irondequoit featuring 3 bedrooms and 1.5 baths. This lovingly maintained home offers an eat-in kitchen, formal dining room, beautiful hardwood floors, and a comfortable, inviting floor plan. The finished lower level provides additional living space, while the garage and shed offer plenty of room for storage. Enjoy the warm ambiance of the gas fireplace in the living room during chilly evenings. Major mechanical updates include a furnace (HVAC system) and hot water tank, both approximately 4 years old, offering added peace of mind. The fully fenced yard is perfect for outdoor enjoyment, gatherings, pets, and play. Conveniently located close to schools, shoppi
Key facts
- Formal dining room
- Gas fireplace
- Eat-in kitchen
Tags
Property features AI
Exterior
- Parking: Detached garage; Approximately 1.5 garage spaces
- Utilities: Cable available; Public water connected; Sewer connected; Circuit breaker electrical
- Home design: Two-story house; Existing construction
- Construction: Brick and wood siding exterior; Copper plumbing; Asphalt roof; Block foundation
- Exterior features: Blacktop driveway; Fully fenced yard; Open patio and porch; Patio; Porch; Shed(s)/storage
Interior
- Kitchen: Eat-in kitchen; Electric oven and electric range; Refrigerator
- Bedrooms: Bedrooms present (see room count for total rooms)
- Flooring: Carpet; Hardwood; Laminate; Vinyl; Varied flooring
- Bathrooms: One full bathroom; One half bathroom; One main-level bathroom
- Heating & cooling: Central air conditioning; Gas heating; Baseboard heating; Forced air heating
- Interior features: Separate/formal dining room; Entrance foyer; Eat-in kitchen; Separate/formal living room; Home office; Sunroom/Florida room; Recreation room
- Laundry & utility: Washer and dryer; Laundry located in basement; Gas water heater
Neighborhood map
What this means for you Summary
Snapshot
- This is a 3-bed/1.5-bath single-family listed at $250k.
Deal economics
- At list price, monthly cash flow is $232 ($3k/yr) — positive.
- The deal already cash-flows at list — no discount required.
- Meets the 1% rule at list price ($3k rent vs $250k).
- Recommended offer: $246k (1.5% below list) — sets the bar for market timing.
- Cap rate 7.4% vs local median 4.5% in Irondequoit — top-decile yield for the area; either an underpriced asset or a hidden risk that comps aren't pricing in. Stress-test before assuming the spread holds.
Location & tenants
- Location reads 81/100 on livability (#92 in NY, #1,414 nationally) — a professional / high-income tenant draw. Strengths: housing A+, health & safety A+, crime B+; Watch: amenities F.
- West Irondequoit Central School District (suburban): math 73% / reading 70% proficiency, ranked #126 of 590 in NY (top 21%) — strong family-tenant draw, lease renewals of 3-5y typical; only 18% free/reduced lunch — higher-income household profile.
- Market conditions: 102 active listings in the ZIP; 5 comparable units currently listed for rent nearby; rentals leasing fast (median 3d on market — plan ~1-2 weeks tenant-placement turnaround); solid renter incomes; 1,169 units permitted in Monroe County in 2024 (591 in 5+ unit buildings).
- This rent runs 37% of the median local income ($90k/yr) — at the standard rent-burdened threshold; future hikes will face affordability resistance.
Forward outlook
- Local home prices are declining (-3.0%/yr); year-one equity from $2k of loan paydown is wiped out by about $7k of value loss. Plan a longer hold.
- Monroe County population projected to shrink 6% by 2050 — rents likely to lag national; underwrite the cash flow, not the appreciation.
Negotiation context
- It's been on market 23 days — a 2% lower offer ($246k) is reasonable based on typical stale-listing flexibility.
Risks & watch-outs
- Watch-outs: property tax is 2.6% of price; built in 1938 — expect roof / HVAC / electrical / plumbing capex.
Questions for the listing agent
- Built in 1938 — when were the roof, HVAC, electrical panel, plumbing, and water heater last replaced?
- Property tax is high relative to price — has the assessment been appealed recently, and will the sale trigger a re-assessment?
- Is there a deadline driving the sale (1031 exchange, divorce, estate, relocation)? That informs how much negotiation room exists.
- Schools are B-rated — typically a magnet for longer-tenancy family renters. What's the average tenant stay here, and is there a school-zone premium baked into asking?
- What's the average days-on-market for RENTAL listings here right now (not sales)? A rising rental-DOM trend means longer vacancies and softer asking-rent achievability than the comps imply.
- What's the recent tenant-quality profile in this submarket — average credit score on applications, eviction rate, late-payment / NSF rate, and stable-employment percentage? A property-management company in the area should have these aggregated.
- How much new for-sale + rental construction is in the pipeline within 1–3 miles? Heavy new supply typically softens prices + rents 12–24 months out; constrained supply supports both.
Investment metrics
- 1% rule
- 1.11% ✓
- Cap rate
- 7.41%
- Cash-on-cash
- 3.98%
- DSCR
- 1.18
- GRM
- 7.5
CMA / ARV
- ARV (on-the-fly)
- $305,804
- Comps found
- 12
Show comp detail 12 sales within ~0.75 mi
| Address | Dist | Beds/Ba | Sqft | Sold | Price | $/sf | Match |
|---|---|---|---|---|---|---|---|
| 404 List Ave | 0.27mi | 3/1.5 | 1,744 (+2%) | 6mo | $290,000 | $166 | 80 |
| 22 Biltmore Dr | 0.11mi | 4/2.0 (+1) | 1,600 (-7%) | 1mo | $365,000 | $228 | 75 |
| 161 Nob Hl | 0.49mi | 3/1.5 | 1,740 (+1%) | 4mo | $359,000 | $206 | 72 |
| 129 Montclair Dr | 0.13mi | 3/1.5 | 1,524 (-11%) | 6mo | $257,000 | $169 | 70 |
| 35 Oakcrest Dr | 0.60mi | 3/2.0 | 1,742 (+1%) | 5mo | $225,900 | $130 | 64 |
| 660 List Ave | 0.35mi | 4/2.5 (+1) | 1,576 (-8%) | 2mo | $300,000 | $190 | 59 |
| 56 Northwick Dr | 0.54mi | 3/2.5 | 1,613 (-6%) | 2mo | $360,000 | $223 | 59 |
| 196 Belmeade Rd | 0.58mi | 4/2.5 (+1) | 1,768 (+3%) | 1mo | $315,000 | $178 | 58 |
| 35 Shadowlawn Ct | 0.67mi | 4/1.5 (+1) | 1,808 (+5%) | 6mo | $355,000 | $196 | 50 |
| 2632 Oakview Dr | 0.63mi | 4/1.5 (+1) | 1,874 (+9%) | 0mo | $311,500 | $166 | 50 |
| 284 Belmeade Rd | 0.63mi | 3/1.5 | 1,528 (-11%) | 6mo | $272,000 | $178 | 47 |
| 71 Curtice Rd | 0.65mi | 3/1.0 | 1,975 (+15%) | 1mo | $280,000 | $142 | 42 |
Match score weights: distance 35% · size 25% · config 20% · recency 20%. Top-matched comps best support the ARV.
Projected returns pro-forma
-3.0% appreciation · 3.0% rent growth · sell at horizon
- IRR
- -10.0%
- Equity multiple
- 0.64×
- Total profit
- $-25,525
- Equity at exit
- $37,261
- IRR
- -0.5%
- Equity multiple
- 0.96×
- Total profit
- $-2,449
- Equity at exit
- $21,607
Cash invested: $69,972 (down + closing). Projections, not guarantees.
Landlord ↔ Tenant lean methodology
- Overall (STATE)
- 15 Strongly Tenant-Friendly
- State New York
- 15 Strongly Tenant-Friendly · D+10
- County
- — inherits STATE
- City
- — inherits STATE
ZIP-level market 14617
- Active inventory
- 102
- Price-to-rent
- 7.5×
Monthly cashflow live
- Estimated rent
- $2,766 high interval (Pro) →
- Mortgage (P&I)
- −$1,311
- Tax from tax record
- −$539 /mo · $6,463/yr
- Insurance
- −$104
- HOA
- −$0
- Vacancy / Maint / Mgmt
- −$581
- Net cashflow
- $232
Break-even live
UW: 25.0% down · 7.5% · 30yr · 1.5% tax · 5.0% vac · 8.0% maint · 8.0% mgmt
Financing live
Cash to close
- Down payment
- $62,475
- Closing costs
- $7,497
- Reserves months
- —
- Total cash needed
- —
Loan-product check · same deal, 3 products live
Conventional
25% down · 7.5% · 30yr
- Down + closing
- —
- Monthly P&I
- —
- Monthly cashflow
- —
- DSCR
- —
- Eligible?
- —
Personal DTI + credit; lowest rate.
DSCR
20% down · 8.5% · 30yr
- Down + closing
- —
- Monthly P&I
- —
- Monthly cashflow
- —
- DSCR
- —
- Eligible?
- —
No personal income docs; deal must DSCR.
Hard money
10% down · 12.0% · 12mo
- Down + closing
- —
- Monthly P&I
- —
- Monthly cashflow
- —
- DSCR
- —
- Eligible?
- —
Short-term bridge; refi at stabilization.
Rent comps 5 comps
| Address | Beds | Baths | Sqft | Rent | $/sqft | DOM | Units | Dist |
|---|---|---|---|---|---|---|---|---|
| 58 Fairview Cres Rochester, NY | 4.0 | 1.5 | 2194 | $3,600 | $1.64 | 2d | 1 | 0.22mi |
| 39 Chelsea Rd Rochester, NY | 3.0 | 1.5 | 1108 | $2,350 | $2.12 | 23d | 1 | 0.49mi |
| 148 Chestnut Hill Dr Rochester, NY | 3.0 | 2.0 | 1659 | $2,250 | $1.36 | 2d | 1 | 0.70mi |
| 38 Elgrove Rd Rochester, NY | 4.0 | 1.5 | 1600 | $2,295 | $1.43 | 21d | 1 | 0.82mi |
| 485 Oakridge Dr Rochester, NY | 3.0 | 1.5 | 1826 | $4,000 | $2.19 | 2d | 1 | 1.19mi |
Listing history 2 events
-
2026-05-12historical Active Under Contract
-
2026-05-04$249,900 Active
ⓘ Source: listings_history table (triggers on properties + properties_extension) + one-shot
backfill from property_details.listing_events for pre-trigger history.
Tax reassessment forecast NY · Partial reset (capped growth)
- Current annual tax
- $6,463 · $539/mo
- Projected year-2 tax
- $6,463 · $539/mo
- Expected delta
- $0/yr ($0/mo · 0.0%)
ⓘ Screening estimate from a state-policy table — verify with the county assessor before closing.
Climate risk First Street
- Flood 1/10 Low FEMA zone X (unshaded) · 0% chance over 30 yrs
- Wildfire 2/10 Low
- Heat 2/10 Low 7 d/yr ≥95°F today · 15 d/yr by 30 yrs out
- Wind 1/10 Low
- Air quality 2/10 Low 1 unhealthy d/yr today · 2 by 30 yrs out
Nearby sold comps map
Loading sold comps map…
Walkable amenities ~0.75 mi
Loading nearby amenities…
Taxation est. · year 1
- Rental income
- $33,196
- − Mortgage interest
- −$13,998
- − Property taxes
- −$6,463
- − Insurance
- −$1,250
- − Repairs & maintenance
- −$2,656
- − Management
- −$2,656
- − Depreciation
- −$7,270
- Taxable loss
- −$1,096
- Est. tax savings @ 24.0%
- +$263
- After-tax cash flow
- $3,049/yr
For passive investors: Depreciation is non-cash, so a rental often shows a tax loss while cash-flowing — sheltering income. Rental losses are passive: they offset passive income freely, and up to $25,000/yr can offset ordinary (W-2) income if you actively participate and your MAGI is under $100k (phasing out to $0 by $150k); unused losses carry forward. On sale, claimed depreciation is recaptured at up to 25%, and gains may owe capital-gains tax (a 1031 exchange can defer both). Figures are a year-1 estimate at your 24.0% rate — not tax advice; consult a CPA.
Schools (NCES district)
- District
- West Irondequoit Central School District
- NCES district ID
- 3615390
- Math proficiency
- 73% ▲ 3.00%
- Reading proficiency
- 70% ▲ 5.00%
- Median HH income
- $60,218
- Composite
- 61.61/100
- National rank
- #748
- State rank
- #126 of 590 in NY
Livability — Irondequoit
- Score
- 81/100
- State rank
- #92
- US rank
- #1414
Category grades
Schools grade is shown separately in the Schools card above.
Census & demographics
- Census place
- Irondequoit, NY
- County
- Monroe County · 674,131 people
- City population
- 74,252
- Metro
- Rochester, NY
- Population (ZIP)
- 21,788
- Household income
- $90,192
- Rent vs Own
- Severe rent burden
- 426.0
Population outlook (Monroe County) Hauer SSP2
- Today (2025)
- 759,460 people
- By 2030
- 757,154 · -0.3%
- By 2040
- 740,644 · -2.5%
- By 2050
- 714,443 · -5.9%
- By 2075
- 645,883 · -15.0%
- By 2100
- 547,084 · -28.0%
Race, ethnicity, and origin ACS 2023
- Neighborhood character
- Predominantly White (85%)
- Race & ethnicity
- White 85% Hispanic / Latino 8% Two or more races 6% Black 4%
- Hispanic origin (detail)
- Puerto Rican 4%
- Common ancestry
- Romanian 6% Iranian 3% Lithuanian 3%
- Foreign-born
- 4% · Canada
- Languages at home
- 93% English-only · Spanish 4% Other Indo-European 1% Russian/Polish/Slavic 1%
Political lean MEDSL · Monroe
- 2024 margin
- D (+19.1) · D 59.5% · R 40.5%
- 2008→2024 swing
- +1.4pp toward D · 2008: 17.7pp · 2024: 19.1pp
- All cycles
- 2024: D+19.1 2020: D+21.0 2016: D+14.1 2012: D+17.4 2008: D+17.7
Not yet ingested
- Civics
- —
Market trends
- HPI YoY
- ▼ -148.22%
- Current HPI
- 263.9973
- Rent YoY
- —
- Metro
- Rochester, NY
- State GDP YoY
- ▲ 2.60%
- F500 in state
- 92
Industry mix (Fortune 500 HQ in NY)
| Industry | F500 HQs | Revenue |
|---|---|---|
| Financial Services | 10 | $950B |
|
||
| Consumer Goods | 9 | $162B |
|
||
| Insurance | 4 | $225B |
|
||
| Telecommunications | 2 | $144B |
|
||
| Pharmaceuticals | 2 | $112B |
|
||
| Media / Entertainment | 2 | $69B |
|
||
Price history
2 events — show timeline
- 2026-05-12 Contingent — UNYREIS
- 2026-05-04 Listed $249,900 UNYREIS
Property tax history
+4.7%/yrLatest (2025): $6,463 · +40.7% YoY. Source: county tax records.
Cash-flow waterfall
monthlySold comps — $/sqft
last 12 mo · ≤1 miLoading sold comps…