 🏗️ New Construction
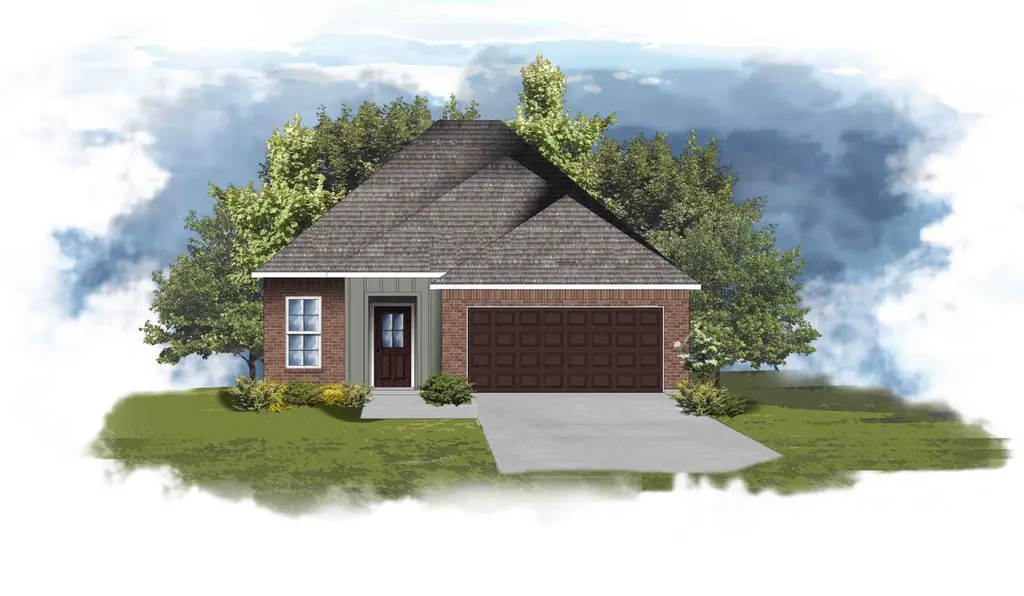
Winton II H Plan · Denham Springs, LA
Flood risk No data
- FEMA flood zone
- —
- Chance of flooding over 30 yrs
- —
- Est. flood insurance / yr
- —
Fire risk No data
- Est. fire insurance / yr
- —
Heat risk No data
- Hot days now (above threshold)
- —
- Hot days in 30 yrs
- —
Wind risk No data
- Chance of severe wind over 30 yrs
- —
Air-quality risk No data
- Unhealthy air days now
- —
- Unhealthy air days in 30 yrs
- —
Risk factors via First Street. Map © Google.
Why this score? — see what drove the D- grade
The composite is a weighted blend of 9 inputs, each scored 0–100. Each bar is that input's sub-score; the figure is the points it added to the 100-point composite (weight × sub-score).
- Cash flow +9.8/30.0
- ARV discount +7.5/15.0
- Schools +4.0/10.0
- Livability +3.7/5.0
- Rent growth +3.5/5.0
- 1% rule +2.9/10.0
- DSCR +2.8/10.0
- Condition / age +1.0/5.0
- Appreciation +0.0/10.0
$233,990
🖨 Deal sheet (PDF) 📄 Offer letter ✓ Due diligence
Listing remarks MLS
- Open Floor Plan - Four Bedrooms, Two Bathrooms - Two Car Garage - Brick & Siding Exterior - Recessed Can Lighting in Kitchen - Double Master Vanity - Walk-In Master Closet - Separate Master Shower
Key facts
- Open floor plan
- Double master vanity
- 2 garage spots
Tags
Neighborhood map
What this means for you Summary
Snapshot
- This is a 4-bed/2.0-bath single-family listed at $234k. Condition is rated poor.
Deal economics
- At list price, monthly cash flow is $-160 ($-2k/yr) — negative.
- To cash-flow at today's rent, offer at most $225k (3.9% below list).
- To meet the 1% rule (rent ≥ 1% of price), the offer needs to be $197k (15.9% below list).
- Recommended offer: $197k (15.9% below list) — sets the bar for 1% rule.
- Cap rate 5.5% vs local median 4.0% in Denham Springs — top-decile yield for the area; either an underpriced asset or a hidden risk that comps aren't pricing in. Stress-test before assuming the spread holds.
Location & tenants
- Location reads 74/100 on livability (#29 in LA, #4,939 nationally) — a middle-class / working-renter tenant base. Strengths: cost of living A+, housing A+, health & safety A+; Watch: crime C-, amenities F, commute F.
- Livingston Parish (suburban): math 40% / reading 52% proficiency, ranked #13 of 98 in LA (top 13%) — families likely to look elsewhere, expect single-tenant / working-renter base with shorter leases.
- Market conditions: Rents rising (+3.8%/yr); 985 active listings in the ZIP; 4 comparable units currently listed for rent nearby; rentals at typical pace (median 16d on market — plan ~3-4 weeks tenant-placement turnaround); solid renter incomes; 794 units permitted in Livingston Parish in 2024 (99 in 5+ unit buildings).
- This rent runs 30% of the median local income ($79k/yr) — at the standard rent-burdened threshold; future hikes will face affordability resistance.
Forward outlook
- Local home prices are declining (-3.0%/yr); year-one equity from $2k of loan paydown is wiped out by about $7k of value loss. Plan a longer hold.
- Livingston County population projected at +27% by 2050 — long-run rental-demand tailwind backs the buy-and-hold thesis.
Negotiation context
- It's been on market 486 days — a 12% lower offer ($206k) is reasonable based on typical stale-listing flexibility.
Questions for the listing agent
- What do current leases actually rent for vs. the listed asking? Can we see a recent rent roll and the last 12 months of T-12 income?
- It's been on market 486 days. Have you received any prior offers? Is the seller open to a 16% concession, seller financing, or rate buy-down credit?
- Have any recent inspections been done? Can we get a copy of the seller's disclosures and any deferred-maintenance estimates?
- Why hasn't it sold? Are there any deal-killer items the seller is aware of (foundation, flood, title, zoning, code violations)?
- Is there a deadline driving the sale (1031 exchange, divorce, estate, relocation)? That informs how much negotiation room exists.
- Schools are B-rated — typically a magnet for longer-tenancy family renters. What's the average tenant stay here, and is there a school-zone premium baked into asking?
- The area grade is low — what's the realistic commute time and amenity access for the typical tenant pool here? Any planned neighborhood developments (good or bad) we should know about?
- What's the average days-on-market for RENTAL listings here right now (not sales)? A rising rental-DOM trend means longer vacancies and softer asking-rent achievability than the comps imply.
- What's the recent tenant-quality profile in this submarket — average credit score on applications, eviction rate, late-payment / NSF rate, and stable-employment percentage? A property-management company in the area should have these aggregated.
- How much new for-sale + rental construction is in the pipeline within 1–3 miles? Heavy new supply typically softens prices + rents 12–24 months out; constrained supply supports both.
Investment metrics
- 1% rule
- 0.79% ✗
- Cap rate
- 5.52%
- Cash-on-cash
- -2.77%
- DSCR
- 0.88
- GRM
- 10.5
CMA / ARV
- ARV (median comp)
- $248,038
- List price
- $233,990
- Delta
- -5.66%
- Verdict
- FAIR
- Comps
- 20 within 1.0 mi
Show comp detail 12 sales within ~0.75 mi
| Address | Dist | Beds/Ba | Sqft | Sold | Price | $/sf | Match |
|---|---|---|---|---|---|---|---|
| 28374 Middlebrook Way | 0.14mi | 4/2.0 | 1,458 (-4%) | 5mo | $233,420 | $160 | 83 |
| 28380 Middlebrook Way | 0.12mi | 3/2.0 (-1) | 1,593 (+5%) | 3mo | $250,000 | $157 | 78 |
| 28232 Middlebrook Way | 0.37mi | 4/2.0 | 1,550 (+2%) | 6mo | $240,000 | $155 | 74 |
| 28536 Middlebrook Way | 0.14mi | 3/2.0 (-1) | 1,424 (-6%) | 6mo | $229,510 | $161 | 74 |
| 28346 Middlebrook Way | 0.29mi | 3/2.0 (-1) | 1,578 (+4%) | 4mo | $247,000 | $157 | 72 |
| 9626 S Grand Marsh Ct | 0.44mi | 3/2.0 (-1) | 1,490 (-2%) | 3mo | $235,000 | $158 | 69 |
| 9698 S Grand Marsh Ct | 0.42mi | 3/2.0 (-1) | 1,578 (+4%) | 1mo | $255,000 | $162 | 68 |
| 28226 Middlebrook Way | 0.38mi | 3/3.0 (-1) | 1,557 (+3%) | 2mo | $264,900 | $170 | 67 |
| 28236 Natchez Trce | 0.38mi | 3/2.0 (-1) | 1,424 (-6%) | 1mo | $234,990 | $165 | 66 |
| 28348 Moreau Dr | 0.38mi | 3/2.0 (-1) | 1,424 (-6%) | 2mo | $245,000 | $172 | 66 |
| 9279 Cypress Lake Dr | 0.59mi | 4/2.0 | 1,701 (+12%) | 3mo | $265,000 | $156 | 49 |
| 9277 Yellowfin Dr | 0.68mi | 3/2.0 (-1) | 1,355 (-11%) | 3mo | $229,000 | $169 | 43 |
Match score weights: distance 35% · size 25% · config 20% · recency 20%. Top-matched comps best support the ARV.
Projected returns pro-forma
-3.0% appreciation · 3.83% rent growth · sell at horizon
- IRR
- -20.0%
- Equity multiple
- 0.30×
- Total profit
- $-48,710
- Equity at exit
- $36,983
- IRR
- -11.2%
- Equity multiple
- 0.30×
- Total profit
- $-48,522
- Equity at exit
- $21,446
Cash invested: $69,451 (down + closing). Projections, not guarantees.
Landlord ↔ Tenant lean methodology
- Overall (STATE)
- 90 Strongly Landlord-Friendly
- State Louisiana
- 90 Strongly Landlord-Friendly · R+12
- County
- — inherits STATE
- City
- — inherits STATE
ZIP-level market 70726
- Rents YoY
- 3.8%
- Active inventory
- 985
- Price-to-rent
- 9.9×
Monthly cashflow live
- Estimated rent
- $1,967 medium interval (Pro) →
- Mortgage (P&I)
- −$1,301
- Tax est. 1.5%
- −$310 /mo · $3,721/yr
- Insurance
- −$103
- HOA
- −$0
- Vacancy / Maint / Mgmt
- −$413
- Net cashflow
- $-160
Break-even live
Sensitivity live
| Price | -10% $11 | -5% $-74 | +0% $-160 | +5% $-246 | +10% $-332 |
|---|---|---|---|---|---|
| Rent | -10% $-316 | -5% $-238 | +0% $-160 | +5% $-83 | +10% $-5 |
| Rate | -1.0pp $-35 | -0.5pp $-97 | base $-160 | +0.5pp $-224 | +1.0pp $-290 |
UW: 25.0% down · 7.5% · 30yr · 1.5% tax · 5.0% vac · 8.0% maint · 8.0% mgmt
Financing live
Cash to close
- Down payment
- $62,009
- Closing costs
- $7,441
- Reserves months
- —
- Total cash needed
- —
Loan-product check · same deal, 3 products live
Conventional
25% down · 7.5% · 30yr
- Down + closing
- —
- Monthly P&I
- —
- Monthly cashflow
- —
- DSCR
- —
- Eligible?
- —
Personal DTI + credit; lowest rate.
DSCR
20% down · 8.5% · 30yr
- Down + closing
- —
- Monthly P&I
- —
- Monthly cashflow
- —
- DSCR
- —
- Eligible?
- —
No personal income docs; deal must DSCR.
Hard money
10% down · 12.0% · 12mo
- Down + closing
- —
- Monthly P&I
- —
- Monthly cashflow
- —
- DSCR
- —
- Eligible?
- —
Short-term bridge; refi at stabilization.
Rent comps 4 comps
| Address | Beds | Baths | Sqft | Rent | $/sqft | DOM | Units | Dist |
|---|---|---|---|---|---|---|---|---|
| 28219 Grand Marsh Ct Denham Springs, LA | 3.0 | 2.0 | 1551 | $1,800 | $1.16 | 45d | 1 | 0.36mi |
| 8447 Florida Blvd Denham Springs, LA | 2.0–3.0 | 2.0–2.5 | 1410 | $1,825 | $1.29 | 16d | 7 | 0.67mi |
| 10365 Fountain Ln Denham Springs, LA | 3.0 | 3.0 | 1875 | $2,200 | $1.17 | 16d | 1 | 0.96mi |
| 10293 Cassle Rd Denham Springs, LA | 1.0–3.0 | 1.0–2.0 | 1113 | $2,054 | $1.84 | 16d | 23 | 1.00mi |
Listing history 17 events
-
2026-06-22days on market $233,990 Active 486 DOM
-
2026-06-18days on market $233,990 Active 483 DOM
-
2026-06-17days on market $233,990 Active 482 DOM
-
2026-06-16days on market $233,990 Active 481 DOM
-
2026-06-15days on market $233,990 Active 480 DOM
-
2026-06-14days on market $233,990 Active 478 DOM
-
2026-06-13days on market $233,990 Active 477 DOM
-
2026-06-10days on market $233,990 Active 475 DOM
-
2026-06-08days on market $233,990 Active 473 DOM
-
2026-06-07days on market $233,990 Active 472 DOM
-
2026-06-03days on market $233,990 Active 468 DOM
-
2026-06-02days on market $233,990 Active 467 DOM
-
2026-06-01days on market $233,990 Active 466 DOM
-
2026-05-31days on market $233,990 Active 465 DOM
-
2026-05-31days on market $233,990 Active 464 DOM
-
2025-03-17price $233,990 204-char remark
Show marketing remark (204 chars)
- Open Floor Plan - Four Bedrooms, Two Bathrooms - Two Car Garage - Brick & Siding Exterior - Recessed Can Lighting in Kitchen - Double Master Vanity - Walk-In Master Closet - Separate Master Shower
-
2025-02-20$231,990 Active 204-char remark
Show marketing remark (204 chars)
- Open Floor Plan - Four Bedrooms, Two Bathrooms - Two Car Garage - Brick & Siding Exterior - Recessed Can Lighting in Kitchen - Double Master Vanity - Walk-In Master Closet - Separate Master Shower
ⓘ Source: listings_history table (triggers on properties + properties_extension) + one-shot
backfill from property_details.listing_events for pre-trigger history.
Nearby sold comps map
Loading sold comps map…
Walkable amenities ~0.75 mi
Loading nearby amenities…
Taxation est. · year 1
- Rental income
- $23,604
- − Mortgage interest
- −$13,894
- − Property taxes
- −$3,721
- − Insurance
- −$1,240
- − Repairs & maintenance
- −$1,888
- − Management
- −$1,888
- − Depreciation
- −$7,216
- Taxable loss
- −$6,243
- Est. tax savings @ 24.0%
- +$1,498
- After-tax cash flow
- $-424/yr
For passive investors: Depreciation is non-cash, so a rental often shows a tax loss while cash-flowing — sheltering income. Rental losses are passive: they offset passive income freely, and up to $25,000/yr can offset ordinary (W-2) income if you actively participate and your MAGI is under $100k (phasing out to $0 by $150k); unused losses carry forward. On sale, claimed depreciation is recaptured at up to 25%, and gains may owe capital-gains tax (a 1031 exchange can defer both). Figures are a year-1 estimate at your 24.0% rate — not tax advice; consult a CPA.
Condition & rehab AI · 2 photos
This home requires extensive repairs and updates to its exterior, interior, HVAC, and landscaping to improve its condition and increase its resale and rental value.
Repairs flagged
- Major exterior siding — The siding appears to be peeling and in need of replacement.
- Major roof — The roof appears to be in poor condition and may need to be replaced.
- Major flooring — The flooring appears to be in poor condition and may need to be replaced.
- Major interior walls/paint — The interior walls and paint appear to be in poor condition and may need to be repainted.
- Major HVAC/mechanicals — The HVAC and mechanical systems appear to be in poor condition and may need to be replaced or repaired.
- Major landscaping — The landscaping appears to be in poor condition and may need to be replaced or reworked.
Value-add opportunities
- Resale exterior siding replacement — A new exterior siding will improve the home's curb appeal and increase its resale value.
- Resale roof replacement — A new roof will improve the home's structural integrity and increase its resale value.
- Resale flooring replacement — New flooring will improve the home's appearance and increase its resale value.
- Resale painting — Repainting the interior walls and exterior will improve the home's appearance and increase its resale value.
- Both HVAC replacement — A new HVAC system will improve the home's comfort and energy efficiency, benefiting both resale and rental value.
- Resale landscaping — A new landscaping plan will improve the home's curb appeal and increase its resale value.
Renovation cost estimate screening
| Repair item | Severity | Est. cost |
|---|---|---|
| exterior siding · The siding appears to be peeling and in need of replacement. | Major | $15,000–50,000 |
| roof · The roof appears to be in poor condition and may need to be replaced. | Major | $15,000–50,000 |
| flooring · The flooring appears to be in poor condition and may need to be replaced. | Major | $15,000–50,000 |
| interior walls/paint · The interior walls and paint appear to be in poor condition and may need to be repainted. | Major | $15,000–50,000 |
| HVAC/mechanicals · The HVAC and mechanical systems appear to be in poor condition and may need to be replaced or repaired. | Major | $15,000–50,000 |
| landscaping · The landscaping appears to be in poor condition and may need to be replaced or reworked. | Major | $15,000–50,000 |
| Total estimated repair cost · 6 items | $90,000–300,000 |
Value-add ROI direction
- Resale exterior siding replacement — A new exterior siding will improve the home's curb appeal and increase its resale value. ↑
- Resale roof replacement — A new roof will improve the home's structural integrity and increase its resale value. ↑
- Resale flooring replacement — New flooring will improve the home's appearance and increase its resale value. ↑
- Resale painting — Repainting the interior walls and exterior will improve the home's appearance and increase its resale value. ↑
- Both HVAC replacement — A new HVAC system will improve the home's comfort and energy efficiency, benefiting both resale and rental value. ↑
- Resale landscaping — A new landscaping plan will improve the home's curb appeal and increase its resale value. ↑
ⓘ Cost ranges are severity-bucket heuristics (US national rule-of-thumb). Get contractor quotes + a written scope before underwriting a rehab budget.
Schools (NCES district)
- District
- Livingston Parish
- NCES district ID
- 2201020
- Math proficiency
- 40% ▼ -38.00%
- Reading proficiency
- 52% ▼ -32.00%
- Median HH income
- $56,755
- Composite
- 40.07/100
- National rank
- #3811
- State rank
- #13 of 98 in LA
Livability — Denham Springs
- Score
- 74/100
- State rank
- #29
- US rank
- #4939
Category grades
Schools grade is shown separately in the Schools card above.
Census & demographics
- County
- Livingston Parish · 87,496 people
- City population
- 63,575
- Metro
- Baton Rouge, LA
- Population (ZIP)
- 63,575
- Household income
- $78,621
- Rent vs Own
- Severe rent burden
- 1211.0
Population outlook (Livingston County) Hauer SSP2
- Today (2025)
- 158,511 people
- By 2030
- 168,241 · +6.1%
- By 2040
- 186,252 · +17.5%
- By 2050
- 201,516 · +27.1%
- By 2075
- 231,217 · +45.9%
- By 2100
- 241,697 · +52.5%
Race, ethnicity, and origin ACS 2023
- Neighborhood character
- Predominantly White (74%)
- Race & ethnicity
- White 74% Black 13% Hispanic / Latino 9% Two or more races 6%
- Hispanic origin (detail)
- Mexican 3%
- Common ancestry
- Lithuanian 9% Serbian 1% Italian 1%
- Foreign-born
- 6% · Canada
- Languages at home
- 91% English-only · Spanish 6% Other Indo-European 1%
Political lean MEDSL · Livingston
- 2024 margin
- Solid R (+68.5) · D 15.1% · R 83.6% · Other 1.3%
- 2008→2024 swing
- +3.4pp toward D · 2008: -71.9pp · 2024: -68.5pp
- All cycles
- 2024: R+68.5 2020: R+70.0 2016: R+72.5 2012: R+70.4 2008: R+71.9
Not yet ingested
- Civics
- —
Market trends
- HPI YoY
- ▼ -104.37%
- Current HPI
- 170.2207
- Rent YoY
- ▲ 3.83%
- Metro
- Baton Rouge, LA
- State GDP YoY
- ▲ 3.29%
- F500 in state
- 10
Industry mix (Fortune 500 HQ in LA)
| Industry | F500 HQs | Revenue |
|---|---|---|
| Telecommunications | 2 | $23B |
|
||
| Utilities | 1 | $12B |
|
||
| Wholesale / Distribution | 1 | $5B |
|
||
| Advertising | 1 | $2B |
|
||
Price history
+0.9% since first listed2 events — show timeline
- 2025-03-17 Price Changed $233,990 Zillow
- 2025-02-20 Listed $231,990 Zillow
Cash-flow waterfall
monthlySold comps — $/sqft
last 12 mo · ≤1 miLoading sold comps…