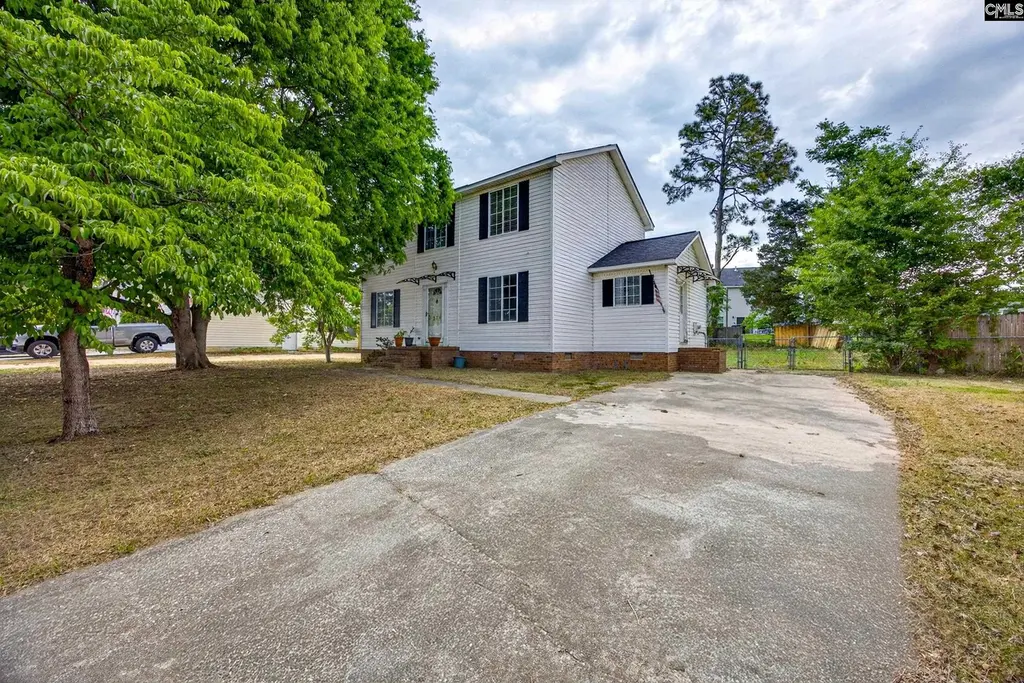
344 Pin Oak Dr · Red Bank, SC
Flood risk 1/10 · Minimal
- FEMA flood zone
- X (unshaded)
- Chance of flooding over 30 yrs
- 0.0%
- Est. flood insurance / yr
- $507 – $1,088
Fire risk 5/10 · Moderate
- Est. fire insurance / yr
- $783 – $1,453
Heat risk 7/10 · Major
- Hot days now (above 108°F)
- 7 days/yr
- Hot days in 30 yrs
- 16 days/yr
Wind risk 6/10 · Moderate
- Chance of severe wind over 30 yrs
- 67.0%
Air-quality risk 3/10 · Minor
- Unhealthy air days now
- 2 days/yr
- Unhealthy air days in 30 yrs
- 2 days/yr
Risk factors via First Street. Map © Google.
Why this score? — see what drove the C- grade
The composite is a weighted blend of 9 inputs, each scored 0–100. Each bar is that input's sub-score; the figure is the points it added to the 100-point composite (weight × sub-score).
- Cash flow +20.0/30.0
- ARV discount +7.5/15.0
- DSCR +6.3/10.0
- Schools +4.2/10.0
- 1% rule +4.1/10.0
- Rent growth +3.3/5.0
- Livability +3.3/5.0
- Condition / age +2.5/5.0
- Appreciation +0.0/10.0
$222,000
🖨 Deal sheet 📄 Offer letter ✓ Due diligence
Listing remarks
Beautiful 3-bedroom, 2.5-bath two-story home located Lexington, in the desirable Garden Pond neighborhood. Conveniently situated near major highways, shopping, and entertainment. This home has been updated with fresh interior paint and brand-new flooring throughout. Enjoy abundant natural light and a layout that’s perfect for both everyday living and entertaining, creating a warm and inviting atmosphere. Upstairs, you’ll find comfortable bedrooms with ample storage, including a private primary suite. Step outside to a rear deck overlooking a generous yard—perfect for relaxing or hosting gatherings. This home is a fantastic opportunity you don’t want to miss. Disclaim
Key facts
- Brand-new flooring
- Generous yard
- Fresh interior paint
Tags
Property features AI
Exterior
- Parking: Four parking spaces
- Utilities: Public sewer; Public water
- Home design: Two-story home
- Construction: Crawlspace foundation
- Exterior features: Vinyl exterior finish; Chain link and wood fencing; Paved road access; Public water
Interior
- Kitchen: Kitchen on main level with luxury vinyl plank flooring
- Bedrooms: Master bedroom on second floor with private bath, separate shower, ceiling fan, walk-in closet and carpeted floors; Second bedroom on second floor with shared bath, tub/shower, ceiling fan and carpeted floors; Third bedroom on second floor with shared bath, tub/shower, ceiling fan and carpeted floors
- Flooring: Carpet in bedrooms; Luxury vinyl plank in living areas, dining room and kitchen
- Bathrooms: Two full bathrooms; One partial bathroom; One half bathroom
- Heating & cooling: Central air conditioning; Electric heating
- Interior features: Smooth surface range; Luxury vinyl plank flooring in living room, formal dining room and kitchen
- Laundry & utility: Main-level mud room / utility room
Neighborhood map
What this means for you Summary
Snapshot
- This is a 3-bed/2.5-bath single-family listed at $222k.
Deal economics
- At list price, monthly cash flow is $271 ($3k/yr) — positive.
- The deal already cash-flows at list — no discount required.
- To meet the 1% rule (rent ≥ 1% of price), the offer needs to be $203k (8.8% below list).
- Recommended offer: $203k (8.8% below list) — sets the bar for 1% rule.
Location & tenants
- Location reads 66/100 on livability (#121 in SC) — a middle-class / working-renter tenant base. Strengths: cost of living A+, housing A+, health & safety B; Watch: employment C-, crime D+, amenities F.
- Lexington 01 (suburban): math 42% / reading 53% proficiency, ranked #11 of 80 in SC (top 14%) — families likely to look elsewhere, expect single-tenant / working-renter base with shorter leases.
- Zoned schools: Red Bank Elementary (math 36% / reading 45%, grade F, #286 of 597 statewide, top 49%, 568 students, 41% FRL); White Knoll High (math 47% / reading 85%, grade B, #81 of 196 statewide, top 42%, 2,204 students, 45% FRL).
- Market conditions: Rents rising (+3.2%/yr); 564 active listings in the ZIP; 12 comparable units currently listed for rent nearby; rentals at typical pace (median 21d on market — plan ~3-4 weeks tenant-placement turnaround); solid renter incomes; 1,712 units permitted in Lexington County in 2024 (0 in 5+ unit buildings).
- This rent runs 31% of the median local income ($77k/yr) — at the standard rent-burdened threshold; future hikes will face affordability resistance.
Forward outlook
- Local home prices are declining (-3.0%/yr); year-one equity from $2k of loan paydown is wiped out by about $7k of value loss. Plan a longer hold.
- Lexington County population projected at +26% by 2050 — long-run rental-demand tailwind backs the buy-and-hold thesis.
Negotiation context
- Only 7 days on market — expect competitive offers; lowballing is unlikely to land.
- Current owner paid $121k; list at $222k implies a 84% gain — meaningful room to come down on a strong offer.
Risks & watch-outs
- Climate carrying-cost: major wind risk, 67% chance of damaging wind over 30y; moderate wildfire risk; extreme-heat days projected 7→16/yr by 2055 (HVAC capex compounding) — expect insurance premiums to compound above CPI over the hold.
Questions for the listing agent
- Is there a deadline driving the sale (1031 exchange, divorce, estate, relocation)? That informs how much negotiation room exists.
- Schools are F-rated, which usually means shorter tenancies and higher turnover. Who's the typical renter profile here, and what's been the actual vacancy rate?
- Crime grade is D in this area — have there been break-ins, vandalism, or insurance claims at this property in the last 3 years? What carrier currently insures it and at what premium?
- What's the average days-on-market for RENTAL listings here right now (not sales)? A rising rental-DOM trend means longer vacancies and softer asking-rent achievability than the comps imply.
- What's the recent tenant-quality profile in this submarket — average credit score on applications, eviction rate, late-payment / NSF rate, and stable-employment percentage? A property-management company in the area should have these aggregated.
- How much new for-sale + rental construction is in the pipeline within 1–3 miles? Heavy new supply typically softens prices + rents 12–24 months out; constrained supply supports both.
Investment metrics
- 1% rule
- 0.91% ✗
- Cap rate
- 7.76%
- Cash-on-cash
- 5.24%
- DSCR
- 1.23
- GRM
- 9.1
CMA / ARV
No comps found within radius.
Projected returns pro-forma
-3.0% appreciation · 3.24% rent growth · sell at horizon
- IRR
- -8.0%
- Equity multiple
- 0.71×
- Total profit
- $-18,293
- Equity at exit
- $33,101
- IRR
- 1.8%
- Equity multiple
- 1.13×
- Total profit
- $7,961
- Equity at exit
- $19,195
Cash invested: $62,160 (down + closing). Projections, not guarantees.
Landlord ↔ Tenant lean methodology
- Overall (STATE)
- 90 Strongly Landlord-Friendly
- State South Carolina
- 90 Strongly Landlord-Friendly · R+6
- County
- — inherits STATE
- City
- — inherits STATE
ZIP-level market 29073
- Home prices YoY
- -19.1%
- Rents YoY
- 3.2%
- Active inventory
- 564
- Price-to-rent
- 9.1×
Monthly cashflow live
- Estimated rent
- $2,025 high interval (Pro) →
- Mortgage (P&I)
- −$1,164
- Tax from tax record
- −$72 /mo · $860/yr
- Insurance
- −$92
- HOA
- −$0
- Vacancy / Maint / Mgmt
- −$425
- Net cashflow
- $271
Break-even live
UW: 25.0% down · 7.5% · 30yr · 1.5% tax · 5.0% vac · 8.0% maint · 8.0% mgmt
Financing live
Cash to close
- Down payment
- $55,500
- Closing costs
- $6,660
- Reserves months
- —
- Total cash needed
- —
Loan-product check · same deal, 3 products live
Conventional
25% down · 7.5% · 30yr
- Down + closing
- —
- Monthly P&I
- —
- Monthly cashflow
- —
- DSCR
- —
- Eligible?
- —
Personal DTI + credit; lowest rate.
DSCR
20% down · 8.5% · 30yr
- Down + closing
- —
- Monthly P&I
- —
- Monthly cashflow
- —
- DSCR
- —
- Eligible?
- —
No personal income docs; deal must DSCR.
Hard money
10% down · 12.0% · 12mo
- Down + closing
- —
- Monthly P&I
- —
- Monthly cashflow
- —
- DSCR
- —
- Eligible?
- —
Short-term bridge; refi at stabilization.
Rent comps 12 comps
| Address | Beds | Baths | Sqft | Rent | $/sqft | DOM | Units | Dist |
|---|---|---|---|---|---|---|---|---|
| 212 Pin Oak Dr Lexington, SC | 3.0 | 2.0 | 1349 | $1,710 | $1.27 | 14d | 1 | 0.15mi |
| 847 Dovefield Ln Lexington, SC | 3.0 | 2.0 | 1302 | $1,850 | $1.42 | 14d | 1 | 0.17mi |
| 919 Dovefield Ln Lexington, SC | 4.0 | 2.5 | 2022 | $2,299 | $1.14 | 23d | 1 | 0.22mi |
| 120 W Lake Dr Lexington, SC | 3.0 | 2.0 | 1476 | $1,880 | $1.27 | 3d | 1 | 0.43mi |
| 140 Land of Lakes Cir Lexington, SC | 3.0 | 2.0 | 1452 | $1,925 | $1.33 | 3d | 1 | 0.46mi |
| 1607 Commendable Ct Lexington, SC | 4.0 | 2.5 | 1783 | $2,238 | $1.26 | 23d | 1 | 0.60mi |
| 1603 Commendable Ct Lexington, SC | 3.0 | 2.0 | 1399 | $2,033 | $1.45 | 3d | 1 | 0.61mi |
| 128 S Wrenwood Dr Lexington, SC | 3.0 | 2.0 | 1250 | $1,695 | $1.36 | 23d | 1 | 0.61mi |
| 110 Darian Dr Lexington, SC | 3.0 | 2.0 | 1364 | $1,949 | $1.43 | 14d | 1 | 0.76mi |
| 290 Browning Ct Unit b Lexington, SC | 2.0 | 1.0 | 1100 | $1,495 | $1.36 | 21d | 1 | 0.78mi |
| 449 Lady Liberty Way Lexington, SC | 3.0 | 3.0 | 1635 | $1,995 | $1.22 | 23d | 1 | 1.05mi |
| 464 Lady Liberty Way Lexington, SC | 4.0 | 2.5 | 2100 | $2,150 | $1.02 | 23d | 1 | 1.07mi |
Listing history 5 events
-
2026-05-07status Pending
-
2026-04-30$222,000 Active
-
2010-02-11soldstatus $120,900
-
2001-08-24soldstatus $110,500
-
1990-06-01soldstatus $11,500
ⓘ Source: listings_history table (triggers on properties + properties_extension) + one-shot
backfill from property_details.listing_events for pre-trigger history.
Tax reassessment forecast SC · Resets to sale price
- Current annual tax
- $860 · $72/mo
- Projected year-2 tax
- $1,265 · $105/mo
- Expected delta
- +$405/yr (+$34/mo · 47.2%)
ⓘ Screening estimate from a state-policy table — verify with the county assessor before closing.
Climate risk First Street
- Flood 1/10 Low FEMA zone X (unshaded) · 0% chance over 30 yrs
- Wildfire 5/10 Major
- Heat 7/10 Severe 7 d/yr ≥108°F today · 16 d/yr by 30 yrs out
- Wind 6/10 Major 67% chance of damaging wind over 30 yrs
- Air quality 3/10 Moderate 2 unhealthy d/yr today · 2 by 30 yrs out
Nearby sold comps map
Loading sold comps map…
Walkable amenities ~0.75 mi
Loading nearby amenities…
Taxation est. · year 1
- Rental income
- $24,300
- − Mortgage interest
- −$12,435
- − Property taxes
- −$860
- − Insurance
- −$1,110
- − Repairs & maintenance
- −$1,944
- − Management
- −$1,944
- − Depreciation
- −$6,458
- Taxable loss
- −$451
- Est. tax savings @ 24.0%
- +$108
- After-tax cash flow
- $3,365/yr
For passive investors: Depreciation is non-cash, so a rental often shows a tax loss while cash-flowing — sheltering income. Rental losses are passive: they offset passive income freely, and up to $25,000/yr can offset ordinary (W-2) income if you actively participate and your MAGI is under $100k (phasing out to $0 by $150k); unused losses carry forward. On sale, claimed depreciation is recaptured at up to 25%, and gains may owe capital-gains tax (a 1031 exchange can defer both). Figures are a year-1 estimate at your 24.0% rate — not tax advice; consult a CPA.
Schools (NCES district)
- District
- Lexington 01
- NCES district ID
- 4502700
- Math proficiency
- 42% ▼ -12.00%
- Reading proficiency
- 53% ▼ -2.00%
- Median HH income
- $61,298
- Composite
- 41.75/100
- National rank
- #3399
- State rank
- #11 of 80 in SC
Livability — Red Bank
- Score
- 66/100
- State rank
- #121
- US rank
- #11985
Category grades
Schools grade is shown separately in the Schools card above.
Census & demographics
- Census place
- Red Bank, SC
- County
- Lexington County · 232,571 people
- Metro
- Columbia, SC
- Population (ZIP)
- 53,156
- Household income
- $77,229
- Rent vs Own
- Severe rent burden
- 935.0
Population outlook (Lexington County) Hauer SSP2
- Today (2025)
- 322,999 people
- By 2030
- 342,356 · +6.0%
- By 2040
- 377,715 · +16.9%
- By 2050
- 406,984 · +26.0%
- By 2075
- 465,447 · +44.1%
- By 2100
- 485,674 · +50.4%
Race, ethnicity, and origin ACS 2023
- Neighborhood character
- Predominantly White (72%)
- Race & ethnicity
- White 72% Black 14% Two or more races 7% Hispanic / Latino 6% Asian 2%
- Hispanic origin (detail)
- Mexican 2% Puerto Rican 1%
- Common ancestry
- Romanian 3% Italian 2% Slovak 1%
- Foreign-born
- 4% · Canada, China
- Languages at home
- 93% English-only · Spanish 5% Other Indo-European 1%
Political lean MEDSL · Lexington
- 2024 margin
- Solid R (+33.5) · D 32.5% · R 66.0% · Other 1.4%
- 2008→2024 swing
- +4.6pp toward D · 2008: -38.0pp · 2024: -33.5pp
- All cycles
- 2024: R+33.5 2020: R+30.1 2016: R+36.7 2012: R+37.8 2008: R+38.0
Not yet ingested
- Civics
- —
Market trends
- HPI YoY
- ▼ -59.20%
- Current HPI
- 249.8957
- Rent YoY
- ▲ 3.24%
- Metro
- Columbia, SC
- State GDP YoY
- ▲ 4.51%
- F500 in state
- 2
Industry mix (Fortune 500 HQ in SC)
| Industry | F500 HQs | Revenue |
|---|---|---|
| Packaging | 1 | $7B |
|
||
Price history
+1830.4% since first listed5 events — show timeline
- 2026-05-07 Pending — Consolidated MLS
- 2026-04-30 Listed $222,000 Consolidated MLS
- 2010-02-11 Sold (Public Records) $120,900 Public Records
- 2001-08-24 Sold (Public Records) $110,500 Public Records
- 1990-06-01 Sold (Public Records) $11,500 Public Records
Property tax history
-9.3%/yrLatest (2024): $860 · +4.4% YoY. Source: county tax records.
Cash-flow waterfall
monthlySold comps — $/sqft
last 12 mo · ≤1 miLoading sold comps…