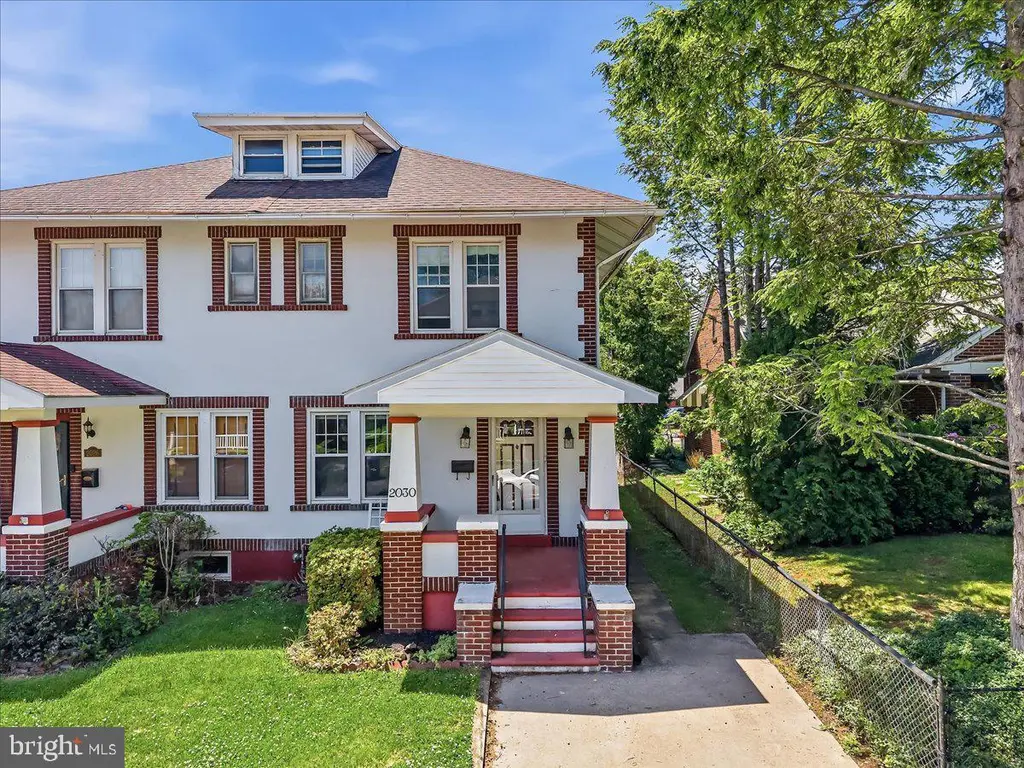
2030 Lawfer Ave · Fullerton, PA
Flood risk 1/10 · Minimal
- FEMA flood zone
- X (unshaded)
- Chance of flooding over 30 yrs
- 0.0%
- Est. flood insurance / yr
- $473 – $860
Fire risk 1/10 · Minimal
- Est. fire insurance / yr
- $511 – $949
Heat risk 5/10 · Moderate
- Hot days now (above 99°F)
- 7 days/yr
- Hot days in 30 yrs
- 15 days/yr
Wind risk 4/10 · Minor
- Chance of severe wind over 30 yrs
- 18.0%
Air-quality risk 3/10 · Minor
- Unhealthy air days now
- 3 days/yr
- Unhealthy air days in 30 yrs
- 4 days/yr
Risk factors via First Street. Map © Google.
Why this score? — see what drove the D+ grade
The composite is a weighted blend of 9 inputs, each scored 0–100. Each bar is that input's sub-score; the figure is the points it added to the 100-point composite (weight × sub-score).
- Cash flow +13.2/30.0
- ARV discount +11.5/15.0
- Schools +5.7/10.0
- DSCR +4.0/10.0
- Livability +4.0/5.0
- Rent growth +3.5/5.0
- 1% rule +3.2/10.0
- Condition / age +2.5/5.0
- Appreciation +0.0/10.0
$280,000
🖨 Deal sheet (PDF) 📄 Offer letter ✓ Due diligence
Listing remarks MLS
Welcome to 2030 Lawfer Avenue, a classic Colonial twin located in South Whitehall Township within the Parkland School District. Situated in the Greenawald neighborhood, this home offers a combination of character, functionality, and convenient access to many of the Lehigh Valley's everyday amenities. A covered front porch welcomes you inside, where a spacious living room flows into a formal dining room, creating a layout well-suited for everyday living and entertaining. The eat-in kitchen offers generous cabinet storage, gas cooking, and space for casual dining. Upstairs, three bedrooms and a full bathroom provide comfortable accommodations, while the walk-up attic delivers valuable storage space rarely found at this price point. The full basement expands the home's functionality even further with a second full bathroom, laundry area, substantial storage space, and an outside entrance. Outside, the fenced backyard provides space for gardening, outdoor activities, or relaxation, while the covered rear porch overlooks the yard. A utility shed adds additional storage, and the private off-street parking pad provides everyday convenience. Additional features include public water, public sewer, gas heat, 200-amp electrical service, and low annual taxes. The location offers convenient access to shopping, dining, parks, healthcare facilities, and major commuter routes throughout the Lehigh Valley. Greenawald is also known locally for its annual holiday light displays, a longstanding seasonal tradition enjoyed by many area residents and visitors. Whether you're seeking your first home, looking to downsize, or searching for an opportunity to personalize a property over time, 2030 Lawfer Avenue offers a practical combination of space, location, and value in South Whitehall Township. Schedule your private showing today.
Key facts
- Covered front porch
- Utility shed
- Eat-in kitchen
Tags
Property features AI
Finance
- Other: Total below-grade area approximately 702 (finished/unfinished details provided); Above-grade finished and unfinished area reported (estimated)
Exterior
- Parking: Four total parking spaces; Two driveway spaces; Two off-street spaces; Paved parking; on-street parking available
- Utilities: Public water; Public sewer; Natural gas available; natural gas hot water; Electric service with 100 amp circuit breaker panel; Cable TV available; Phone available; Broadband, cable, and DSL internet; Municipal trash service
- Home design: Semi-detached structure; Three levels; Main entrance faces east; Fee simple ownership; Property in good condition
- Construction: Stucco exterior; Block foundation; Asphalt/fiberglass roof; Building not winterized; Estimated year built
- Exterior features: Porch(es); Gutter system; Front yard and rear yard; Privacy and partial fencing; Property not in development
Interior
- Kitchen: Dishwasher; Microwave; Gas oven/range; Refrigerator; Breakfast area / combined kitchen-dining layout
- Bedrooms: Three bedrooms on the upper level
- Flooring: Carpet; Laminate; Wood
- Bathrooms: Two full bathrooms (one on upper level, one on lower level)
- Heating & cooling: Hot water heating with baseboard and radiator systems; Natural gas heating and hot water; Ceiling fan(s); Window unit(s) for cooling
- Interior features: Attic; Tub with shower; Breakfast area; Combination kitchen and dining area; Dining area; Ceiling fan(s); Plaster and drywall walls/ceilings
- Laundry & utility: Washer in unit; Dryer in unit; Laundry hookups
Neighborhood map
What this means for you Summary
Snapshot
- This is a 3-bed/2.0-bath townhouse listed at $280k.
Deal economics
- At list price, monthly cash flow is $-6 ($-70/yr) — negative.
- To cash-flow at today's rent, offer at most $279k (0.4% below list).
- To meet the 1% rule (rent ≥ 1% of price), the offer needs to be $231k (17.5% below list).
- Recommended offer: $231k (17.5% below list) — sets the bar for 1% rule.
Location & tenants
- Location reads 80/100 on livability (#227 in PA, #1,976 nationally) — a professional / high-income tenant draw. Strengths: cost of living A+, housing A+, health & safety A+; Watch: commute F.
- Parkland SD (suburban): math 59% / reading 70% proficiency, ranked #40 of 539 in PA (top 7%) — acceptable for families but not a draw, mixed tenant base, ~2y average lease; only 15% free/reduced lunch — higher-income household profile.
- Zoned schools: Fred J. Jaindl El Sch (math 72% / reading 79%, grade A, #88 of 1,518 statewide, top 6%, 447 students, 25% FRL); Orefield Ms (math 33% / reading 60%, grade D+, #172 of 512 statewide, top 35%, 917 students, 36% FRL); Parkland Hs (math 81% / reading 24%, grade C-, #107 of 437 statewide, top 25%, 3,220 students, 25% FRL).
- Market conditions: Rents rising fast (+4.1%/yr); 163 active listings in the ZIP; 14 comparable units currently listed for rent nearby; rentals at typical pace (median 16d on market — plan ~3-4 weeks tenant-placement turnaround); solid renter incomes; 765 units permitted in Lehigh County in 2024 (286 in 5+ unit buildings).
Forward outlook
- Local home prices are declining (-3.0%/yr); year-one equity from $2k of loan paydown is wiped out by about $8k of value loss. Plan a longer hold.
- Lehigh County population projected at +21% by 2050 — long-run rental-demand tailwind backs the buy-and-hold thesis.
Negotiation context
- Only 4 days on market — expect competitive offers; lowballing is unlikely to land.
- 2 sale attempts with the ask held roughly flat each time — persistent listings suggest the price (not the market) is what's stuck; bring a comps-based counter.
Risks & watch-outs
- Watch-outs: built in 1925 — expect roof / HVAC / electrical / plumbing capex.
- Climate carrying-cost: extreme-heat days projected 7→15/yr by 2055 (HVAC capex compounding) — expect insurance premiums to compound above CPI over the hold.
Questions for the listing agent
- What do current leases actually rent for vs. the listed asking? Can we see a recent rent roll and the last 12 months of T-12 income?
- Built in 1925 — when were the roof, HVAC, electrical panel, plumbing, and water heater last replaced?
- Is there a deadline driving the sale (1031 exchange, divorce, estate, relocation)? That informs how much negotiation room exists.
- Schools are F-rated, which usually means shorter tenancies and higher turnover. Who's the typical renter profile here, and what's been the actual vacancy rate?
- The area grade is low — what's the realistic commute time and amenity access for the typical tenant pool here? Any planned neighborhood developments (good or bad) we should know about?
- What's the average days-on-market for RENTAL listings here right now (not sales)? A rising rental-DOM trend means longer vacancies and softer asking-rent achievability than the comps imply.
- What's the recent tenant-quality profile in this submarket — average credit score on applications, eviction rate, late-payment / NSF rate, and stable-employment percentage? A property-management company in the area should have these aggregated.
- How much new for-sale + rental construction is in the pipeline within 1–3 miles? Heavy new supply typically softens prices + rents 12–24 months out; constrained supply supports both.
Investment metrics
- 1% rule
- 0.82% ✗
- Cap rate
- 6.27%
- Cash-on-cash
- -0.09%
- DSCR
- 1.00
- GRM
- 10.1
CMA / ARV
- ARV (on-the-fly)
- $307,476
- Comps found
- 10
Show comp detail 10 sales within ~0.75 mi
| Address | Dist | Beds/Ba | Sqft | Sold | Price | $/sf | Match |
|---|---|---|---|---|---|---|---|
| 2027 Lawfer Ave | 0.03mi | 4/1.5 (+1) | 1,374 (-2%) | 10mo | $300,000 | $218 | 80 |
| 2370 Minnie Ln | 0.19mi | 3/1.5 | 1,512 (+8%) | 12mo | $331,551 | $219 | 67 |
| 2431 Lisa Ln | 0.26mi | 3/1.5 | 1,512 (+8%) | 14mo | $332,000 | $220 | 61 |
| 2376 Minnie Ln | 0.19mi | 3/1.5 | 1,512 (+8%) | 18mo | $325,000 | $215 | 61 |
| 2413 Kris Dr | 0.25mi | 3/1.5 | 1,512 (+8%) | 18mo | $300,000 | $198 | 59 |
| 2489 Lisa Ln | 0.28mi | 3/1.5 | 1,512 (+8%) | 24mo | $336,500 | $223 | 52 |
| 1662 Whitehall Ave | 0.54mi | 3/1.5 | 1,320 (-6%) | 14mo | $315,000 | $239 | 51 |
| 2413 Walbert | 0.65mi | 3/1.5 | 1,516 (+8%) | 10mo | $270,000 | $178 | 46 |
| 1642 Whitehall Ave | 0.58mi | 3/1.5 | 1,280 (-9%) | 13mo | $294,000 | $230 | 46 |
| 2107 Walbert Ave | 0.71mi | 3/1.5 | 1,486 (+6%) | 15mo | $300,000 | $202 | 42 |
Match score weights: distance 35% · size 25% · config 20% · recency 20%. Top-matched comps best support the ARV.
Projected returns pro-forma
-3.0% appreciation · 4.07% rent growth · sell at horizon
- IRR
- -15.3%
- Equity multiple
- 0.45×
- Total profit
- $-43,263
- Equity at exit
- $41,749
- IRR
- -5.2%
- Equity multiple
- 0.65×
- Total profit
- $-27,739
- Equity at exit
- $24,209
Cash invested: $78,400 (down + closing). Projections, not guarantees.
Landlord ↔ Tenant lean methodology
- Overall (STATE)
- 62 Landlord-Friendly
- State Pennsylvania
- 62 Landlord-Friendly · EVEN
- County
- — inherits STATE
- City
- — inherits STATE
ZIP-level market 18104
- Rents YoY
- 4.1%
- Active inventory
- 163
- Price-to-rent
- 10.1×
Monthly cashflow live
- Estimated rent
- $2,309 high interval (Pro) →
- Mortgage (P&I)
- −$1,468
- Tax from tax record
- −$245 /mo · $2,940/yr
- Insurance
- −$117
- HOA
- −$0
- Vacancy / Maint / Mgmt
- −$485
- Net cashflow
- $-6
Break-even live
Sensitivity live
| Price | -10% $153 | -5% $73 | +0% $-6 | +5% $-85 | +10% $-164 |
|---|---|---|---|---|---|
| Rent | -10% $-188 | -5% $-97 | +0% $-6 | +5% $85 | +10% $177 |
| Rate | -1.0pp $135 | -0.5pp $65 | base $-6 | +0.5pp $-78 | +1.0pp $-152 |
UW: 25.0% down · 7.5% · 30yr · 1.5% tax · 5.0% vac · 8.0% maint · 8.0% mgmt
Financing live
Cash to close
- Down payment
- $70,000
- Closing costs
- $8,400
- Reserves months
- —
- Total cash needed
- —
Loan-product check · same deal, 3 products live
Conventional
25% down · 7.5% · 30yr
- Down + closing
- —
- Monthly P&I
- —
- Monthly cashflow
- —
- DSCR
- —
- Eligible?
- —
Personal DTI + credit; lowest rate.
DSCR
20% down · 8.5% · 30yr
- Down + closing
- —
- Monthly P&I
- —
- Monthly cashflow
- —
- DSCR
- —
- Eligible?
- —
No personal income docs; deal must DSCR.
Hard money
10% down · 12.0% · 12mo
- Down + closing
- —
- Monthly P&I
- —
- Monthly cashflow
- —
- DSCR
- —
- Eligible?
- —
Short-term bridge; refi at stabilization.
Rent comps 14 comps
| Address | Beds | Baths | Sqft | Rent | $/sqft | DOM | Units | Dist |
|---|---|---|---|---|---|---|---|---|
| 1664 Whitehall Ave Allentown, PA | 3.0 | 1.5 | 1320 | $2,400 | $1.82 | 16d | 1 | 0.52mi |
| 1988 Presidential Dr Whitehall, PA | 1.0–2.0 | 1.0–2.5 | 1230 | $2,501 | $2.03 | 4d | 11 | 0.72mi |
| 1223 N Albright Ave Allentown, PA | 3.0 | 1.5 | 1080 | $2,200 | $2.04 | 45d | 1 | 1.07mi |
| 2338 W Pennsylvania St Allentown, PA | 2.0 | 1.0 | 1000 | $2,000 | $2.00 | 45d | 1 | 1.11mi |
| 1150 N 19th St Unit 2 Allentown, PA | 2.0 | 1.0 | 977 | $1,750 | $1.79 | 4d | 1 | 1.13mi |
| 1150 N 19th St Unit 2nd Floor Allentown, PA | 2.0 | 1.0 | 977 | $1,750 | $1.79 | 45d | 1 | 1.13mi |
| 10 Lincoln Pl Whitehall, PA | 3.0 | 2.5 | 1760 | $2,300 | $1.31 | 25d | 1 | 1.16mi |
| 1720 Pennsylvania St Allentown, PA | 2.0 | 2.0 | 950 | $1,895 | $1.99 | 4d | 1 | 1.21mi |
| 1055 N 22nd St Unit 00 1014A Allentown, PA | 2.0 | 2.0 | 1100 | $1,820 | $1.65 | 46d | 1 | 1.22mi |
| 1701 Congress St Unit 1701/4 Allentown, PA | 2.0 | 2.0 | 950 | $1,795 | $1.89 | 4d | 1 | 1.25mi |
| 1464 N Cedar Crest Blvd #18 Allentown, PA | 2.0 | 1.0 | 1057 | $1,600 | $1.51 | 4d | 1 | 1.30mi |
| 1399 Presidential Dr Whitehall, PA | 3.0 | 2.5 | 1440 | $2,500 | $1.74 | 25d | 1 | 1.44mi |
| 1229 Pericles Pl Whitehall, PA | 1.0–3.0 | 1.0–2.0 | 1574 | $2,750 | $1.75 | 4d | 7 | 1.44mi |
| 311 Robert Morris Blvd Allentown, PA | 1.0–2.0 | 1.0–2.0 | 1057 | $2,730 | $2.58 | 4d | 19 | 1.48mi |
Listing history 5 events
-
2026-06-07statusdays on market $280,000 Pending 4 DOM
-
2026-06-03days on market $280,000 Active 3 DOM
-
2026-06-02days on market $280,000 Active 2 DOM
-
2026-06-01remarks 699-char remark
-
2026-06-01$280,000 Active 1 DOM
ⓘ Source: listings_history table (triggers on properties + properties_extension) + one-shot
backfill from property_details.listing_events for pre-trigger history.
Tax reassessment forecast PA · Partial reset (capped growth)
- Current annual tax
- $2,940 · $245/mo
- Projected year-2 tax
- $3,682 · $307/mo
- Expected delta
- +$742/yr (+$62/mo · 25.2%)
ⓘ Screening estimate from a state-policy table — verify with the county assessor before closing.
Climate risk First Street
- Flood 1/10 Low FEMA zone X (unshaded) · 0% chance over 30 yrs
- Wildfire 1/10 Low
- Heat 5/10 Major 7 d/yr ≥99°F today · 15 d/yr by 30 yrs out
- Wind 4/10 Moderate 18% chance of damaging wind over 30 yrs
- Air quality 3/10 Moderate 3 unhealthy d/yr today · 4 by 30 yrs out
Nearby sold comps map
Loading sold comps map…
Walkable amenities ~0.75 mi
Loading nearby amenities…
Taxation est. · year 1
- Rental income
- $27,709
- − Mortgage interest
- −$15,684
- − Property taxes
- −$2,940
- − Insurance
- −$1,400
- − Repairs & maintenance
- −$2,217
- − Management
- −$2,217
- − Depreciation
- −$8,145
- Taxable loss
- −$4,895
- Est. tax savings @ 24.0%
- +$1,175
- After-tax cash flow
- $1,104/yr
For passive investors: Depreciation is non-cash, so a rental often shows a tax loss while cash-flowing — sheltering income. Rental losses are passive: they offset passive income freely, and up to $25,000/yr can offset ordinary (W-2) income if you actively participate and your MAGI is under $100k (phasing out to $0 by $150k); unused losses carry forward. On sale, claimed depreciation is recaptured at up to 25%, and gains may owe capital-gains tax (a 1031 exchange can defer both). Figures are a year-1 estimate at your 24.0% rate — not tax advice; consult a CPA.
Schools (NCES district)
- District
- Parkland SD
- NCES district ID
- 4218510
- Math proficiency
- 59% ▼ -11.00%
- Reading proficiency
- 70% ▼ -12.00%
- Median HH income
- $77,976
- Composite
- 57.44/100
- National rank
- #1074
- State rank
- #40 of 539 in PA
Livability — Fullerton
- Score
- 80/100
- State rank
- #227
- US rank
- #1976
Category grades
Schools grade is shown separately in the Schools card above.
Census & demographics
- County
- Lehigh County · 333,019 people
- Metro
- Allentown-Bethlehem-Easton, PA-NJ
- Population (ZIP)
- 48,683
- Household income
- $94,601
- Rent vs Own
- Severe rent burden
- 1298.0
Population outlook (Lehigh County) Hauer SSP2
- Today (2025)
- 392,957 people
- By 2030
- 408,319 · +3.9%
- By 2040
- 440,007 · +12.0%
- By 2050
- 475,940 · +21.1%
- By 2075
- 590,448 · +50.3%
- By 2100
- 690,314 · +75.7%
Race, ethnicity, and origin ACS 2023
- Neighborhood character
- Predominantly White (68%)
- Race & ethnicity
- White 68% Hispanic / Latino 14% Asian 8% Two or more races 8% Black 6%
- Hispanic origin (detail)
- Puerto Rican 5% Dominican 5%
- Common ancestry
- Romanian 5% Polish 2% Lithuanian 2%
- Foreign-born
- 15% · Canada, China, Jamaica
- Languages at home
- 79% English-only · Spanish 10% Other Indo-European 4% Chinese 2%
Political lean MEDSL · Lehigh
- 2024 margin
- Toss-up / Even · D 50.7% · R 48.0% · Other 1.2%
- 2008→2024 swing
- -12.9pp toward R · 2008: 15.6pp · 2024: 2.7pp
- All cycles
- 2024: D+2.7 2020: D+7.6 2016: D+4.4 2012: D+7.5 2008: D+15.6
Not yet ingested
- Civics
- —
Market trends
- HPI YoY
- ▼ -294.71%
- Current HPI
- 277.8639
- Rent YoY
- ▲ 4.07%
- Metro
- Allentown-Bethlehem-Easton, PA-NJ
- State GDP YoY
- ▲ 1.68%
- F500 in state
- 34
Industry mix (Fortune 500 HQ in PA)
| Industry | F500 HQs | Revenue |
|---|---|---|
| Healthcare | 2 | $309B |
|
||
| Insurance | 2 | $27B |
|
||
| Telecommunications / Media | 1 | $124B |
|
||
| Industrial Distribution | 1 | $22B |
|
||
| Financial Services | 1 | $20B |
|
||
| Chemicals / Materials | 1 | $18B |
|
||
Price history
+0.0% since first listed2 events — show timeline
- 2026-05-31 Listed $280,000 BRIGHT MLS
- 2026-05-31 Listed $280,000 GLVRMLS
Property tax history
+2.1%/yrLatest (2026): $2,940 · +3.9% YoY. Source: county tax records.
Cash-flow waterfall
monthlySold comps — $/sqft
last 12 mo · ≤1 miLoading sold comps…