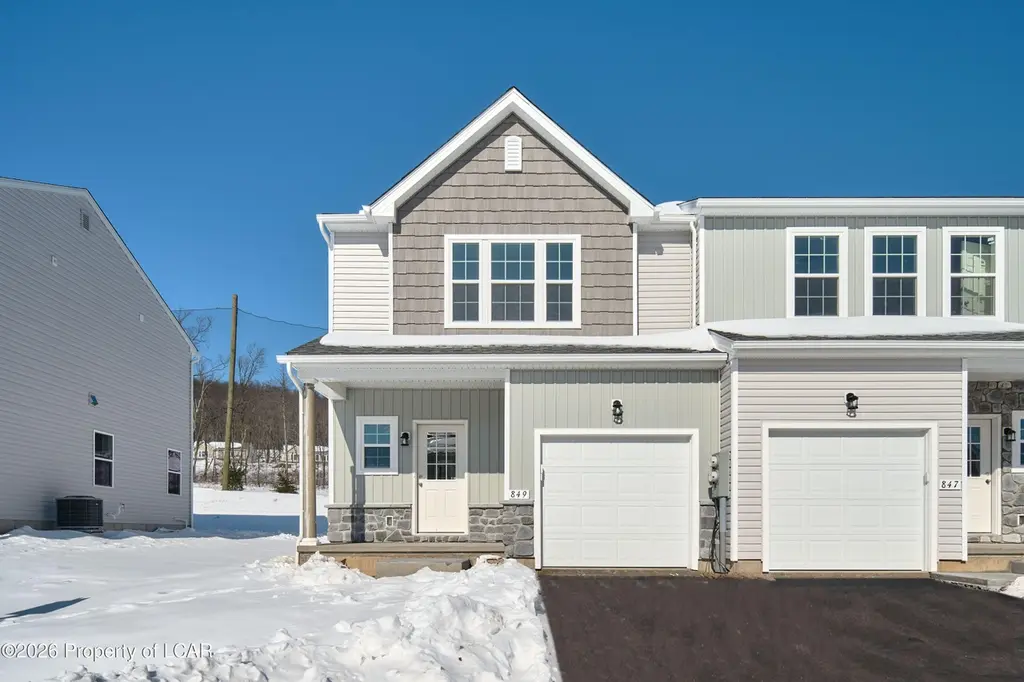
849 Champions Dr · Beech Mountain Lakes, PA
Flood risk 6/10 · Moderate
- FEMA flood zone
- X (unshaded)
- Chance of flooding over 30 yrs
- 0.75%
- Est. flood insurance / yr
- $507 – $1,088
Fire risk 1/10 · Minimal
- Est. fire insurance / yr
- $511 – $949
Heat risk 2/10 · Minimal
- Hot days now (above 93°F)
- 7 days/yr
- Hot days in 30 yrs
- 16 days/yr
Wind risk 3/10 · Minor
- Chance of severe wind over 30 yrs
- 7.0%
Air-quality risk 2/10 · Minimal
- Unhealthy air days now
- 1 days/yr
- Unhealthy air days in 30 yrs
- 2 days/yr
Risk factors via First Street. Map © Google.
Why this score? — see what drove the D grade
The composite is a weighted blend of 9 inputs, each scored 0–100. Each bar is that input's sub-score; the figure is the points it added to the 100-point composite (weight × sub-score).
- Appreciation +10.0/10.0
- Cash flow +7.9/30.0
- ARV discount +7.2/15.0
- Livability +3.6/5.0
- 1% rule +2.5/10.0
- Rent growth +2.5/5.0
- Condition / age +2.5/5.0
- DSCR +2.0/10.0
- Schools +2.0/10.0
$288,590
🖨 Deal sheet (PDF) 📄 Offer letter ✓ Due diligence
Listing remarks MLS
MOVE IN READY!!The Greens at Sand Springs are both elegant and spacious, with a floorplan that will make you feel right at home. Upon entering, you'll be welcomed by an open-concept first floor, featuring a Kitchen that has everything you need for cooking and entertaining complete with a large island for extra seating, ample counter space, a convenient pantry.
Key facts
- Ample counter space
- Large island
- Convenient pantry
Tags
Neighborhood map
What this means for you Summary
Snapshot
- This is a 3-bed/2.5-bath townhouse listed at $289k.
Deal economics
- At list price, monthly cash flow is $-305 ($-4k/yr) — negative.
- To cash-flow at today's rent, offer at most $244k (15.3% below list).
- To meet the 1% rule (rent ≥ 1% of price), the offer needs to be $216k (25.0% below list).
- Recommended offer: $216k (25.0% below list) — sets the bar for 1% rule.
- Cap rate 5.0% vs local median 3.7% in Beech Mountain Lakes — top-decile yield for the area; either an underpriced asset or a hidden risk that comps aren't pricing in. Stress-test before assuming the spread holds.
Location & tenants
- Location reads 71/100 on livability (#698 in PA) — a middle-class / working-renter tenant base. Strengths: crime A+, employment A+, cost of living A+; Watch: amenities F, commute F, health & safety F.
- Hazleton Area SD (suburban): math 18% / reading 30% proficiency, ranked #476 of 539 in PA (top 88%) — low school quality limits family demand, transient renter base, plan for 1-2y turnover.
- Zoned schools: Drums El/Ms (math 17% / reading 53%, grade F, #1,042 of 1,518 statewide, top 69%, 784 students, 100% FRL); Hazleton Area Hs (math 53% / reading 8%, grade F, #347 of 437 statewide, top 79%, 3,795 students, 83% FRL) — zoned schools average 91% FRL vs 60% district-wide (32 pts higher); higher-poverty schools than district average — tighter screening recommended.
- Market conditions: 136 active listings in the ZIP; 4 comparable units currently listed for rent nearby; rentals at typical pace (median 23d on market — plan ~3-4 weeks tenant-placement turnaround); 349 units permitted in Luzerne County in 2024 (16 in 5+ unit buildings).
Forward outlook
- In year one you build about $31k of equity ($2k loan paydown + $29k appreciation (10.0% local appreciation)).
- Luzerne County population projected at +4% by 2050 — modest demand growth; plan on rents tracking national, not racing it.
- By year 2, paydown + projected appreciation supports a ~$50k cash-out refi (75% LTV) — recoverable capital for the next deal without selling this one.
Negotiation context
- It's been on market 194 days — a 12% lower offer ($254k) is reasonable based on typical stale-listing flexibility.
- 2 sale attempts with the ask held roughly flat each time — persistent listings suggest the price (not the market) is what's stuck; bring a comps-based counter.
Risks & watch-outs
- Climate carrying-cost: major flood risk — expect insurance premiums to compound above CPI over the hold.
Questions for the listing agent
- What do current leases actually rent for vs. the listed asking? Can we see a recent rent roll and the last 12 months of T-12 income?
- It's been on market 194 days. Have you received any prior offers? Is the seller open to a 25% concession, seller financing, or rate buy-down credit?
- What does the HOA fee cover, when was the last increase, and are there any pending special assessments or reserve-fund shortfalls?
- Why hasn't it sold? Are there any deal-killer items the seller is aware of (foundation, flood, title, zoning, code violations)?
- Is there a deadline driving the sale (1031 exchange, divorce, estate, relocation)? That informs how much negotiation room exists.
- Schools are D-rated, which usually means shorter tenancies and higher turnover. Who's the typical renter profile here, and what's been the actual vacancy rate?
- The area grade is low — what's the realistic commute time and amenity access for the typical tenant pool here? Any planned neighborhood developments (good or bad) we should know about?
- What's the average days-on-market for RENTAL listings here right now (not sales)? A rising rental-DOM trend means longer vacancies and softer asking-rent achievability than the comps imply.
- What's the recent tenant-quality profile in this submarket — average credit score on applications, eviction rate, late-payment / NSF rate, and stable-employment percentage? A property-management company in the area should have these aggregated.
- How much new for-sale + rental construction is in the pipeline within 1–3 miles? Heavy new supply typically softens prices + rents 12–24 months out; constrained supply supports both.
Investment metrics
- 1% rule
- 0.75% ✗
- Cap rate
- 5.03%
- Cash-on-cash
- -4.53%
- DSCR
- 0.80
- GRM
- 11.1
CMA / ARV
- ARV (median comp)
- $286,676
- List price
- $288,590
- Delta
- 0.67%
- Verdict
- FAIR
- Comps
- 20 within 1.0 mi
Show comp detail 12 sales within ~0.75 mi
| Address | Dist | Beds/Ba | Sqft | Sold | Price | $/sf | Match |
|---|---|---|---|---|---|---|---|
| 846 Champions Dr | 0.03mi | 3/2.5 | 1,495 (-1%) | 0mo | $305,900 | $205 | 97 |
| 810 Champions Dr | 0.18mi | 3/2.5 | 1,510 (0%) | 2mo | $292,500 | $194 | 90 |
| 818 Champions Dr | 0.16mi | 3/2.5 | 1,495 (-1%) | 3mo | $255,000 | $171 | 88 |
| 857 Champions Dr | 0.12mi | 3/2.5 | 1,510 (0%) | 13mo | $300,000 | $199 | 84 |
| 852 Champions Dr | 0.09mi | 3/2.5 | 1,510 (0%) | 15mo | $300,000 | $199 | 83 |
| 865 Champions Dr | 0.09mi | 3/2.5 | 1,510 (0%) | 15mo | $275,000 | $182 | 83 |
| 16 Nicholas Court Dr | 0.30mi | 3/1.5 | 1,500 (-1%) | 9mo | $298,500 | $199 | 73 |
| 382 Long Run Rd | 0.03mi | 3/2.5 | 1,309 (-13%) | 11mo | $259,500 | $198 | 67 |
| 272 Refuge Cir | 0.60mi | 2/2.0 (-1) | 1,555 (+3%) | 9mo | $285,000 | $183 | 53 |
| 259 Refuge Cir | 0.55mi | 3/2.0 | 1,640 (+9%) | 13mo | $295,000 | $180 | 47 |
| 218 Refuge Cir | 0.62mi | 2/2.0 (-1) | 1,555 (+3%) | 15mo | $289,900 | $186 | 47 |
| 211 Refuge Cir | 0.62mi | 3/2.0 | 1,654 (+10%) | 14mo | $280,000 | $169 | 42 |
Match score weights: distance 35% · size 25% · config 20% · recency 20%. Top-matched comps best support the ARV.
Projected returns pro-forma
10.0% appreciation · 3.0% rent growth · sell at horizon
- IRR
- 21.1%
- Equity multiple
- 2.71×
- Total profit
- $137,799
- Equity at exit
- $259,985
- IRR
- 19.1%
- Equity multiple
- 6.21×
- Total profit
- $421,157
- Equity at exit
- $560,667
Cash invested: $80,805 (down + closing). Projections, not guarantees.
Landlord ↔ Tenant lean methodology
- Overall (STATE)
- 62 Landlord-Friendly
- State Pennsylvania
- 62 Landlord-Friendly · EVEN
- County
- — inherits STATE
- City
- — inherits STATE
ZIP-level market 18222
- Home prices YoY
- 10.2%
- Active inventory
- 136
- Price-to-rent
- 11.1×
Monthly cashflow live
- Estimated rent
- $2,164 medium interval (Pro) →
- Mortgage (P&I)
- −$1,513
- Tax est. 1.5%
- −$361 /mo · $4,329/yr
- Insurance
- −$120
- HOA
- −$20
- Vacancy / Maint / Mgmt
- −$454
- Net cashflow
- $-305
Break-even live
Sensitivity live
| Price | -10% $-105 | -5% $-205 | +0% $-305 | +5% $-405 | +10% $-504 |
|---|---|---|---|---|---|
| Rent | -10% $-476 | -5% $-390 | +0% $-305 | +5% $-219 | +10% $-134 |
| Rate | -1.0pp $-160 | -0.5pp $-231 | base $-305 | +0.5pp $-380 | +1.0pp $-456 |
UW: 25.0% down · 7.5% · 30yr · 1.5% tax · 5.0% vac · 8.0% maint · 8.0% mgmt
Financing live
Cash to close
- Down payment
- $72,148
- Closing costs
- $8,658
- Reserves months
- —
- Total cash needed
- —
Loan-product check · same deal, 3 products live
Conventional
25% down · 7.5% · 30yr
- Down + closing
- —
- Monthly P&I
- —
- Monthly cashflow
- —
- DSCR
- —
- Eligible?
- —
Personal DTI + credit; lowest rate.
DSCR
20% down · 8.5% · 30yr
- Down + closing
- —
- Monthly P&I
- —
- Monthly cashflow
- —
- DSCR
- —
- Eligible?
- —
No personal income docs; deal must DSCR.
Hard money
10% down · 12.0% · 12mo
- Down + closing
- —
- Monthly P&I
- —
- Monthly cashflow
- —
- DSCR
- —
- Eligible?
- —
Short-term bridge; refi at stabilization.
Rent comps 4 comps
| Address | Beds | Baths | Sqft | Rent | $/sqft | DOM | Units | Dist |
|---|---|---|---|---|---|---|---|---|
| 860 Champions Dr Drums, PA | 3.0 | 2.5 | 1510 | $2,200 | $1.46 | 45d | 1 | 0.10mi |
| 16 Scotia Dr Drums, PA | 3.0 | 2.5 | 1650 | $2,240 | $1.36 | 23d | 1 | 0.96mi |
| 11 Lazy Ln Drums, PA | 2.0 | 2.0 | 1063 | $1,815 | $1.71 | 15d | 1 | 1.08mi |
| 227 Sand Springs Dr Drums, PA | 2.0 | 2.0 | 1052 | $1,805 | $1.72 | 23d | 1 | 1.22mi |
HOA detail
- Monthly dues
- $20 · $240/yr
Listing history 8 events
-
2026-06-03status $288,590 Pending 194 DOM
-
2026-06-02days on market $288,590 Active 194 DOM
-
2026-06-01days on market $288,590 Active 193 DOM
-
2026-05-31days on market $288,590 Active 192 DOM
-
2026-05-30days on market $288,590 Active 191 DOM
-
2026-03-12status Active 362-char remark
Show marketing remark (362 chars)
MOVE IN READY!!The Greens at Sand Springs are both elegant and spacious, with a floorplan that will make you feel right at home. Upon entering, you'll be welcomed by an open-concept first floor, featuring a Kitchen that has everything you need for cooking and entertaining complete with a large island for extra seating, ample counter space, a convenient pantry.
-
2026-02-16status Pending 362-char remark
Show marketing remark (362 chars)
MOVE IN READY!!The Greens at Sand Springs are both elegant and spacious, with a floorplan that will make you feel right at home. Upon entering, you'll be welcomed by an open-concept first floor, featuring a Kitchen that has everything you need for cooking and entertaining complete with a large island for extra seating, ample counter space, a convenient pantry.
-
2025-10-27$288,590 Active 362-char remark
Show marketing remark (362 chars)
MOVE IN READY!!The Greens at Sand Springs are both elegant and spacious, with a floorplan that will make you feel right at home. Upon entering, you'll be welcomed by an open-concept first floor, featuring a Kitchen that has everything you need for cooking and entertaining complete with a large island for extra seating, ample counter space, a convenient pantry.
ⓘ Source: listings_history table (triggers on properties + properties_extension) + one-shot
backfill from property_details.listing_events for pre-trigger history.
Climate risk First Street
- Flood 6/10 Major FEMA zone X (unshaded) · 75% chance over 30 yrs
- Wildfire 1/10 Low
- Heat 2/10 Low 7 d/yr ≥93°F today · 16 d/yr by 30 yrs out
- Wind 3/10 Moderate 7% chance of damaging wind over 30 yrs
- Air quality 2/10 Low 1 unhealthy d/yr today · 2 by 30 yrs out
Nearby sold comps map
Loading sold comps map…
Walkable amenities ~0.75 mi
Loading nearby amenities…
Taxation est. · year 1
- Rental income
- $25,967
- − Mortgage interest
- −$16,166
- − Property taxes
- −$4,329
- − Insurance
- −$1,443
- − Repairs & maintenance
- −$2,077
- − Management
- −$2,077
- − HOA
- −$240
- − Depreciation
- −$8,395
- Taxable loss
- −$8,761
- Est. tax savings @ 24.0%
- +$2,103
- After-tax cash flow
- $-1,556/yr
For passive investors: Depreciation is non-cash, so a rental often shows a tax loss while cash-flowing — sheltering income. Rental losses are passive: they offset passive income freely, and up to $25,000/yr can offset ordinary (W-2) income if you actively participate and your MAGI is under $100k (phasing out to $0 by $150k); unused losses carry forward. On sale, claimed depreciation is recaptured at up to 25%, and gains may owe capital-gains tax (a 1031 exchange can defer both). Figures are a year-1 estimate at your 24.0% rate — not tax advice; consult a CPA.
Schools (NCES district)
- District
- Hazleton Area SD
- NCES district ID
- 4211700
- Math proficiency
- 18% ▼ -3.00%
- Reading proficiency
- 30% ▼ -15.00%
- Median HH income
- $42,247
- Composite
- 20.44/100
- National rank
- #8582
- State rank
- #476 of 539 in PA
Livability — Beech Mountain Lakes
- Score
- 71/100
- State rank
- #698
- US rank
- #6837
Category grades
Schools grade is shown separately in the Schools card above.
Census & demographics
- Population (ZIP)
- 9,946
Population outlook (Luzerne County) Hauer SSP2
- Today (2025)
- 319,505 people
- By 2030
- 319,943 · +0.1%
- By 2040
- 322,643 · +1.0%
- By 2050
- 330,817 · +3.5%
- By 2075
- 379,145 · +18.7%
- By 2100
- 431,908 · +35.2%
Race, ethnicity, and origin ACS 2023
- Neighborhood character
- Predominantly White (86%)
- Race & ethnicity
- White 86% Hispanic / Latino 7% Two or more races 7% Black 2%
- Hispanic origin (detail)
- Puerto Rican 2% Dominican 4%
- Common ancestry
- Romanian 10% Scotch-Irish 2% Iranian 2%
- Foreign-born
- 2% · Canada
- Languages at home
- 94% English-only · Spanish 3% Other Indo-European 1% Arabic 1%
Political lean MEDSL · Luzerne
- 2024 margin
- R (+19.2) · D 40.0% · R 59.2%
- 2008→2024 swing
- -27.6pp toward R · 2008: 8.4pp · 2024: -19.2pp
- All cycles
- 2024: R+19.2 2020: R+14.4 2016: R+19.6 2012: D+4.8 2008: D+8.4
Not yet ingested
- Civics
- —
Market trends
- HPI YoY
- ▲ 28.01%
- Current HPI
- 302.4923
- Rent YoY
- —
- Metro
- —
- State GDP YoY
- ▲ 1.68%
- F500 in state
- 34
Industry mix (Fortune 500 HQ in PA)
| Industry | F500 HQs | Revenue |
|---|---|---|
| Healthcare | 2 | $309B |
|
||
| Insurance | 2 | $27B |
|
||
| Telecommunications / Media | 1 | $124B |
|
||
| Industrial Distribution | 1 | $22B |
|
||
| Financial Services | 1 | $20B |
|
||
| Chemicals / Materials | 1 | $18B |
|
||
Price history
3 events — show timeline
- 2026-03-12 Relisted — LCAR
- 2026-02-16 Pending — LCAR
- 2025-10-27 Listed $288,590 LCAR
Cash-flow waterfall
monthlySold comps — $/sqft
last 12 mo · ≤1 miLoading sold comps…