 🏢 Co-op
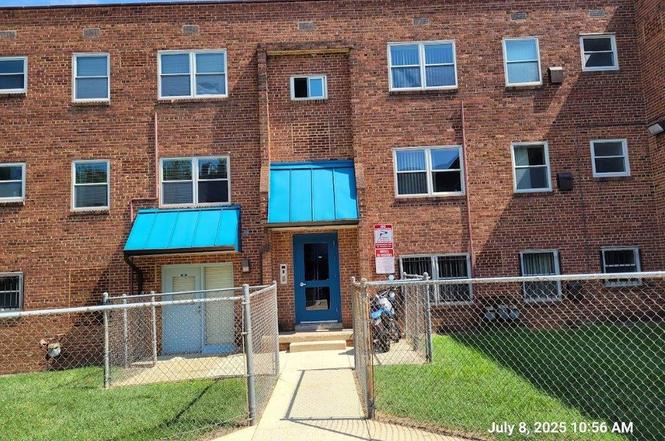
2642 Birney Place, SE #101 · Washington, DC
Flood risk 1/10 · Minimal
- FEMA flood zone
- X (unshaded)
- Chance of flooding over 30 yrs
- 0.0%
- Est. flood insurance / yr
- $473 – $860
Fire risk 1/10 · Minimal
- Est. fire insurance / yr
- $631 – $1,173
Heat risk 7/10 · Major
- Hot days now (above 104°F)
- 7 days/yr
- Hot days in 30 yrs
- 15 days/yr
Wind risk 4/10 · Minor
- Chance of severe wind over 30 yrs
- 21.0%
Air-quality risk 4/10 · Minor
- Unhealthy air days now
- 4 days/yr
- Unhealthy air days in 30 yrs
- 5 days/yr
Risk factors via First Street. Map © Google.
Why this score? — see what drove the B grade
The composite is a weighted blend of 9 inputs, each scored 0–100. Each bar is that input's sub-score; the figure is the points it added to the 100-point composite (weight × sub-score).
- Cash flow +30.0/30.0
- 1% rule +10.0/10.0
- DSCR +10.0/10.0
- ARV discount +7.5/15.0
- Livability +3.7/5.0
- Schools +3.6/10.0
- Rent growth +3.5/5.0
- Condition / age +2.5/5.0
- Appreciation +0.0/10.0
$129,900
🖨 Deal sheet 📄 Offer letter ✓ Due diligence
Listing remarks
Not a lease. .. an unusual offer of a delayed purchase option to create homeownership. Remodeled 1BR Accessible market rate Co-op Unit is available for Sale with conventional financing at the List Price of $129,900, OR based on Listing DCDC2215926, a qualified Buyer can enter into 2 or 3 year installment sale agreement to occupy while qualifying to purchase. Installment plan requires $1,300 down payment/deposit, $1,050 monthly pre-settlement use fee, $1,150 use fee in months 13-24 then $1,250. Buyers in good standing after first 12 months, eligible to buy with deferred payment down payment assistance of up to 20% of price ($25,980 max) from Seller (3%annual simple interest charge max $779.4
Key facts
- $210 HOA
- 80 parking spots
- Built 1952
Property features AI
Finance
- Other: Not in a federal flood zone; Pets allowed with restrictions (cats and dogs case-by-case; breed, number and size/weight limits may apply); Building contains 28 total units; Accessibility features noted (36"+ halls, no stairs)
- HOA & community: Monthly cooperative fee of $210; Fee covers common area maintenance, exterior building maintenance, insurance, lawn maintenance, management, recreation facility, reserve funds, road maintenance, snow removal, taxes, trash, water and other items; Community amenities include basketball courts, common grounds, community center, exercise room, fax/copying and other facilities; Property manager present
Exterior
- Parking: Approximately 80 off-street parking spaces; Parking lot and on-street parking; Permit included
- Utilities: Natural gas hot water; Natural gas heating available; Electric cooling and power available; Community water; Public sewer
- Home design: Garden-style building (1–4 floors); Unit/flat; Entry on level 1; Urban location; Cooperative ownership; Good property condition; Building known as NEW PARKCHESTER HOUSING CO-OP
- Construction: Brick construction; Tar and gravel roof; Double-hung, ENERGY STAR qualified, vinyl-clad windows with screens; Built/major remodel recorded as 1992 (effective year source: assessor)
- Exterior features: Paved parking; On-street parking available; General common elements for parking; Community water; Public sewer; Cable TV and electric available; Natural gas available
Interior
- Kitchen: Built-in microwave; Self-cleaning oven; Disposal; ENERGY STAR refrigerator; Water heater
- Bedrooms: One main-level bedroom
- Flooring: No basement (no below-grade living area indicated)
- Bathrooms: One full bathroom (one on main level)
- Heating & cooling: Central forced-air heating (natural gas); Central air conditioning (electric); Roof-mounted cooling
- Interior features: Window treatments; Intercom; 36"+ wide halls; No stairs (accessible); Not furnished; Estimated living area
- Laundry & utility: Front-loading washer in unit; Front-loading dryer in unit; Washer/dryer stacked option; ENERGY STAR clothes washer
Neighborhood map
What this means for you Summary
Snapshot
- This is a 1-bed/1.0-bath condo listed at $130k.
Deal economics
- At list price, monthly cash flow is $493 ($6k/yr) — positive.
- The deal already cash-flows at list — no discount required.
- Meets the 1% rule at list price ($2k rent vs $130k).
- Recommended offer: $114k (12.0% below list) — sets the bar for market timing.
- Cap rate 10.9% vs local median 2.5% in Washington — top-decile yield for the area; either an underpriced asset or a hidden risk that comps aren't pricing in. Stress-test before assuming the spread holds.
Location & tenants
- Location reads 73/100 on livability (#1 in DC) — a middle-class / working-renter tenant base. Strengths: amenities A+, commute A+, employment A+; Watch: crime F, cost of living F.
- District Of Columbia Public Schools (urban): math 33% / reading 40% proficiency, ranked #8 of 32 in DC (top 25%) — families likely to look elsewhere, expect single-tenant / working-renter base with shorter leases; 65% free/reduced lunch — lower-income household profile, screen leases tightly.
- Zoned schools: Savoy Es (238 students, 0% FRL); Kramer Ms (203 students, 0% FRL); Anacostia Hs (287 students, 0% FRL) — zoned schools average 0% FRL vs 65% district-wide (65 pts lower); this property's tenant base skews higher-income than the district average.
- Market conditions: Rents rising (+3.9%/yr); 296 active listings in the ZIP; 40 comparable units currently listed for rent nearby; rentals at typical pace (median 17d on market — plan ~3-4 weeks tenant-placement turnaround); 1,737 units permitted in District of Columbia in 2024 (1,506 in 5+ unit buildings).
- At $2,027/mo this rent would consume 45% of the median local household income ($54k/yr) (locally 5148% of renters already pay >50% of income on rent) — very limited rent-growth headroom before tenants either downsize or default.
Forward outlook
- Local home prices are declining (-3.0%/yr); year-one equity from $898 of loan paydown is wiped out by about $4k of value loss. Plan a longer hold.
- District of Columbia County population projected at +50% by 2050 — long-run rental-demand tailwind backs the buy-and-hold thesis.
- At projected returns (-3.0% appreciation + 3.9% rent growth), your $36k cash investment doubles in ~7 years — after that, you're playing with house money.
Negotiation context
- It's been on market 305 days — a 12% lower offer ($114k) is reasonable based on typical stale-listing flexibility.
- 2 sale attempts with the ask held roughly flat each time — persistent listings suggest the price (not the market) is what's stuck; bring a comps-based counter.
Risks & watch-outs
- Watch-outs: built in 1952 — expect roof / HVAC / electrical / plumbing capex.
- Climate carrying-cost: extreme-heat days projected 7→15/yr by 2055 (HVAC capex compounding) — expect insurance premiums to compound above CPI over the hold.
Questions for the listing agent
- It's been on market 305 days. Have you received any prior offers? Is the seller open to a 12% concession, seller financing, or rate buy-down credit?
- Built in 1952 — when were the roof, HVAC, electrical panel, plumbing, and water heater last replaced?
- What does the HOA fee cover, when was the last increase, and are there any pending special assessments or reserve-fund shortfalls?
- Any open or pending special assessments — roof, HVAC, plumbing, elevator, façade? What's the per-unit balance and payoff schedule, and is the seller paying it off at close or rolling it to the buyer?
- Why hasn't it sold? Are there any deal-killer items the seller is aware of (foundation, flood, title, zoning, code violations)?
- Is there a deadline driving the sale (1031 exchange, divorce, estate, relocation)? That informs how much negotiation room exists.
- Crime grade is F in this area — have there been break-ins, vandalism, or insurance claims at this property in the last 3 years? What carrier currently insures it and at what premium?
- What's the average days-on-market for RENTAL listings here right now (not sales)? A rising rental-DOM trend means longer vacancies and softer asking-rent achievability than the comps imply.
- What's the recent tenant-quality profile in this submarket — average credit score on applications, eviction rate, late-payment / NSF rate, and stable-employment percentage? A property-management company in the area should have these aggregated.
- How much new apartment / multifamily construction is in the pipeline within 1–3 miles? Heavy new supply (>2% of stock underway) typically softens rents 12–24 months out; light construction supports rent growth.
Investment metrics
- 1% rule
- 1.56% ✓
- Cap rate
- 10.85%
- Cash-on-cash
- 16.28%
- DSCR
- 1.72
- GRM
- 5.3
CMA / ARV
No comps found within radius.
Projected returns pro-forma
-3.0% appreciation · 3.86% rent growth · sell at horizon
- IRR
- 8.5%
- Equity multiple
- 1.34×
- Total profit
- $12,305
- Equity at exit
- $19,369
- IRR
- 18.6%
- Equity multiple
- 2.63×
- Total profit
- $59,215
- Equity at exit
- $11,231
Cash invested: $36,372 (down + closing). Projections, not guarantees.
Landlord ↔ Tenant lean methodology
- Overall (CITY)
- 0 Strongly Tenant-Friendly
- State District of Columbia
- 12 Strongly Tenant-Friendly · D+43
- County
- — inherits STATE
- City Washington
- 0 Strongly Tenant-Friendly · D+43
ZIP-level market 20020
- Rents YoY
- 3.9%
- Active inventory
- 296
- Price-to-rent
- 5.3×
Monthly cashflow live
- Estimated rent
- $2,027 high interval (Pro) →
- Mortgage (P&I)
- −$681
- Tax est. 1.5%
- −$162 /mo · $1,948/yr
- Insurance
- −$54
- HOA
- −$210
- Vacancy / Maint / Mgmt
- −$426
- Net cashflow
- $493
Break-even live
UW: 25.0% down · 7.5% · 30yr · 1.5% tax · 5.0% vac · 8.0% maint · 8.0% mgmt
Financing live
Cash to close
- Down payment
- $32,475
- Closing costs
- $3,897
- Reserves months
- —
- Total cash needed
- —
Loan-product check · same deal, 3 products live
Conventional
25% down · 7.5% · 30yr
- Down + closing
- —
- Monthly P&I
- —
- Monthly cashflow
- —
- DSCR
- —
- Eligible?
- —
Personal DTI + credit; lowest rate.
DSCR
20% down · 8.5% · 30yr
- Down + closing
- —
- Monthly P&I
- —
- Monthly cashflow
- —
- DSCR
- —
- Eligible?
- —
No personal income docs; deal must DSCR.
Hard money
10% down · 12.0% · 12mo
- Down + closing
- —
- Monthly P&I
- —
- Monthly cashflow
- —
- DSCR
- —
- Eligible?
- —
Short-term bridge; refi at stabilization.
Rent comps 40 comps
| Address | Beds | Baths | Sqft | Rent | $/sqft | DOM | Units | Dist |
|---|---|---|---|---|---|---|---|---|
| 1300 Morris Rd SE Washington, DC | 2.0 | 1.0 | 650 | $1,499 | $2.31 | 24d | 1 | 0.48mi |
| 2228 Martin Luther King Jr Ave SE Washington, DC | 1.0 | 1.0 | 606 | $1,790 | $2.95 | 3d | 5 | 0.50mi |
| 650 Howard Rd SE Washington, DC | 3.0 | 1.0–2.0 | 852 | $2,687 | $3.15 | 1d | 53 | 0.50mi |
| 632 Howard Rd SE Washington, DC | 2.0 | 1.0–2.0 | 673 | $3,216 | $4.78 | 20d | 112 | 0.53mi |
| 632 Howard Rd SE Unit 434 Washington, DC | 1.0 | 1.0 | 623 | $2,761 | $4.43 | 16d | 1 | 0.53mi |
| 632 Howard Rd SE Unit 531 Washington, DC | 1.0 | 1.0 | 632 | $2,761 | $4.37 | 19d | 1 | 0.53mi |
| 600 Howard Rd SE Washington, DC | 2.0 | 1.0–2.5 | 805 | $4,132 | $5.13 | 1d | 89 | 0.56mi |
| 1425-1429 Cedar St SE Washington, DC | 1.0 | 1.0 | 644 | $1,419 | $2.20 | 2d | 5 | 0.64mi |
| 407 Lebaum St SE Unit 1 Washington, DC | 1.0 | 1.0 | 550 | $1,700 | $3.09 | 2d | 1 | 0.69mi |
| 407 Lebaum St SE Unit 4 Washington, DC | 2.0 | 1.0 | 550 | $1,750 | $3.18 | 2d | 1 | 0.69mi |
| 430 Mellon St SE Unit 2 Washington, DC | 1.0 | 1.0 | 650 | $1,200 | $1.85 | 24d | 1 | 0.71mi |
| 1619 Butler St SE Unit 3 Washington, DC | 2.0 | 1.0 | 700 | $1,700 | $2.43 | 24d | 1 | 0.72mi |
| 212 Oakwood St SE Unit B2 Washington, DC | 1.0 | 1.0 | 597 | $1,650 | $2.76 | 24d | 1 | 0.80mi |
| 535 Mellon St SE Unit 5 Washington, DC | 1.0 | 1.0 | 700 | $1,350 | $1.93 | 20d | 1 | 0.82mi |
| 535 Mellon St SE Washington, DC | 1.0 | 1.0 | 700 | $1,350 | $1.93 | 24d | 1 | 0.82mi |
| 215 Oakwood St SE Unit 302 Washington, DC | 1.0 | 1.0 | 700 | $1,080 | $1.54 | 24d | 1 | 0.83mi |
| 1201 Oak Dr SE Washington, DC | 3.0 | 1.0–2.0 | 853 | $1,531 | $1.79 | 1d | 19 | 0.85mi |
| 562 Malcolm X Ave SE Unit 4 Washington, DC | 2.0 | 1.0 | 550 | $1,600 | $2.91 | 11d | 1 | 0.88mi |
| 2341 Green St SE Washington, DC | 2.0 | 1.0 | 741 | $1,225 | $1.65 | 24d | 1 | 0.89mi |
| 2942 2nd St SE Washington, DC | 1.0–2.0 | 1.0–2.0 | 762 | $1,299 | $1.70 | 3d | 9 | 0.89mi |
| 447 Orange St SE #3 Washington, DC | 2.0 | 1.0 | 700 | $1,500 | $2.14 | 4d | 1 | 0.90mi |
| 88 V St SW Washington, DC | 1.0–2.0 | 1.5–2.0 | 745 | $2,600 | $3.49 | 21d | 3 | 0.92mi |
| 88 V St SW Washington, DC | 1.0–2.0 | 1.5 | 682 | $2,600 | $3.81 | 18d | 2 | 0.92mi |
| 1900 Half St SW Washington, DC | 3.0 | 1.0–2.0 | 862 | $2,740 | $3.18 | 1d | 51 | 0.93mi |
| 327 Parkland Pl SE Washington, DC | 1.0 | 1.0 | 650 | $1,199 | $1.84 | 24d | 1 | 0.95mi |
| 2121 1st St SW Washington, DC | 2.0 | 1.0–2.0 | 807 | $3,162 | $3.92 | 1d | 38 | 0.98mi |
| 2099 1st St SW Washington, DC | 6.0 | 1.0–4.0 | 916 | $2,424 | $2.65 | 1d | 175 | 0.99mi |
| 1800 Half St SW Washington, DC | 2.0 | 1.0–2.0 | 881 | $2,917 | $3.31 | 2d | 30 | 0.99mi |
| 101 V St SW Washington, DC | 2.0 | 1.0–2.5 | 878 | $4,588 | $5.22 | 2d | 117 | 1.00mi |
| 1600 Marion Barry Ave SE Unit Basement -B01 Washington, DC | 1.0 | 1.0 | 550 | $1,550 | $2.82 | 24d | 1 | 1.00mi |
| 2000 2nd St SW Washington, DC | 2.0 | 1.0–2.0 | 1046 | $3,878 | $3.71 | 3d | 188 | 1.02mi |
| 71 Potomac Ave SE Washington, DC | 2.0 | 1.0–2.0 | 771 | $3,213 | $4.16 | 1d | 28 | 1.03mi |
| 79 Potomac Ave SE Washington, DC | 2.0 | 1.0–2.0 | 928 | $3,214 | $3.46 | 1d | 20 | 1.05mi |
| 1244 Savannah Pl SE Unit B Washington, DC | 1.0 | 1.0 | 700 | $1,395 | $1.99 | 24d | 1 | 1.06mi |
| 79 Potomac Ave SE #718 Washington, DC | 1.0 | 1.0 | 556 | $2,500 | $4.50 | 20d | 1 | 1.07mi |
| 1721 T St SE Washington, DC | 1.0–2.0 | 1.0 | 785 | $1,350 | $1.72 | 21d | 6 | 1.11mi |
| 1847 Marion Barry Ave SE Washington, DC | 1.0–2.0 | 1.0 | 725 | $1,250 | $1.72 | 24d | 1 | 1.12mi |
| 1346 4th St SE Washington, DC | 2.0 | 1.0–2.0 | 864 | $2,814 | $3.26 | 1d | 25 | 1.14mi |
| 1331 4th St SE Washington, DC | 2.0 | 1.0–2.0 | 838 | $3,504 | $4.18 | 1d | 18 | 1.14mi |
| 3321 13th St SE Unit 3 Washington, DC | 2.0 | 1.0 | 703 | $1,750 | $2.49 | 24d | 1 | 1.14mi |
HOA detail condo
- Monthly dues
- $210 · $2,520/yr
- Assessments
- None detected in remarks — confirm with the listing agent.
Listing history 16 events
-
2026-06-18days on market $129,900 Active 305 DOM
-
2026-06-17days on market $129,900 Active 304 DOM
-
2026-06-16days on market $129,900 Active 303 DOM
-
2026-06-15days on market $129,900 Active 302 DOM
-
2026-06-13days on market $129,900 Active 300 DOM
-
2026-06-09days on market $129,900 Active 296 DOM
-
2026-06-08days on market $129,900 Active 295 DOM
-
2026-06-07days on market $129,900 Active 294 DOM
-
2026-06-04days on market $129,900 Active 291 DOM
-
2026-06-03days on market $129,900 Active 290 DOM
-
2026-06-02days on market $129,900 Active 289 DOM
-
2026-06-01days on market $129,900 Active 288 DOM
-
2026-05-31days on market $129,900 Active 287 DOM
-
2026-01-14historical
-
2025-08-18$129,900 Active
-
2025-08-17$129,900 Active
ⓘ Source: listings_history table (triggers on properties + properties_extension) + one-shot
backfill from property_details.listing_events for pre-trigger history.
Climate risk First Street
- Flood 1/10 Low FEMA zone X (unshaded) · 0% chance over 30 yrs
- Wildfire 1/10 Low
- Heat 7/10 Severe 7 d/yr ≥104°F today · 15 d/yr by 30 yrs out
- Wind 4/10 Moderate 21% chance of damaging wind over 30 yrs
- Air quality 4/10 Moderate 4 unhealthy d/yr today · 5 by 30 yrs out
Nearby sold comps map
Loading sold comps map…
Walkable amenities ~0.75 mi
Loading nearby amenities…
Taxation est. · year 1
- Rental income
- $24,321
- − Mortgage interest
- −$7,276
- − Property taxes
- −$1,948
- − Insurance
- −$650
- − Repairs & maintenance
- −$1,946
- − Management
- −$1,946
- − HOA
- −$2,520
- − Depreciation
- −$3,779
- Taxable income
- $4,256
- Est. tax owed @ 24.0%
- −$1,021
- After-tax cash flow
- $4,899/yr
For passive investors: Depreciation is non-cash, so a rental often shows a tax loss while cash-flowing — sheltering income. Rental losses are passive: they offset passive income freely, and up to $25,000/yr can offset ordinary (W-2) income if you actively participate and your MAGI is under $100k (phasing out to $0 by $150k); unused losses carry forward. On sale, claimed depreciation is recaptured at up to 25%, and gains may owe capital-gains tax (a 1031 exchange can defer both). Figures are a year-1 estimate at your 24.0% rate — not tax advice; consult a CPA.
Schools (NCES district)
- District
- District Of Columbia Public Schools
- NCES district ID
- 1100030
- Math proficiency
- 33% ▲ 3.00%
- Reading proficiency
- 40% ▲ 5.00%
- Median HH income
- $67,671
- Composite
- 35.84/100
- National rank
- #9606
- State rank
- #8 of 32 in DC
Livability — Washington
- Score
- 73/100
- State rank
- #1
- US rank
- #5327
Category grades
Schools grade is shown separately in the Schools card above.
Census & demographics
- Census place
- Washington, DC
- County
- District of Columbia · 671,873 people
- City population
- 671,873
- Metro
- Washington-Arlington-Alexandria, DC-VA-MD-WV
- Population (ZIP)
- 53,005
- Household income
- $54,032
- Rent vs Own
- Severe rent burden
- 5148.0
Population outlook (District of Columbia County) Hauer SSP2
- Today (2025)
- 821,926 people
- By 2030
- 899,517 · +9.4%
- By 2040
- 1,061,162 · +29.1%
- By 2050
- 1,231,493 · +49.8%
- By 2075
- 1,603,312 · +95.1%
- By 2100
- 1,847,141 · +124.7%
Race, ethnicity, and origin ACS 2023
- Neighborhood character
- Predominantly Black (90%)
- Race & ethnicity
- Black 90% Two or more races 3% Hispanic / Latino 3% White 3%
- Common ancestry
- Lithuanian 1%
- Foreign-born
- 3% · Canada
- Languages at home
- 95% English-only · Spanish 2% French/Haitian/Cajun 1%
Political lean MEDSL · District of Columbia
- 2024 margin
- Solid D (+86.1) · D 91.2% · R 5.1% · Other 3.8%
- 2008→2024 swing
- +0.1pp no change · 2008: 85.9pp · 2024: 86.1pp
- All cycles
- 2024: D+86.1 2020: D+86.8 2016: D+88.7 2012: D+84.2 2008: D+85.9
Not yet ingested
- Civics
- —
Market trends
- HPI YoY
- ▼ -415.44%
- Current HPI
- 306.5068
- Rent YoY
- ▲ 3.86%
- Metro
- Washington-Arlington-Alexandria, DC-VA-MD-WV
- State GDP YoY
- ▲ 1.33%
- F500 in state
- 6
Industry mix (Fortune 500 HQ in DC)
| Industry | F500 HQs | Revenue |
|---|---|---|
| Financial Services | 1 | $153B |
|
||
| Life Sciences / Industrials | 1 | $25B |
|
||
| Industrial Machinery | 1 | $8B |
|
||
Price history
+0.0% since first listed3 events — show timeline
- 2026-01-14 Listing Removed — BRIGHT MLS
- 2025-08-18 Listed $129,900 BRIGHT MLS
- 2025-08-17 Listed $129,900 BRIGHT MLS
Cash-flow waterfall
monthlySold comps — $/sqft
last 12 mo · ≤1 miLoading sold comps…