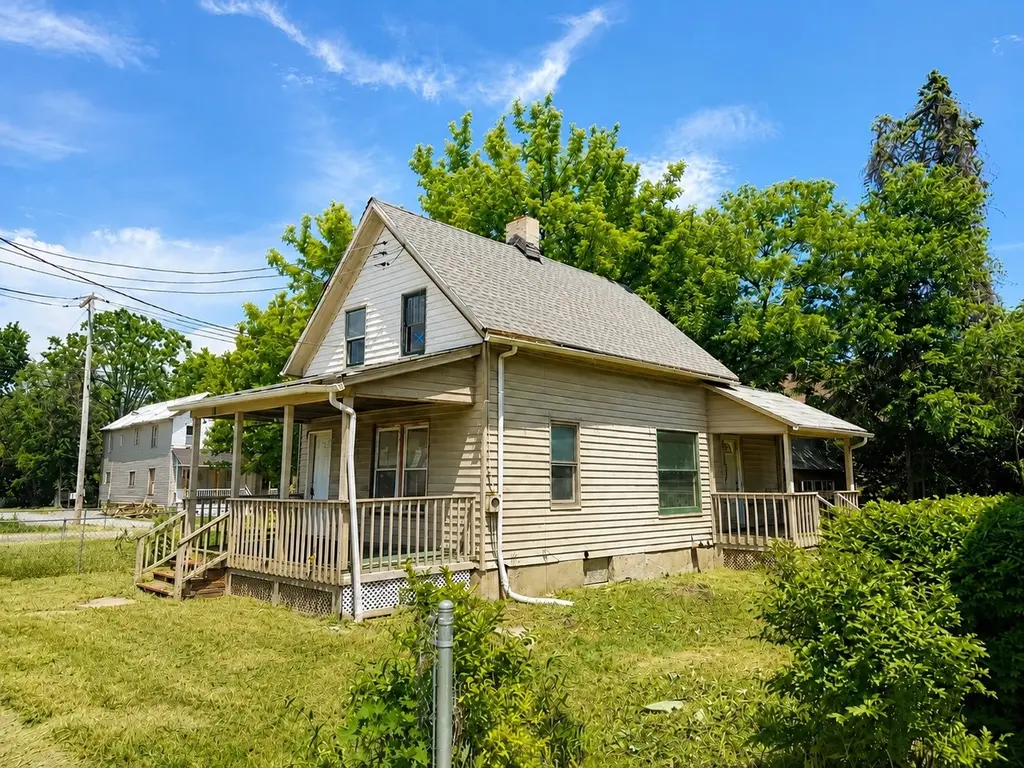
10 + 12 Jarvis St · Binghamton, NY
Flood risk 1/10 · Minimal
- FEMA flood zone
- X
- Chance of flooding over 30 yrs
- 0.0%
- Est. flood insurance / yr
- $473 – $860
Fire risk 3/10 · Minor
- Est. fire insurance / yr
- $691 – $1,283
Heat risk 3/10 · Minor
- Hot days now (above 92°F)
- 7 days/yr
- Hot days in 30 yrs
- 16 days/yr
Wind risk 2/10 · Minimal
- Chance of severe wind over 30 yrs
- 1.0%
Air-quality risk 2/10 · Minimal
- Unhealthy air days now
- 0 days/yr
- Unhealthy air days in 30 yrs
- 1 days/yr
Risk factors via First Street. Map © Google.
Why this score? — see what drove the B grade
The composite is a weighted blend of 9 inputs, each scored 0–100. Each bar is that input's sub-score; the figure is the points it added to the 100-point composite (weight × sub-score).
- Cash flow +30.0/30.0
- 1% rule +10.0/10.0
- DSCR +10.0/10.0
- ARV discount +9.9/15.0
- Rent growth +5.0/5.0
- Livability +3.9/5.0
- Schools +3.0/10.0
- Condition / age +2.5/5.0
- Appreciation +0.0/10.0
$69,000
🖨 Deal sheet 📄 Offer letter ✓ Due diligence
Listing remarks MLS
2 bedroom cape featuring living room w/ fireplace detached garage all on 2 lots . HUD Case #371--393473 HUD HOME SOLD "AS IS " by elec. bid only. Prop available 4/19/25 bids due 11:59 PM Central Time 4/24/25 then daily until sold. un (unsured) . Eligible FHA 203K financing conventional or cash HUD HOME SOLD "AS IS " by elec. bid only
Key facts
- Newer roof
- Double lot
- Full basement
Tags
Property features AI
Exterior
- Parking: Detached garage with 1 garage space
- Utilities: Public water; Public sewer
- Home design: Single-family residence (residential); Residential multi-unit zoning
- Construction: Vinyl siding
- Exterior features: Covered porch; Deck; Fenced yard; Level lot
Interior
- Kitchen: Oven; Refrigerator
- Bedrooms: 7 total rooms (includes bedroom count within room total)
- Flooring: Hardwood floors
- Bathrooms: 1 full bathroom
- Heating & cooling: Forced air heating; No central cooling
- Interior features: Gas water heater; Oven; Refrigerator; Wood-burning masonry fireplace in the living room; Basement
- Laundry & utility: Washer hookup
Neighborhood map
What this means for you Summary
Snapshot
- This is a 2-bed/1.0-bath single-family listed at $69k.
Deal economics
- At list price, monthly cash flow is $270 ($3k/yr) — positive.
- The deal already cash-flows at list — no discount required.
- Meets the 1% rule at list price ($1k rent vs $69k).
- Cap rate 11.0% vs local median 6.4% in Binghamton — top-decile yield for the area; either an underpriced asset or a hidden risk that comps aren't pricing in. Stress-test before assuming the spread holds.
Location & tenants
- Location reads 78/100 on livability (#174 in NY, #2,710 nationally) — a middle-class / working-renter tenant base. Strengths: amenities A+, commute A+, cost of living A+; Watch: crime F, employment F.
- Binghamton City School District (urban): math 30% / reading 44% proficiency, ranked #557 of 590 in NY (top 94%) — families likely to look elsewhere, expect single-tenant / working-renter base with shorter leases; 61% free/reduced lunch — lower-income household profile, screen leases tightly.
- Zoned schools: Woodrow Wilson School (math 8% / reading 27%, grade F, #2,004 of 2,108 statewide, top 95%, 352 students, 76% FRL) — zoned schools average 76% FRL vs 61% district-wide (16 pts higher); higher-poverty schools than district average — tighter screening recommended.
- Zoned-school proficiency averages 17% at this address vs 37% district-wide (-20 pts) — the specific schools serving this property underperform the Binghamton City School District average; the district grade overstates school quality for this exact location.
- Market conditions: Rents rising fast (+11.2%/yr); 136 active listings in the ZIP; 37 comparable units currently listed for rent nearby; rentals lingering (median 44d on market — plan ~5-8 weeks vacancy on turnover, expect pricing pressure); 62% of comp listings sitting > 30 days — soft ceiling on asking rent; 340 units permitted in Broome County in 2024 (269 in 5+ unit buildings).
Forward outlook
- Local home prices are declining (-3.0%/yr); year-one equity from $477 of loan paydown is wiped out by about $2k of value loss. Plan a longer hold.
- Broome County population projected at -13% by 2050 — secular population decline; favor cash flow + early exit over multi-decade hold.
- At projected returns (-3.0% appreciation + 8.0% rent growth), your $19k cash investment doubles in ~6 years — after that, you're playing with house money.
Negotiation context
- Only 10 days on market — expect competitive offers; lowballing is unlikely to land.
- 2 sale attempts; this cycle's ask has dropped $6k (8%) from the opening price — seller is motivated, your offer sets the floor, not the list.
- Current owner paid $38k; list at $69k implies a 82% gain — meaningful room to come down on a strong offer.
Risks & watch-outs
- Watch-outs: property tax is 4.7% of price; built in 1920 — expect roof / HVAC / electrical / plumbing capex.
Questions for the listing agent
- Built in 1920 — when were the roof, HVAC, electrical panel, plumbing, and water heater last replaced?
- Property tax is high relative to price — has the assessment been appealed recently, and will the sale trigger a re-assessment?
- Is there a deadline driving the sale (1031 exchange, divorce, estate, relocation)? That informs how much negotiation room exists.
- Schools are D-rated, which usually means shorter tenancies and higher turnover. Who's the typical renter profile here, and what's been the actual vacancy rate?
- Crime grade is F in this area — have there been break-ins, vandalism, or insurance claims at this property in the last 3 years? What carrier currently insures it and at what premium?
- What's the average days-on-market for RENTAL listings here right now (not sales)? A rising rental-DOM trend means longer vacancies and softer asking-rent achievability than the comps imply.
- What's the recent tenant-quality profile in this submarket — average credit score on applications, eviction rate, late-payment / NSF rate, and stable-employment percentage? A property-management company in the area should have these aggregated.
- How much new for-sale + rental construction is in the pipeline within 1–3 miles? Heavy new supply typically softens prices + rents 12–24 months out; constrained supply supports both.
Investment metrics
- 1% rule
- 1.71% ✓
- Cap rate
- 11.00%
- Cash-on-cash
- 16.80%
- DSCR
- 1.75
- GRM
- 4.9
CMA / ARV
- ARV (on-the-fly)
- $72,900
- Comps found
- 7
Show comp detail 7 sales within ~0.75 mi
| Address | Dist | Beds/Ba | Sqft | Sold | Price | $/sf | Match |
|---|---|---|---|---|---|---|---|
| 10 Jarvis St | 0.00mi | 2/1.0 | 810 (0%) | 12mo | $38,000 | $47 | 90 |
| 17 Saint Cyril Ave | 0.33mi | 2/1.0 | 780 (-4%) | 12mo | $70,000 | $90 | 68 |
| 33 Elm St | 0.58mi | 2/1.5 | 787 (-3%) | 6mo | $111,000 | $141 | 61 |
| 11 Everett St | 0.41mi | 2/1.0 | 922 (+14%) | 7mo | $53,000 | $57 | 52 |
| 31 Cypress St | 0.65mi | 2/2.0 | 856 (+6%) | 14mo | $105,000 | $123 | 45 |
| 194 Matthews St | 0.73mi | 3/1.0 (+1) | 900 (+11%) | 10mo | $100,000 | $111 | 34 |
| 192 Matthews St | 0.73mi | 2/1.5 | 917 (+13%) | 13mo | $48,000 | $52 | 31 |
Match score weights: distance 35% · size 25% · config 20% · recency 20%. Top-matched comps best support the ARV.
Projected returns pro-forma
-3.0% appreciation · 8.0% rent growth · sell at horizon
- IRR
- 14.9%
- Equity multiple
- 1.64×
- Total profit
- $12,395
- Equity at exit
- $10,288
- IRR
- 27.8%
- Equity multiple
- 4.20×
- Total profit
- $61,823
- Equity at exit
- $5,966
Cash invested: $19,320 (down + closing). Projections, not guarantees.
Landlord ↔ Tenant lean methodology
- Overall (STATE)
- 15 Strongly Tenant-Friendly
- State New York
- 15 Strongly Tenant-Friendly · D+10
- County
- — inherits STATE
- City
- — inherits STATE
ZIP-level market 13905
- Home prices YoY
- -31.1%
- Rents YoY
- 11.2%
- Active inventory
- 136
- Price-to-rent
- 4.9×
Monthly cashflow live
- Estimated rent
- $1,178 high interval (Pro) →
- Mortgage (P&I)
- −$362
- Tax from tax record
- −$269 /mo · $3,231/yr
- Insurance
- −$29
- HOA
- −$0
- Vacancy / Maint / Mgmt
- −$247
- Net cashflow
- $270
Break-even live
UW: 25.0% down · 7.5% · 30yr · 1.5% tax · 5.0% vac · 8.0% maint · 8.0% mgmt
Financing live
Cash to close
- Down payment
- $17,250
- Closing costs
- $2,070
- Reserves months
- —
- Total cash needed
- —
Loan-product check · same deal, 3 products live
Conventional
25% down · 7.5% · 30yr
- Down + closing
- —
- Monthly P&I
- —
- Monthly cashflow
- —
- DSCR
- —
- Eligible?
- —
Personal DTI + credit; lowest rate.
DSCR
20% down · 8.5% · 30yr
- Down + closing
- —
- Monthly P&I
- —
- Monthly cashflow
- —
- DSCR
- —
- Eligible?
- —
No personal income docs; deal must DSCR.
Hard money
10% down · 12.0% · 12mo
- Down + closing
- —
- Monthly P&I
- —
- Monthly cashflow
- —
- DSCR
- —
- Eligible?
- —
Short-term bridge; refi at stabilization.
Rent comps 37 comps
| Address | Beds | Baths | Sqft | Rent | $/sqft | DOM | Units | Dist |
|---|---|---|---|---|---|---|---|---|
| 32 Edwards St Unit E-1-1 Binghamton, NY | 1.0 | 1.0 | 625 | $700 | $1.12 | 43d | 1 | 0.21mi |
| 32 Edwards St Unit T-1-2 Binghamton, NY | 1.0 | 1.0 | 550 | $600 | $1.09 | 43d | 1 | 0.21mi |
| 46 North St Unit 4 Binghamton, NY | 2.0 | 1.0 | 1000 | $1,600 | $1.60 | 13d | 1 | 0.30mi |
| 4 Erie St Unit 2 Binghamton, NY | 3.0 | 1.0 | 1075 | $1,200 | $1.12 | 43d | 1 | 0.32mi |
| 100 Walnut St Unit 2-L Binghamton, NY | 1.0 | 1.0 | 600 | $850 | $1.42 | 43d | 1 | 0.36mi |
| 82 Walnut St #7 Binghamton, NY | 1.0 | 1.0 | 650 | $900 | $1.38 | 43d | 1 | 0.39mi |
| 82 Walnut St Unit 5 Binghamton, NY | 1.0 | 1.0 | 680 | $950 | $1.40 | 43d | 1 | 0.39mi |
| 167 Oak St Unit 1 Binghamton, NY | 2.0 | 1.0 | 923 | $1,300 | $1.41 | 43d | 1 | 0.54mi |
| 263 Main St Binghamton, NY | 2.0 | 1.0 | 920 | $1,200 | $1.30 | 13d | 1 | 0.56mi |
| 28 Lydia St Unit 1-R Binghamton, NY | 2.0 | 1.0 | 770 | $1,200 | $1.56 | 44d | 1 | 0.57mi |
| 28 Lydia St Unit 2-F Binghamton, NY | 1.0 | 1.0 | 650 | $1,100 | $1.69 | 20d | 1 | 0.57mi |
| 73 Leroy St Unit 02 Binghamton, NY | 3.0 | 1.0 | 1100 | $1,950 | $1.77 | 43d | 1 | 0.59mi |
| 50 Front St Binghamton, NY | 1.0 | 1.0 | 1092 | $2,450 | $2.24 | 13d | 8 | 0.82mi |
| 30 Riverside Dr Unit 2R Binghamton, NY | 1.0 | 1.0 | 600 | $1,000 | $1.67 | 43d | 1 | 0.84mi |
| 159 Washington St Binghamton, NY | 1.0 | 1.0 | 725 | $1,372 | $1.89 | 43d | 4 | 0.87mi |
| 81 State St Unit 2 Binghamton, NY | 2.0 | 2.0 | 800 | $1,000 | $1.25 | 43d | 1 | 0.93mi |
| 80 State St Unit A 6 Loft Binghamton, NY | 1.0 | 1.0 | 800 | $1,200 | $1.50 | 43d | 1 | 0.96mi |
| 80 State St Unit A 6 1 Bed Binghamton, NY | 1.0 | 1.0 | 650 | $1,000 | $1.54 | 43d | 1 | 0.96mi |
| 80 State St Unit A 3-1 3 Bed Binghamton, NY | 3.0 | 3.0 | 900 | $900 | $1.00 | 43d | 1 | 0.96mi |
| 111 Glenwood Ave Unit 1 Binghamton, NY | 1.0 | 1.0 | 800 | $900 | $1.12 | 13d | 1 | 1.00mi |
| 127 Burbank Ave Unit 2 Johnson City, NY | 2.0 | 1.0 | 1032 | $1,000 | $0.97 | 20d | 1 | 1.20mi |
| 274 Chenango St Unit 1 Binghamton, NY | 1.0 | 1.0 | 850 | $1,200 | $1.41 | 43d | 1 | 1.25mi |
| 274 Chenango St Unit 4 Binghamton, NY | 1.0 | 1.0 | 550 | $950 | $1.73 | 13d | 1 | 1.25mi |
| 38 Carroll St Unit 21 Binghamton, NY | 1.0 | 1.0 | 800 | $1,050 | $1.31 | 43d | 1 | 1.28mi |
| 198 Court St Unit 10 Binghamton, NY | 2.0 | 1.0 | 550 | $1,250 | $2.27 | 43d | 1 | 1.28mi |
| 198 Court St Unit 6 Binghamton, NY | 2.0 | 1.0 | 550 | $1,350 | $2.45 | 43d | 1 | 1.28mi |
| 198 Court St Unit 10 Binghamton, NY | 2.0 | 1.0 | 700 | $1,200 | $1.71 | 20d | 1 | 1.28mi |
| 198 Court St Unit 11 Binghamton, NY | 2.0 | 1.0 | 550 | $1,300 | $2.36 | 43d | 1 | 1.28mi |
| 198 Court St Unit 6 Binghamton, NY | 2.0 | 1.0 | 700 | $1,350 | $1.93 | 20d | 1 | 1.28mi |
| 26 Doubleday St #2 Binghamton, NY | 2.0 | 1.0 | 850 | $1,400 | $1.65 | 44d | 1 | 1.32mi |
| 26 Doubleday St Binghamton, NY | 2.0 | 1.0 | 1000 | $1,350 | $1.35 | 43d | 1 | 1.32mi |
| 145 Floral Ave Unit 4 Johnson City, NY | 3.0 | 1.0 | 1095 | $1,250 | $1.14 | 20d | 1 | 1.33mi |
| 155 Willow St Unit 3 Johnson City, NY | 2.0 | 1.0 | 739 | $1,200 | $1.62 | 20d | 1 | 1.38mi |
| 11 Avenue A Unit !R Johnson City, NY | 1.0 | 1.0 | 615 | $980 | $1.59 | 20d | 1 | 1.41mi |
| 11 Avenue A Unit 3L Johnson City, NY | 2.0 | 1.0 | 651 | $1,250 | $1.92 | 20d | 1 | 1.41mi |
| 71 Mary St Unit 2 Binghamton, NY | 2.0 | 1.0 | 1100 | $1,300 | $1.18 | 13d | 1 | 1.47mi |
| 1 Euclid Ave Unit 1 Binghamton, NY | 3.0 | 1.0 | 1100 | $1,500 | $1.36 | 43d | 1 | 1.48mi |
Listing history 9 events
-
2026-06-16status $69,000 Pending 10 DOM
-
2026-06-15days on market $69,000 Active 10 DOM
-
2026-06-14days on market $69,000 Active 8 DOM
-
2026-06-13pricedays on market $69,000 Active 7 DOM
-
2026-06-10days on market $75,000 Active 5 DOM
-
2026-06-09days on market $75,000 Active 4 DOM
-
2026-06-08days on market $75,000 Active 3 DOM
-
2026-06-07remarks 683-char remark
-
2026-06-07$75,000 Active 2 DOM
ⓘ Source: listings_history table (triggers on properties + properties_extension) + one-shot
backfill from property_details.listing_events for pre-trigger history.
Tax reassessment forecast NY · Partial reset (capped growth)
- Current annual tax
- $3,231 · $269/mo
- Projected year-2 tax
- $3,231 · $269/mo
- Expected delta
- $0/yr ($0/mo · 0.0%)
ⓘ Screening estimate from a state-policy table — verify with the county assessor before closing.
Climate risk First Street
- Flood 1/10 Low FEMA zone X · 0% chance over 30 yrs
- Wildfire 3/10 Moderate
- Heat 3/10 Moderate 7 d/yr ≥92°F today · 16 d/yr by 30 yrs out
- Wind 2/10 Low 100% chance of damaging wind over 30 yrs
- Air quality 2/10 Low 0 unhealthy d/yr today · 1 by 30 yrs out
Nearby sold comps map
Loading sold comps map…
Walkable amenities ~0.75 mi
Loading nearby amenities…
Taxation est. · year 1
- Rental income
- $14,131
- − Mortgage interest
- −$3,865
- − Property taxes
- −$3,231
- − Insurance
- −$345
- − Repairs & maintenance
- −$1,130
- − Management
- −$1,130
- − Depreciation
- −$2,007
- Taxable income
- $2,421
- Est. tax owed @ 24.0%
- −$581
- After-tax cash flow
- $2,664/yr
For passive investors: Depreciation is non-cash, so a rental often shows a tax loss while cash-flowing — sheltering income. Rental losses are passive: they offset passive income freely, and up to $25,000/yr can offset ordinary (W-2) income if you actively participate and your MAGI is under $100k (phasing out to $0 by $150k); unused losses carry forward. On sale, claimed depreciation is recaptured at up to 25%, and gains may owe capital-gains tax (a 1031 exchange can defer both). Figures are a year-1 estimate at your 24.0% rate — not tax advice; consult a CPA.
Schools (NCES district)
- District
- Binghamton City School District
- NCES district ID
- 3604870
- Math proficiency
- 30% ▬ 0.00%
- Reading proficiency
- 44% ▲ 15.00%
- Median HH income
- $30,475
- Composite
- 30.09/100
- National rank
- #6342
- State rank
- #557 of 590 in NY
Livability — Binghamton
- Score
- 78/100
- State rank
- #174
- US rank
- #2710
Category grades
Schools grade is shown separately in the Schools card above.
Census & demographics
- Census place
- Binghamton, NY
- County
- Broome County · 126,805 people
- City population
- 65,170
- Metro
- Binghamton, NY
- Population (ZIP)
- 27,988
- Household income
- $53,362
- Rent vs Own
- Severe rent burden
- 1875.0
Population outlook (Broome County) Hauer SSP2
- Today (2025)
- 187,989 people
- By 2030
- 183,066 · -2.6%
- By 2040
- 172,228 · -8.4%
- By 2050
- 163,161 · -13.2%
- By 2075
- 153,641 · -18.3%
- By 2100
- 140,851 · -25.1%
Race, ethnicity, and origin ACS 2023
- Neighborhood character
- Predominantly White (68%)
- Race & ethnicity
- White 68% Asian 10% Black 10% Hispanic / Latino 7% Two or more races 7%
- Hispanic origin (detail)
- Mexican 2% Puerto Rican 3%
- Common ancestry
- Romanian 5% Lithuanian 3% Iranian 1%
- Foreign-born
- 11% · Canada, China, Vietnam
- Languages at home
- 87% English-only · Other Indo-European 5% Spanish 2% Other Asian/Pacific 1%
Political lean MEDSL · Broome
- 2024 margin
- Toss-up / Even · D 50.2% · R 49.8%
- 2008→2024 swing
- -7.6pp toward R · 2008: 8.0pp · 2024: 0.4pp
- All cycles
- 2024: D+0.4 2020: D+3.5 2016: R+3.7 2012: D+4.6 2008: D+8.0
Not yet ingested
- Civics
- —
Market trends
- HPI YoY
- ▼ -134.70%
- Current HPI
- 298.9847
- Rent YoY
- ▲ 11.19%
- Metro
- Binghamton, NY
- State GDP YoY
- ▲ 2.60%
- F500 in state
- 92
Industry mix (Fortune 500 HQ in NY)
| Industry | F500 HQs | Revenue |
|---|---|---|
| Financial Services | 10 | $950B |
|
||
| Consumer Goods | 9 | $162B |
|
||
| Insurance | 4 | $225B |
|
||
| Telecommunications | 2 | $144B |
|
||
| Pharmaceuticals | 2 | $112B |
|
||
| Media / Entertainment | 2 | $69B |
|
||
Price history
+93.9% since first listed8 events — show timeline
- 2026-06-05 Listed $75,000 GBAOR
- 2025-06-16 Sold (Public Records) $38,000 Public Records
- 2025-06-13 Sold (MLS) $38,000 GBAOR
- 2025-05-08 Pending — GBAOR
- 2025-04-19 Listed $38,000 GBAOR
- 2024-02-22 Sold (Public Records) $172,056 Public Records
- 2008-12-16 Sold (Public Records) $62,200 Public Records
- 2000-12-22 Sold (Public Records) $38,675 Public Records
Property tax history
+4.7%/yrLatest (2025): $3,231 · +0.9% YoY. Source: county tax records.
Cash-flow waterfall
monthlySold comps — $/sqft
last 12 mo · ≤1 miLoading sold comps…