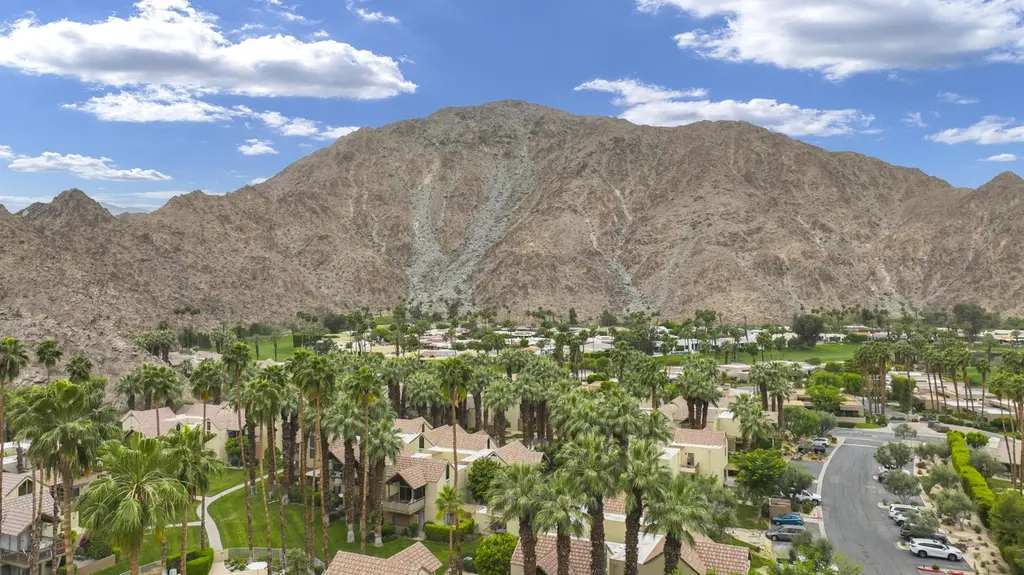
78225 Cortez Ln #185 · Indian Wells, CA
Flood risk 1/10 · Minimal
- FEMA flood zone
- X (shaded)
- Chance of flooding over 30 yrs
- 0.0%
- Est. flood insurance / yr
- $507 – $1,088
Fire risk 5/10 · Moderate
- Est. fire insurance / yr
- $659 – $1,223
Heat risk 9/10 · Severe
- Hot days now (above 114°F)
- 6 days/yr
- Hot days in 30 yrs
- 15 days/yr
Wind risk 1/10 · Minimal
- Chance of severe wind over 30 yrs
- —
Air-quality risk 4/10 · Minor
- Unhealthy air days now
- 4 days/yr
- Unhealthy air days in 30 yrs
- 5 days/yr
Risk factors via First Street. Map © Google.
Why this score? — see what drove the A- grade
The composite is a weighted blend of 9 inputs, each scored 0–100. Each bar is that input's sub-score; the figure is the points it added to the 100-point composite (weight × sub-score).
- Cash flow +30.0/30.0
- ARV discount +15.0/15.0
- 1% rule +10.0/10.0
- DSCR +10.0/10.0
- Appreciation +6.9/10.0
- Schools +3.8/10.0
- Livability +2.7/5.0
- Rent growth +2.5/5.0
- Condition / age +2.5/5.0
$219,000
🖨 Deal sheet 📄 Offer letter ✓ Due diligence
Listing remarks MLS
Location! Location! Location! Investor's Special in the best location in Mountain Cove. .. This lower-level studio is ideally situated in one of the most desirable spots within Mountain Cove--nestled against the mountain and greenbelt, offering rare privacy with serene views of natural landscape instead of neighboring condos. Bring your contractor, this unit is in original condition and ready for a full remodel, presenting an excellent opportunity for investors or buyers looking to customize their own desert retreat. With strong potential, this property could become a high-performing short-term rental or a stylish weekend getaway. Mountain Cove is one of the few communities in the area that still allows short-term rentals (7-day minimum), making it especially appealing for income potential. As an Indian Wells homeowner, you'll also enjoy exclusive resident perks, including complimentary tickets to Residents Day at the BNP Paribas Open, discounted golf at the Indian Wells Golf Resort, and savings at local hotels, spas, and restaurants--plus reduced electric costs through Imperial Irrigation District. Don't miss this chance to own a slice of paradise!
Key facts
- Rare privacy
- Serene views
- Full remodel
Tags
Neighborhood map
What this means for you Summary
Snapshot
- This is a 1-bed/1.0-bath condo listed at $219k.
Deal economics
- At list price, monthly cash flow is $1k ($17k/yr) — positive.
- The deal already cash-flows at list — no discount required.
- Meets the 1% rule at list price ($4k rent vs $219k).
- Recommended offer: $206k (6.0% below list) — sets the bar for market timing.
- Cap rate 14.2% vs local median 1.5% in Indian Wells — top-decile yield for the area; either an underpriced asset or a hidden risk that comps aren't pricing in. Stress-test before assuming the spread holds.
Location & tenants
- Location reads 53/100 on livability (#968 in CA) — a working-class tenant base; expect higher turnover. Strengths: employment A+, schools B+, crime B+; Watch: amenities F, commute F, cost of living F.
- Desert Sands Unified (suburban): math 31% / reading 56% proficiency, ranked #199 of 517 in CA (top 38%) — families likely to look elsewhere, expect single-tenant / working-renter base with shorter leases.
- Market conditions: 147 active listings in the ZIP; 4 comparable units currently listed for rent nearby; rentals lingering (median 44d on market — plan ~5-8 weeks vacancy on turnover, expect pricing pressure); 100% of comp listings sitting > 30 days — soft ceiling on asking rent; high-income renter base; 9,195 units permitted in Riverside County in 2024 (1,512 in 5+ unit buildings).
Forward outlook
- In year one you build about $10k of equity ($2k loan paydown + $8k appreciation (3.8% local appreciation)).
- Riverside County population projected at +22% by 2050 — long-run rental-demand tailwind backs the buy-and-hold thesis.
- At projected returns (3.8% appreciation + 3.0% rent growth), your $61k cash investment doubles in ~3 years — after that, you're playing with house money.
- By year 4, paydown + projected appreciation supports a ~$33k cash-out refi (75% LTV) — recoverable capital for the next deal without selling this one.
Negotiation context
- It's been on market 65 days — a 6% lower offer ($206k) is reasonable based on typical stale-listing flexibility.
Risks & watch-outs
- Climate carrying-cost: moderate wildfire risk; extreme-heat days projected 6→15/yr by 2055 (HVAC capex compounding) — expect insurance premiums to compound above CPI over the hold.
Questions for the listing agent
- It's been on market 65 days. Have you received any prior offers? Is the seller open to a 6% concession, seller financing, or rate buy-down credit?
- Built in 1972 — when were the roof, HVAC, electrical panel, plumbing, and water heater last replaced?
- What does the HOA fee cover, when was the last increase, and are there any pending special assessments or reserve-fund shortfalls?
- Any open or pending special assessments — roof, HVAC, plumbing, elevator, façade? What's the per-unit balance and payoff schedule, and is the seller paying it off at close or rolling it to the buyer?
- Why hasn't it sold? Are there any deal-killer items the seller is aware of (foundation, flood, title, zoning, code violations)?
- Is there a deadline driving the sale (1031 exchange, divorce, estate, relocation)? That informs how much negotiation room exists.
- Schools are B-rated — typically a magnet for longer-tenancy family renters. What's the average tenant stay here, and is there a school-zone premium baked into asking?
- What's the average days-on-market for RENTAL listings here right now (not sales)? A rising rental-DOM trend means longer vacancies and softer asking-rent achievability than the comps imply.
- What's the recent tenant-quality profile in this submarket — average credit score on applications, eviction rate, late-payment / NSF rate, and stable-employment percentage? A property-management company in the area should have these aggregated.
- How much new apartment / multifamily construction is in the pipeline within 1–3 miles? Heavy new supply (>2% of stock underway) typically softens rents 12–24 months out; light construction supports rent growth.
Investment metrics
- 1% rule
- 1.78% ✓
- Cap rate
- 14.23%
- Cash-on-cash
- 28.36%
- DSCR
- 2.26
- GRM
- 4.7
CMA / ARV
- ARV (median comp)
- $292,875
- List price
- $219,000
- Delta
- -25.22%
- Verdict
- UNDERPRICED
- Comps
- 20 within 1.0 mi
Projected returns pro-forma
3.76% appreciation · 3.0% rent growth · sell at horizon
- IRR
- 35.6%
- Equity multiple
- 3.08×
- Total profit
- $127,722
- Equity at exit
- $107,961
- IRR
- 35.0%
- Equity multiple
- 6.13×
- Total profit
- $314,867
- Equity at exit
- $174,169
Cash invested: $61,320 (down + closing). Projections, not guarantees.
Landlord ↔ Tenant lean methodology
- Overall (STATE)
- 18 Strongly Tenant-Friendly
- State California
- 18 Strongly Tenant-Friendly · D+13
- County
- — inherits STATE
- City
- — inherits STATE
ZIP-level market 92210
- Home prices YoY
- 1.3%
- Active inventory
- 147
- Price-to-rent
- 4.7×
Monthly cashflow live
- Estimated rent
- $3,900 medium interval (Pro) →
- Mortgage (P&I)
- −$1,148
- Tax from tax record
- −$127 /mo · $1,526/yr
- Insurance
- −$91
- HOA
- −$265
- Vacancy / Maint / Mgmt
- −$819
- Net cashflow
- $1,449
Break-even live
UW: 25.0% down · 7.5% · 30yr · 1.5% tax · 5.0% vac · 8.0% maint · 8.0% mgmt
Financing live
Cash to close
- Down payment
- $54,750
- Closing costs
- $6,570
- Reserves months
- —
- Total cash needed
- —
Loan-product check · same deal, 3 products live
Conventional
25% down · 7.5% · 30yr
- Down + closing
- —
- Monthly P&I
- —
- Monthly cashflow
- —
- DSCR
- —
- Eligible?
- —
Personal DTI + credit; lowest rate.
DSCR
20% down · 8.5% · 30yr
- Down + closing
- —
- Monthly P&I
- —
- Monthly cashflow
- —
- DSCR
- —
- Eligible?
- —
No personal income docs; deal must DSCR.
Hard money
10% down · 12.0% · 12mo
- Down + closing
- —
- Monthly P&I
- —
- Monthly cashflow
- —
- DSCR
- —
- Eligible?
- —
Short-term bridge; refi at stabilization.
Rent comps 4 comps
| Address | Beds | Baths | Sqft | Rent | $/sqft | DOM | Units | Dist |
|---|---|---|---|---|---|---|---|---|
| 78200 Cortez Ln #149 Indian Wells, CA | 1.0 | 1.0 | 576 | $2,200 | $3.82 | 43d | 1 | 0.06mi |
| 78130 Cortez Ln Indian Wells, CA | 1.0–2.0 | 1.0–2.0 | 874 | $2,600 | $2.97 | 43d | 2 | 0.06mi |
| 78155 Cabrillo Ln #37 Indian Wells, CA | 1.0 | 1.0 | 576 | $3,500 | $6.08 | 43d | 1 | 0.07mi |
| 78490 Via Palomino Unit 101 La Quinta, CA | 1.0 | 1.0 | 560 | $1,800 | $3.21 | 43d | 1 | 1.24mi |
HOA detail condo
- Monthly dues
- $265 · $3,180/yr
- Likely covers
- electric
- Assessments
- None detected in remarks — confirm with the listing agent.
Listing history 9 events
-
2026-06-08status $219,000 Pending 65 DOM
-
2026-06-07days on market $219,000 Active Under Contract 65 DOM
-
2026-06-04days on market $219,000 Active Under Contract 62 DOM
-
2026-06-03days on market $219,000 Active Under Contract 61 DOM
-
2026-06-02statusdays on market $219,000 Active Under Contract 60 DOM
-
2026-06-01days on market $219,000 Active 59 DOM
-
2026-05-31days on market $219,000 Active 58 DOM
-
2026-04-03$245,000 Active 1167-char remark
Show marketing remark (1167 chars)
Location! Location! Location! Investor's Special in the best location in Mountain Cove. .. This lower-level studio is ideally situated in one of the most desirable spots within Mountain Cove--nestled against the mountain and greenbelt, offering rare privacy with serene views of natural landscape instead of neighboring condos. Bring your contractor, this unit is in original condition and ready for a full remodel, presenting an excellent opportunity for investors or buyers looking to customize their own desert retreat. With strong potential, this property could become a high-performing short-term rental or a stylish weekend getaway. Mountain Cove is one of the few communities in the area that still allows short-term rentals (7-day minimum), making it especially appealing for income potential. As an Indian Wells homeowner, you'll also enjoy exclusive resident perks, including complimentary tickets to Residents Day at the BNP Paribas Open, discounted golf at the Indian Wells Golf Resort, and savings at local hotels, spas, and restaurants--plus reduced electric costs through Imperial Irrigation District. Don't miss this chance to own a slice of paradise!
-
1999-09-20soldstatus $1,914,000
ⓘ Source: listings_history table (triggers on properties + properties_extension) + one-shot
backfill from property_details.listing_events for pre-trigger history.
Tax reassessment forecast CA · Resets to sale price
- Current annual tax
- $1,526 · $127/mo
- Projected year-2 tax
- $1,664 · $139/mo
- Expected delta
- +$139/yr (+$12/mo · 9.1%)
ⓘ Screening estimate from a state-policy table — verify with the county assessor before closing.
Climate risk First Street
- Flood 1/10 Low FEMA zone X (shaded) · 0% chance over 30 yrs
- Wildfire 5/10 Major
- Heat 9/10 Extreme 6 d/yr ≥114°F today · 15 d/yr by 30 yrs out
- Wind 1/10 Low
- Air quality 4/10 Moderate 4 unhealthy d/yr today · 5 by 30 yrs out
Nearby sold comps map
Loading sold comps map…
Walkable amenities ~0.75 mi
Loading nearby amenities…
Taxation est. · year 1
- Rental income
- $46,798
- − Mortgage interest
- −$12,267
- − Property taxes
- −$1,526
- − Insurance
- −$1,095
- − Repairs & maintenance
- −$3,744
- − Management
- −$3,744
- − HOA
- −$3,180
- − Depreciation
- −$6,371
- Taxable income
- $14,871
- Est. tax owed @ 24.0%
- −$3,569
- After-tax cash flow
- $13,819/yr
For passive investors: Depreciation is non-cash, so a rental often shows a tax loss while cash-flowing — sheltering income. Rental losses are passive: they offset passive income freely, and up to $25,000/yr can offset ordinary (W-2) income if you actively participate and your MAGI is under $100k (phasing out to $0 by $150k); unused losses carry forward. On sale, claimed depreciation is recaptured at up to 25%, and gains may owe capital-gains tax (a 1031 exchange can defer both). Figures are a year-1 estimate at your 24.0% rate — not tax advice; consult a CPA.
Schools (NCES district)
- District
- Desert Sands Unified
- NCES district ID
- 0611110
- Math proficiency
- 31% ▼ -4.00%
- Reading proficiency
- 56% ▲ 7.00%
- Median HH income
- $54,957
- Composite
- 37.77/100
- National rank
- #4346
- State rank
- #199 of 517 in CA
Livability — Indian Wells
- Score
- 53/100
- State rank
- #968
- US rank
- #24559
Category grades
Schools grade is shown separately in the Schools card above.
Census & demographics
- Census place
- Indian Wells, CA
- County
- Riverside County · 2,287,001 people
- City population
- 4,871
- Metro
- Riverside-San Bernardino-Ontario, CA
- Population (ZIP)
- 4,871
- Household income
- $162,990
- Rent vs Own
- Severe rent burden
- 56.0
Population outlook (Riverside County) Hauer SSP2
- Today (2025)
- 2,664,475 people
- By 2030
- 2,802,692 · +5.2%
- By 2040
- 3,050,904 · +14.5%
- By 2050
- 3,256,783 · +22.2%
- By 2075
- 3,655,058 · +37.2%
- By 2100
- 3,766,594 · +41.4%
Race, ethnicity, and origin ACS 2023
- Neighborhood character
- Predominantly White (86%)
- Race & ethnicity
- White 86% Hispanic / Latino 5% Two or more races 5% Asian 3% Black 3%
- Common ancestry
- Slovak 5% Lithuanian 4% Romanian 3%
- Foreign-born
- 10% · Canada, China
- Languages at home
- 92% English-only · Spanish 3% Russian/Polish/Slavic 1% Tagalog/Filipino 1%
Political lean MEDSL · Riverside
- 2024 margin
- Toss-up / Even · D 48.0% · R 49.3% · Other 2.6%
- 2008→2024 swing
- -3.6pp toward R · 2008: 2.3pp · 2024: -1.3pp
- All cycles
- 2024: R+1.3 2020: D+8.0 2016: D+4.3 2012: R+0.4 2008: D+2.3
Not yet ingested
- Civics
- —
Market trends
- HPI YoY
- ▲ 3.76%
- Current HPI
- 299.2632
- Rent YoY
- —
- Metro
- Riverside-San Bernardino-Ontario, CA
- State GDP YoY
- ▲ 3.21%
- F500 in state
- 116
Industry mix (Fortune 500 HQ in CA)
| Industry | F500 HQs | Revenue |
|---|---|---|
| Technology | 27 | $1,492B |
|
||
| Financial Services | 3 | $174B |
|
||
| Retail | 3 | $44B |
|
||
| Insurance | 3 | $26B |
|
||
| Media / Entertainment | 2 | $115B |
|
||
| Pharmaceuticals / Biotech | 2 | $62B |
|
||
Price history
-87.2% since first listed2 events — show timeline
- 2026-04-03 Listed $245,000 GPSMLS
- 1999-09-20 Sold (Public Records) $1,914,000 Public Records
Property tax history
+1.9%/yrLatest (2025): $1,526 · +3.5% YoY. Source: county tax records.
Cash-flow waterfall
monthlySold comps — $/sqft
last 12 mo · ≤1 miLoading sold comps…