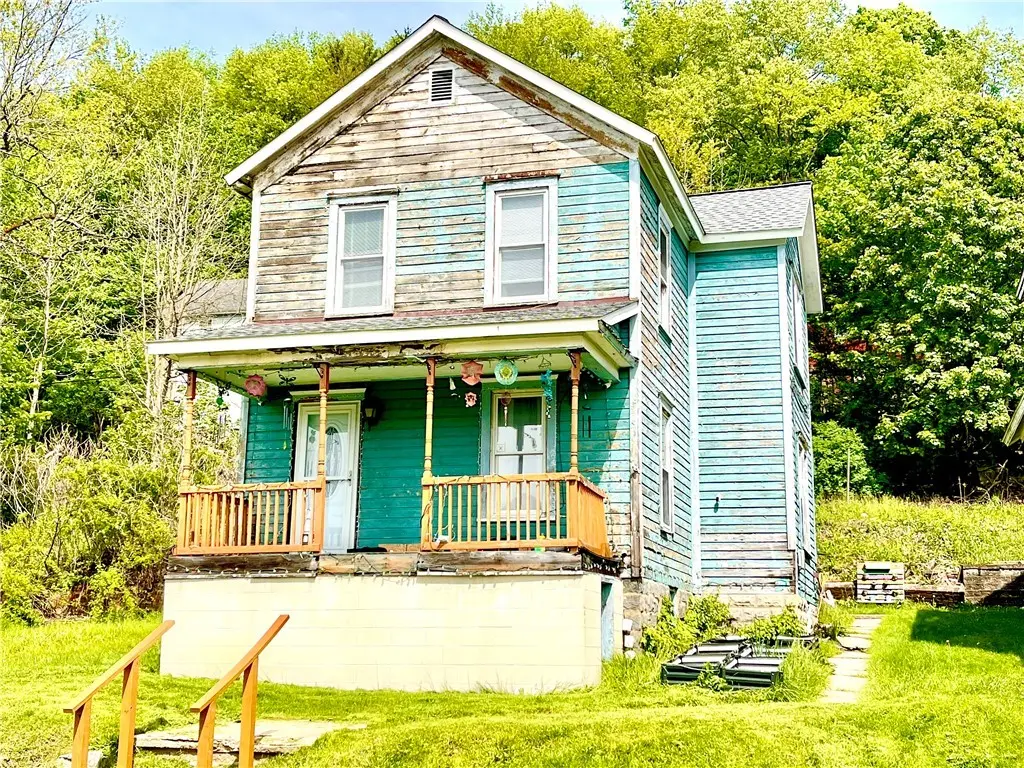
309 1st · Johnsonburg, PA
Flood risk 1/10 · Minimal
- FEMA flood zone
- X (unshaded)
- Chance of flooding over 30 yrs
- 0.0%
- Est. flood insurance / yr
- $507 – $1,088
Fire risk 1/10 · Minimal
- Est. fire insurance / yr
- $511 – $949
Heat risk 2/10 · Minimal
- Hot days now (above 89°F)
- 7 days/yr
- Hot days in 30 yrs
- 18 days/yr
Wind risk 2/10 · Minimal
- Chance of severe wind over 30 yrs
- —
Air-quality risk 2/10 · Minimal
- Unhealthy air days now
- 0 days/yr
- Unhealthy air days in 30 yrs
- 1 days/yr
Risk factors via First Street. Map © Google.
Why this score? — see what drove the B+ grade
The composite is a weighted blend of 9 inputs, each scored 0–100. Each bar is that input's sub-score; the figure is the points it added to the 100-point composite (weight × sub-score).
- Cash flow +30.0/30.0
- 1% rule +10.0/10.0
- DSCR +10.0/10.0
- Appreciation +9.9/10.0
- ARV discount +7.5/15.0
- Schools +4.2/10.0
- Livability +3.5/5.0
- Rent growth +2.5/5.0
- Condition / age +1.0/5.0
$31,500
🖨 Deal sheet 📄 Offer letter ✓ Due diligence
Key facts
- 4,356 sq ft lot
- 2 parking spots
- Listed 33 days
Property features AI
Exterior
- Parking: On-street parking; 2 parking spaces (total)
- Utilities: Public water; Public sewer
- Home design: 2-story frame house; Asphalt roof; Resale property
- Construction: Frame construction; Asphalt roof
- Exterior features: 38 x 120 x 36 x 119 lot dimensions
Interior
- Kitchen: Stove; Some electric appliances
- Flooring: Hardwood; Vinyl
- Bathrooms: 1 full bathroom; 1 half bathroom
- Interior features: Hardwood and vinyl flooring; Walk-up basement access
Neighborhood map
What this means for you Summary
Snapshot
- This is a 3-bed/1.5-bath single-family listed at $32k. Condition is rated poor.
Deal economics
- At list price, monthly cash flow is $702 ($8k/yr) — positive.
- The deal already cash-flows at list — no discount required.
- Meets the 1% rule at list price ($1k rent vs $32k).
- Recommended offer: $31k (3.0% below list) — sets the bar for market timing.
Location & tenants
- Location reads 69/100 on livability (#825 in PA) — a middle-class / working-renter tenant base. Strengths: crime A+, cost of living A+, housing A+; Watch: schools C-, amenities F, commute F.
- Johnsonburg Area SD (rural): math 40% / reading 60% proficiency, ranked #192 of 539 in PA (top 36%) — acceptable for families but not a draw, mixed tenant base, ~2y average lease.
- Market conditions: 4 active listings in the ZIP; 53 units permitted in Elk County in 2024 (0 in 5+ unit buildings).
Forward outlook
- In year one you build about $3k of equity ($218 loan paydown + $3k appreciation (9.8% local appreciation)).
- Elk County population projected at -27% by 2050 — secular population decline; favor cash flow + early exit over multi-decade hold.
- At projected returns (9.8% appreciation + 3.0% rent growth), your $9k cash investment doubles in ~1 year — after that, you're playing with house money.
- By year 9, paydown + projected appreciation supports a ~$34k cash-out refi (75% LTV) — recoverable capital for the next deal without selling this one.
Negotiation context
- It's been on market 34 days — a 3% lower offer ($31k) is reasonable based on typical stale-listing flexibility.
Risks & watch-outs
- Watch-outs: property tax is 4.2% of price.
Questions for the listing agent
- It's been on market 34 days. Have you received any prior offers? Is the seller open to a 3% concession, seller financing, or rate buy-down credit?
- Have any recent inspections been done? Can we get a copy of the seller's disclosures and any deferred-maintenance estimates?
- Property tax is high relative to price — has the assessment been appealed recently, and will the sale trigger a re-assessment?
- Is there a deadline driving the sale (1031 exchange, divorce, estate, relocation)? That informs how much negotiation room exists.
- What's the average days-on-market for RENTAL listings here right now (not sales)? A rising rental-DOM trend means longer vacancies and softer asking-rent achievability than the comps imply.
- What's the recent tenant-quality profile in this submarket — average credit score on applications, eviction rate, late-payment / NSF rate, and stable-employment percentage? A property-management company in the area should have these aggregated.
- How much new for-sale + rental construction is in the pipeline within 1–3 miles? Heavy new supply typically softens prices + rents 12–24 months out; constrained supply supports both.
Investment metrics
- 1% rule
- 3.98% ✓
- Cap rate
- 33.05%
- Cash-on-cash
- 95.56%
- DSCR
- 5.25
- GRM
- 2.1
CMA / ARV
No comps found within radius.
Projected returns pro-forma
9.82% appreciation · 3.0% rent growth · sell at horizon
- IRR
- —
- Equity multiple
- 7.98×
- Total profit
- $61,553
- Equity at exit
- $27,953
- IRR
- 99.8%
- Equity multiple
- 17.57×
- Total profit
- $146,105
- Equity at exit
- $59,835
Cash invested: $8,820 (down + closing). Projections, not guarantees.
Landlord ↔ Tenant lean methodology
- Overall (STATE)
- 62 Landlord-Friendly
- State Pennsylvania
- 62 Landlord-Friendly · EVEN
- County
- — inherits STATE
- City
- — inherits STATE
ZIP-level market 15845
- Home prices YoY
- 5.8%
- Active inventory
- 4
- Price-to-rent
- 2.1×
Monthly cashflow live
- Estimated rent
- $1,255 medium interval (Pro) →
- Mortgage (P&I)
- −$165
- Tax from tax record
- −$111 /mo · $1,331/yr
- Insurance
- −$13
- HOA
- −$0
- Vacancy / Maint / Mgmt
- −$264
- Net cashflow
- $702
Break-even live
UW: 25.0% down · 7.5% · 30yr · 1.5% tax · 5.0% vac · 8.0% maint · 8.0% mgmt
Financing live
Cash to close
- Down payment
- $7,875
- Closing costs
- $945
- Reserves months
- —
- Total cash needed
- —
Loan-product check · same deal, 3 products live
Conventional
25% down · 7.5% · 30yr
- Down + closing
- —
- Monthly P&I
- —
- Monthly cashflow
- —
- DSCR
- —
- Eligible?
- —
Personal DTI + credit; lowest rate.
DSCR
20% down · 8.5% · 30yr
- Down + closing
- —
- Monthly P&I
- —
- Monthly cashflow
- —
- DSCR
- —
- Eligible?
- —
No personal income docs; deal must DSCR.
Hard money
10% down · 12.0% · 12mo
- Down + closing
- —
- Monthly P&I
- —
- Monthly cashflow
- —
- DSCR
- —
- Eligible?
- —
Short-term bridge; refi at stabilization.
Listing history 15 events
-
2026-06-18days on market $31,500 Active 34 DOM
-
2026-06-17days on market $31,500 Active 33 DOM
-
2026-06-16days on market $31,500 Active 32 DOM
-
2026-06-15days on market $31,500 Active 31 DOM
-
2026-06-13days on market $31,500 Active 29 DOM
-
2026-06-12days on market $31,500 Active 28 DOM
-
2026-06-09days on market $31,500 Active 25 DOM
-
2026-06-08days on market $31,500 Active 24 DOM
-
2026-06-08days on market $31,500 Active 23 DOM
-
2026-06-05days on market $31,500 Active 21 DOM
-
2026-06-04days on market $31,500 Active 19 DOM
-
2026-06-02days on market $31,500 Active 18 DOM
-
2026-06-01days on market $31,500 Active 17 DOM
-
2026-05-31days on market $31,500 Active 16 DOM
-
2026-05-15$31,500 Active 343-char remark
ⓘ Source: listings_history table (triggers on properties + properties_extension) + one-shot
backfill from property_details.listing_events for pre-trigger history.
Tax reassessment forecast PA · Partial reset (capped growth)
- Current annual tax
- $1,331 · $111/mo
- Projected year-2 tax
- $1,331 · $111/mo
- Expected delta
- $0/yr ($0/mo · 0.0%)
ⓘ Screening estimate from a state-policy table — verify with the county assessor before closing.
Climate risk First Street
- Flood 1/10 Low FEMA zone X (unshaded) · 0% chance over 30 yrs
- Wildfire 1/10 Low
- Heat 2/10 Low 7 d/yr ≥89°F today · 18 d/yr by 30 yrs out
- Wind 2/10 Low
- Air quality 2/10 Low 0 unhealthy d/yr today · 1 by 30 yrs out
Nearby sold comps map
Loading sold comps map…
Walkable amenities ~0.75 mi
Loading nearby amenities…
Taxation est. · year 1
- Rental income
- $15,062
- − Mortgage interest
- −$1,764
- − Property taxes
- −$1,331
- − Insurance
- −$158
- − Repairs & maintenance
- −$1,205
- − Management
- −$1,205
- − Depreciation
- −$916
- Taxable income
- $8,483
- Est. tax owed @ 24.0%
- −$2,036
- After-tax cash flow
- $6,392/yr
For passive investors: Depreciation is non-cash, so a rental often shows a tax loss while cash-flowing — sheltering income. Rental losses are passive: they offset passive income freely, and up to $25,000/yr can offset ordinary (W-2) income if you actively participate and your MAGI is under $100k (phasing out to $0 by $150k); unused losses carry forward. On sale, claimed depreciation is recaptured at up to 25%, and gains may owe capital-gains tax (a 1031 exchange can defer both). Figures are a year-1 estimate at your 24.0% rate — not tax advice; consult a CPA.
Condition & rehab AI · 12 photos
This property requires extensive renovations to bring it up to modern standards and improve its value.
Repairs flagged
- Major kitchen appliances — need replacement for functionality
- Major bathroom fixtures — need replacement for functionality
- Major roof — visible wear and tear
- Major exterior siding — weathered and peeling
- Major flooring — worn and uneven
- Major interior walls/paint — dated and peeling
- Major windows — old and possibly drafty
- Major HVAC/mechanicals — old and possibly inefficient
Value-add opportunities
- Resale new kitchen appliances — modernizes the space and improves functionality
- Resale new bathroom fixtures — modernizes the space and improves functionality
- Resale new roof — improves the home's appearance and functionality
- Resale new exterior siding — improves the home's appearance and functionality
- Resale new flooring — improves the home's appearance and functionality
- Resale new interior walls/paint — improves the home's appearance and functionality
- Resale new windows — improves the home's appearance and functionality
- Resale new HVAC/mechanicals — improves the home's functionality and energy efficiency
- Both landscaping — improves the home's curb appeal and functionality
Renovation cost estimate screening
| Repair item | Severity | Est. cost |
|---|---|---|
| kitchen appliances · need replacement for functionality | Major | $15,000–50,000 |
| bathroom fixtures · need replacement for functionality | Major | $15,000–50,000 |
| roof · visible wear and tear | Major | $15,000–50,000 |
| exterior siding · weathered and peeling | Major | $15,000–50,000 |
| flooring · worn and uneven | Major | $15,000–50,000 |
| interior walls/paint · dated and peeling | Major | $15,000–50,000 |
| windows · old and possibly drafty | Major | $15,000–50,000 |
| HVAC/mechanicals · old and possibly inefficient | Major | $15,000–50,000 |
| Total estimated repair cost · 8 items | $120,000–400,000 |
Value-add ROI direction
- Resale new kitchen appliances — modernizes the space and improves functionality ↑
- Resale new bathroom fixtures — modernizes the space and improves functionality ↑
- Resale new roof — improves the home's appearance and functionality ↑
- Resale new exterior siding — improves the home's appearance and functionality ↑
- Resale new flooring — improves the home's appearance and functionality ↑
- Resale new interior walls/paint — improves the home's appearance and functionality ↑
- Resale new windows — improves the home's appearance and functionality ↑
- Resale new HVAC/mechanicals — improves the home's functionality and energy efficiency ↑
- Both landscaping — improves the home's curb appeal and functionality ↑
ⓘ Cost ranges are severity-bucket heuristics (US national rule-of-thumb). Get contractor quotes + a written scope before underwriting a rehab budget.
Schools (NCES district)
- District
- Johnsonburg Area SD
- NCES district ID
- 4212570
- Math proficiency
- 40% ▼ -6.00%
- Reading proficiency
- 60% ▼ -10.00%
- Median HH income
- $42,329
- Composite
- 41.97/100
- National rank
- #3343
- State rank
- #192 of 539 in PA
Livability — Johnsonburg
- Score
- 69/100
- State rank
- #825
- US rank
- #8590
Category grades
Schools grade is shown separately in the Schools card above.
Census & demographics
- Census place
- Johnsonburg, PA
- Population (ZIP)
- 3,109
Population outlook (Elk County) Hauer SSP2
- Today (2025)
- 28,567 people
- By 2030
- 27,172 · -4.9%
- By 2040
- 24,111 · -15.6%
- By 2050
- 20,967 · -26.6%
- By 2075
- 15,355 · -46.2%
- By 2100
- 10,418 · -63.5%
Race, ethnicity, and origin ACS 2023
- Neighborhood character
- Predominantly White (94%)
- Race & ethnicity
- White 94% Two or more races 6% Hispanic / Latino 1%
- Common ancestry
- Romanian 10% Slovak 4% Serbian 3%
- Foreign-born
- 1% · Canada
Political lean MEDSL · Elk
- 2024 margin
- Solid R (+47.0) · D 26.1% · R 73.1%
- 2008→2024 swing
- -51.3pp toward R · 2008: 4.3pp · 2024: -47.0pp
- All cycles
- 2024: R+47.0 2020: R+45.1 2016: R+43.8 2012: R+15.7 2008: D+4.3
Not yet ingested
- Civics
- —
Market trends
- HPI YoY
- ▲ 9.82%
- Current HPI
- 177.5221
- Rent YoY
- —
- Metro
- —
- State GDP YoY
- ▲ 1.68%
- F500 in state
- 34
Industry mix (Fortune 500 HQ in PA)
| Industry | F500 HQs | Revenue |
|---|---|---|
| Healthcare | 2 | $309B |
|
||
| Insurance | 2 | $27B |
|
||
| Telecommunications / Media | 1 | $124B |
|
||
| Industrial Distribution | 1 | $22B |
|
||
| Financial Services | 1 | $20B |
|
||
| Chemicals / Materials | 1 | $18B |
|
||
Price history
1 event — show timeline
- 2026-05-15 Listed $31,500 West Penn MLS
Property tax history
+3.2%/yrLatest (2026): $1,331 · +4.4% YoY. Source: county tax records.
Cash-flow waterfall
monthlySold comps — $/sqft
last 12 mo · ≤1 miLoading sold comps…