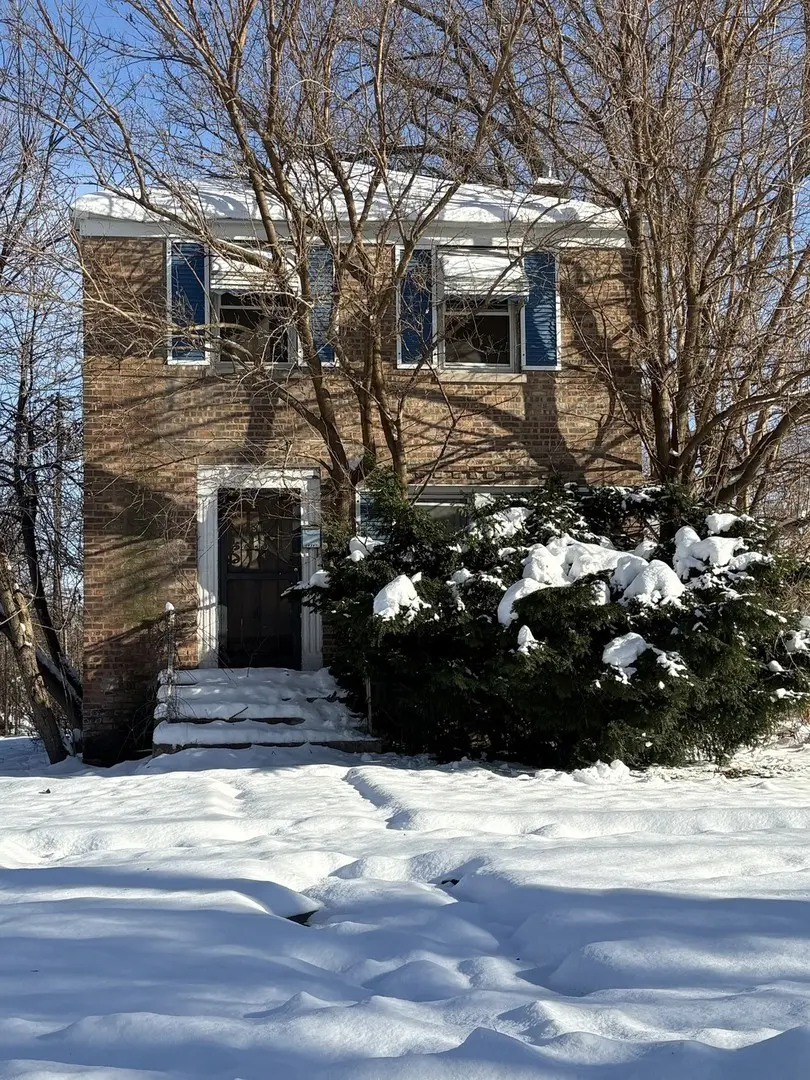
14919 Cooper Ave · Harvey, IL
Flood risk 1/10 · Minimal
- FEMA flood zone
- AH
- Chance of flooding over 30 yrs
- 0.0%
- Est. flood insurance / yr
- $810 – $3,808
Fire risk 1/10 · Minimal
- Est. fire insurance / yr
- $804 – $1,492
Heat risk 3/10 · Minor
- Hot days now (above 102°F)
- 7 days/yr
- Hot days in 30 yrs
- 15 days/yr
Wind risk 2/10 · Minimal
- Chance of severe wind over 30 yrs
- —
Air-quality risk 3/10 · Minor
- Unhealthy air days now
- 4 days/yr
- Unhealthy air days in 30 yrs
- 4 days/yr
Risk factors via First Street. Map © Google.
Why this score? — see what drove the B+ grade
The composite is a weighted blend of 9 inputs, each scored 0–100. Each bar is that input's sub-score; the figure is the points it added to the 100-point composite (weight × sub-score).
- Cash flow +30.0/30.0
- 1% rule +10.0/10.0
- DSCR +10.0/10.0
- Appreciation +10.0/10.0
- ARV discount +7.5/15.0
- Livability +3.4/5.0
- Rent growth +2.5/5.0
- Condition / age +2.5/5.0
- Schools +0.7/10.0
$49,890
🖨 Deal sheet (PDF) 📄 Offer letter ✓ Due diligence
Listing remarks
BACK ON MARKET! The previous contract fell through due to a title issue that has now been cleared, and this deal is ready to close. Fix-and-flip investors, take notice! This is a prime value-add opportunity with substantial upside. Being sold AS-IS, the property is ready for a full renovation and offers the chance to create significant equity through improvements. The home sits on a rare package of 6 total lots, including two PINs attached to the house, providing added land value and future flexibility beyond the renovation itself. With an estimated ARV of $200,000+ on the house alone, investors have a clear path to value creation while also benefiting from the additional upside potential o
Key facts
- Rare package of lots
- Added land value
- Extra lots
Tags
Property features AI
Finance
- Other: Living area source: Appraiser; Not rebuilt or rehabilitated; Parcel numbers on file
- HOA & community: No master association fee required
Exterior
- Parking: Detached owned garage (1 garage space, 1 total parking space)
- Utilities: Public water; Public sewer
- Home design: Detached single-family home; Two-story layout; Fee simple ownership; Built before 1978
- Construction: Frame construction; Asphalt roof; Estimated age: 81–90 years
- Exterior features: Lot dimensions approximately 127 x 26 x 127 x 25; Lot smaller than 0.25 acre
Interior
- Kitchen: Kitchen on main level (9 x 11)
- Bedrooms: Master bedroom on main level (15 x 12) with full bath; Bedroom on main level (10 x 12); Bedroom on main level (10 x 10)
- Bathrooms: 1 full bathroom; 1 half bathroom
- Heating & cooling: Natural gas heating; Central air conditioning
- Interior features: First-floor bedroom; Unfinished full basement; 6 total rooms
- Laundry & utility: Main-level laundry room
Neighborhood map
What this means for you Summary
Snapshot
- This is a 3-bed/1.5-bath single-family listed at $50k.
Deal economics
- At list price, monthly cash flow is $726 ($9k/yr) — positive.
- The deal already cash-flows at list — no discount required.
- Meets the 1% rule at list price ($2k rent vs $50k).
- Cap rate 28.4% vs local median 9.3% in Harvey — top-decile yield for the area; either an underpriced asset or a hidden risk that comps aren't pricing in. Stress-test before assuming the spread holds.
Location & tenants
- Location reads 67/100 on livability (#539 in IL) — a middle-class / working-renter tenant base. Strengths: commute A+, cost of living A+, housing A-; Watch: health & safety D+, crime F, amenities F.
- Thornton Twp Hsd 205 (suburban): math 7% / reading 8% proficiency, ranked #594 of 620 in IL (top 96%) — low school quality limits family demand, transient renter base, plan for 1-2y turnover.
- Zoned schools: Thornton Township High School (math 7% / reading 7%, grade F, #605 of 693 statewide, top 87%, 1,628 students, 0% FRL).
- Market conditions: 133 active listings in the ZIP; 3 comparable units currently listed for rent nearby; rentals at typical pace (median 26d on market — plan ~3-4 weeks tenant-placement turnaround); 6,272 units permitted in Cook County in 2024 (4,658 in 5+ unit buildings).
Forward outlook
- In year one you build about $5k of equity ($344 loan paydown + $5k appreciation (10.0% local appreciation)).
- At projected returns (10.0% appreciation + 3.0% rent growth), your $14k cash investment doubles in ~1 year — after that, you're playing with house money.
- By year 6, paydown + projected appreciation supports a ~$31k cash-out refi (75% LTV) — recoverable capital for the next deal without selling this one.
Negotiation context
- Only 5 days on market — expect competitive offers; lowballing is unlikely to land.
- 4 sale attempts since 2y ago with the ask held roughly flat each time — persistent listings suggest the price (not the market) is what's stuck; bring a comps-based counter.
Risks & watch-outs
- Watch-outs: flood insurance adds $192/mo; built in 1945 — expect roof / HVAC / electrical / plumbing capex.
- Climate carrying-cost: in FEMA flood zone AH (mandatory federal flood insurance) — expect insurance premiums to compound above CPI over the hold.
Questions for the listing agent
- Built in 1945 — when were the roof, HVAC, electrical panel, plumbing, and water heater last replaced?
- What's the actual annual flood-insurance premium (NFIP or private), and is the property in a SFHA with mandatory coverage?
- Is there a deadline driving the sale (1031 exchange, divorce, estate, relocation)? That informs how much negotiation room exists.
- Schools are F-rated, which usually means shorter tenancies and higher turnover. Who's the typical renter profile here, and what's been the actual vacancy rate?
- Crime grade is F in this area — have there been break-ins, vandalism, or insurance claims at this property in the last 3 years? What carrier currently insures it and at what premium?
- What's the average days-on-market for RENTAL listings here right now (not sales)? A rising rental-DOM trend means longer vacancies and softer asking-rent achievability than the comps imply.
- What's the recent tenant-quality profile in this submarket — average credit score on applications, eviction rate, late-payment / NSF rate, and stable-employment percentage? A property-management company in the area should have these aggregated.
- How much new for-sale + rental construction is in the pipeline within 1–3 miles? Heavy new supply typically softens prices + rents 12–24 months out; constrained supply supports both.
Investment metrics
- 1% rule
- 3.25% ✓
- Cap rate
- 28.39%
- Cash-on-cash
- 78.92%
- DSCR
- 4.51
- GRM
- 2.6
CMA / ARV
- ARV (on-the-fly)
- $101,904
- Comps found
- 12
Show comp detail 12 sales within ~0.75 mi
| Address | Dist | Beds/Ba | Sqft | Sold | Price | $/sf | Match |
|---|---|---|---|---|---|---|---|
| 14913 Leavitt Ave | 0.06mi | 4/2.0 (+1) | 1,200 (+4%) | 6mo | $168,000 | $140 | 79 |
| 14839 Cooper Ave | 0.08mi | 3/1.0 | 992 (-14%) | 6mo | $42,000 | $42 | 65 |
| 14902 Paulina St | 0.53mi | 2/1.0 (-1) | 1,200 (+4%) | 1mo | $90,000 | $75 | 62 |
| 14715 Maplewood Ave | 0.57mi | 3/1.0 | 1,210 (+4%) | 3mo | $75,000 | $62 | 61 |
| 110 W 150th St | 0.35mi | 3/1.0 | 1,008 (-13%) | 0mo | $101,250 | $100 | 60 |
| 15032 Marshfield Ave | 0.63mi | 3/1.0 | 1,081 (-7%) | 4mo | $75,000 | $69 | 55 |
| 14918 Western Ave | 0.35mi | 2/1.0 (-1) | 1,000 (-14%) | 1mo | $72,000 | $72 | 54 |
| 15131 Winchester Ave | 0.38mi | 4/1.5 (+1) | 1,300 (+12%) | 5mo | $190,000 | $146 | 53 |
| 14525 Oakley St | 0.52mi | 3/2.0 | 1,052 (-9%) | 7mo | $240,000 | $228 | 52 |
| 15036 Western Ave | 0.38mi | 2/1.0 (-1) | 1,020 (-12%) | 8mo | $90,000 | $88 | 48 |
| 14425 Vail Ave | 0.63mi | 3/1.5 | 1,286 (+11%) | 6mo | $75,000 | $58 | 47 |
| 15427 Winchester Ave | 0.69mi | 3/1.0 | 1,020 (-12%) | 6mo | $105,000 | $103 | 41 |
Match score weights: distance 35% · size 25% · config 20% · recency 20%. Top-matched comps best support the ARV.
Projected returns pro-forma
10.0% appreciation · 3.0% rent growth · sell at horizon
- IRR
- 74.4%
- Equity multiple
- 6.27×
- Total profit
- $73,582
- Equity at exit
- $44,945
- IRR
- 68.3%
- Equity multiple
- 13.93×
- Total profit
- $180,619
- Equity at exit
- $96,925
Cash invested: $13,969 (down + closing). Projections, not guarantees.
Landlord ↔ Tenant lean methodology
- Overall (STATE)
- 43 Moderately Tenant-Leaning
- State Illinois
- 43 Moderately Tenant-Leaning · D+7
- County
- — inherits STATE
- City
- — inherits STATE
ZIP-level market 60426
- Home prices YoY
- 6.9%
- Active inventory
- 133
- Price-to-rent
- 2.6×
Monthly cashflow live
- Estimated rent
- $1,623 medium interval (Pro) →
- Mortgage (P&I)
- −$262
- Tax from tax record
- −$81 /mo · $975/yr
- Insurance
- −$21
- Flood insurance flood zone
- −$192 /mo · $2,309/yr
- HOA
- −$0
- Vacancy / Maint / Mgmt
- −$341
- Net cashflow
- $726
Break-even live
Sensitivity live
| Price | -10% $755 | -5% $740 | +0% $726 | +5% $712 | +10% $698 |
|---|---|---|---|---|---|
| Rent | -10% $598 | -5% $662 | +0% $726 | +5% $790 | +10% $855 |
| Rate | -1.0pp $751 | -0.5pp $739 | base $726 | +0.5pp $713 | +1.0pp $700 |
UW: 25.0% down · 7.5% · 30yr · 1.5% tax · 5.0% vac · 8.0% maint · 8.0% mgmt
Financing live
Cash to close
- Down payment
- $12,472
- Closing costs
- $1,497
- Reserves months
- —
- Total cash needed
- —
Loan-product check · same deal, 3 products live
Conventional
25% down · 7.5% · 30yr
- Down + closing
- —
- Monthly P&I
- —
- Monthly cashflow
- —
- DSCR
- —
- Eligible?
- —
Personal DTI + credit; lowest rate.
DSCR
20% down · 8.5% · 30yr
- Down + closing
- —
- Monthly P&I
- —
- Monthly cashflow
- —
- DSCR
- —
- Eligible?
- —
No personal income docs; deal must DSCR.
Hard money
10% down · 12.0% · 12mo
- Down + closing
- —
- Monthly P&I
- —
- Monthly cashflow
- —
- DSCR
- —
- Eligible?
- —
Short-term bridge; refi at stabilization.
Rent comps 3 comps
| Address | Beds | Baths | Sqft | Rent | $/sqft | DOM | Units | Dist |
|---|---|---|---|---|---|---|---|---|
| 14802 Cooper Ave Harvey, IL | 3.0 | 1.5 | 1200 | $1,700 | $1.42 | 25d | 1 | 0.18mi |
| 14629 Hoyne Ave Dixmoor, IL | 3.0 | 1.0 | 920 | $1,495 | $1.62 | 25d | 1 | 0.37mi |
| 14521 Richmond Ave Unit 3 Posen, IL | 2.0 | 1.0 | 850 | $1,375 | $1.62 | 25d | 1 | 1.41mi |
Listing history 27 events
-
2026-06-21days on market $49,890 Active 5 DOM
-
2026-06-18days on market $49,890 Active 2 DOM
-
2026-06-17pricestatusdays on market $49,890 Active 1 DOM
-
2026-06-16days on market $49,900 Temporarily No Showings 8 DOM
-
2026-06-15statusdays on market $49,900 Temporarily No Showings 7 DOM
-
2026-06-13days on market $49,900 Active 5 DOM
-
2026-06-13days on market $49,900 Active 4 DOM
-
2026-06-09remarks 699-char remark
-
2026-06-09statusdays on market $49,900 Active 1 DOM
-
2026-06-08days on market $49,900 Contingent - Continue to Show 94 DOM
-
2026-06-07days on market $49,900 Contingent - Continue to Show 93 DOM
-
2026-06-04days on market $49,900 Contingent - Continue to Show 90 DOM
-
2026-06-03days on market $49,900 Contingent - Continue to Show 89 DOM
-
2026-06-02days on market $49,900 Contingent - Continue to Show 88 DOM
-
2026-06-01days on market $49,900 Contingent - Continue to Show 87 DOM
-
2026-05-31days on market $49,900 Contingent - Continue to Show 86 DOM
-
2026-03-23historical Contingent - Continue to Show
-
2026-03-06$49,900 Active
-
2026-01-03historical Contingent - Continue to Show
-
2025-12-30historical
-
2025-12-13Active
-
2024-10-10status Pending
-
2024-10-07historical
-
2024-09-26Active
-
2024-06-24historical
-
2024-06-19Active
-
1991-08-26soldstatus $44,500
ⓘ Source: listings_history table (triggers on properties + properties_extension) + one-shot
backfill from property_details.listing_events for pre-trigger history.
Tax reassessment forecast IL · Partial reset (capped growth)
- Current annual tax
- $975 · $81/mo
- Projected year-2 tax
- $1,054 · $88/mo
- Expected delta
- +$79/yr (+$7/mo · 8.1%)
ⓘ Screening estimate from a state-policy table — verify with the county assessor before closing.
Climate risk First Street
- Flood 1/10 Low FEMA zone AH · 0% chance over 30 yrs
- Wildfire 1/10 Low
- Heat 3/10 Moderate 7 d/yr ≥102°F today · 15 d/yr by 30 yrs out
- Wind 2/10 Low
- Air quality 3/10 Moderate 4 unhealthy d/yr today · 4 by 30 yrs out
Nearby sold comps map
Loading sold comps map…
Walkable amenities ~0.75 mi
Loading nearby amenities…
Taxation est. · year 1
- Rental income
- $19,479
- − Mortgage interest
- −$2,795
- − Property taxes
- −$975
- − Insurance
- −$2,558
- − Repairs & maintenance
- −$1,558
- − Management
- −$1,558
- − Depreciation
- −$1,451
- Taxable income
- $8,583
- Est. tax owed @ 24.0%
- −$2,060
- After-tax cash flow
- $6,655/yr
For passive investors: Depreciation is non-cash, so a rental often shows a tax loss while cash-flowing — sheltering income. Rental losses are passive: they offset passive income freely, and up to $25,000/yr can offset ordinary (W-2) income if you actively participate and your MAGI is under $100k (phasing out to $0 by $150k); unused losses carry forward. On sale, claimed depreciation is recaptured at up to 25%, and gains may owe capital-gains tax (a 1031 exchange can defer both). Figures are a year-1 estimate at your 24.0% rate — not tax advice; consult a CPA.
Schools (NCES district)
- District
- Thornton Twp Hsd 205
- NCES district ID
- 1738970
- Math proficiency
- 7% ▬ 0.00%
- Reading proficiency
- 8% ▼ -2.00%
- Median HH income
- $43,392
- Composite
- 6.92/100
- National rank
- #9976
- State rank
- #594 of 620 in IL
Livability — Harvey
- Score
- 67/100
- State rank
- #539
- US rank
- #11162
Category grades
Schools grade is shown separately in the Schools card above.
Census & demographics
- Census place
- Harvey, IL
- City population
- 23,066
- Population (ZIP)
- 23,066
Population outlook (Cook County) Hauer SSP2
- Today (2025)
- 5,347,519 people
- By 2030
- 5,357,703 · +0.2%
- By 2040
- 5,324,924 · -0.4%
- By 2050
- 5,230,762 · -2.2%
- By 2075
- 4,785,735 · -10.5%
- By 2100
- 4,188,836 · -21.7%
Race, ethnicity, and origin ACS 2023
- Neighborhood character
- Majority Black (59%)
- Race & ethnicity
- Black 59% Hispanic / Latino 33% Two or more races 12% White 3% Asian 2%
- Hispanic origin (detail)
- Mexican 31%
- Foreign-born
- 17% · Canada
- Languages at home
- 67% English-only · Spanish 30% Other Indo-European 2% French/Haitian/Cajun 1%
Political lean MEDSL · Cook
- 2024 margin
- Solid D (+42.0) · D 70.4% · R 28.4% · Other 1.2%
- 2008→2024 swing
- -11.4pp toward R · 2008: 53.4pp · 2024: 42.0pp
- All cycles
- 2024: D+42.0 2020: D+50.3 2016: D+53.0 2012: D+49.4 2008: D+53.4
Not yet ingested
- Civics
- —
Market trends
- HPI YoY
- ▲ 20.36%
- Current HPI
- 313.7895
- Rent YoY
- —
- Metro
- —
- State GDP YoY
- ▲ 1.59%
- F500 in state
- 60
Industry mix (Fortune 500 HQ in IL)
| Industry | F500 HQs | Revenue |
|---|---|---|
| Insurance | 4 | $201B |
|
||
| Consumer Goods | 4 | $87B |
|
||
| Industrial Machinery | 3 | $64B |
|
||
| Healthcare | 2 | $55B |
|
||
| Retail / Pharmacy | 1 | $148B |
|
||
| Agriculture / Food | 1 | $86B |
|
||
Price history
+12.1% since first listed11 events — show timeline
- 2026-03-23 Contingent — MRED as Distributed by MLS Grid
- 2026-03-06 Listed $49,900 MRED as Distributed by MLS Grid
- 2026-01-03 Contingent — MRED as Distributed by MLS Grid
- 2025-12-30 Listing Removed — MRED as Distributed by MLS Grid
- 2025-12-13 Listed — MRED as Distributed by MLS Grid
- 2024-10-10 Pending — MRED as Distributed by MLS Grid
- 2024-10-07 Listing Removed — MRED as Distributed by MLS Grid
- 2024-09-26 Listed — MRED as Distributed by MLS Grid
- 2024-06-24 Listing Removed — MRED as Distributed by MLS Grid
- 2024-06-19 Listed — MRED as Distributed by MLS Grid
- 1991-08-26 Sold (Public Records) $44,500 Public Records
Property tax history
-2.0%/yrLatest (2023): $975 · +2.4% YoY. Source: county tax records.
Cash-flow waterfall
monthlySold comps — $/sqft
last 12 mo · ≤1 miLoading sold comps…