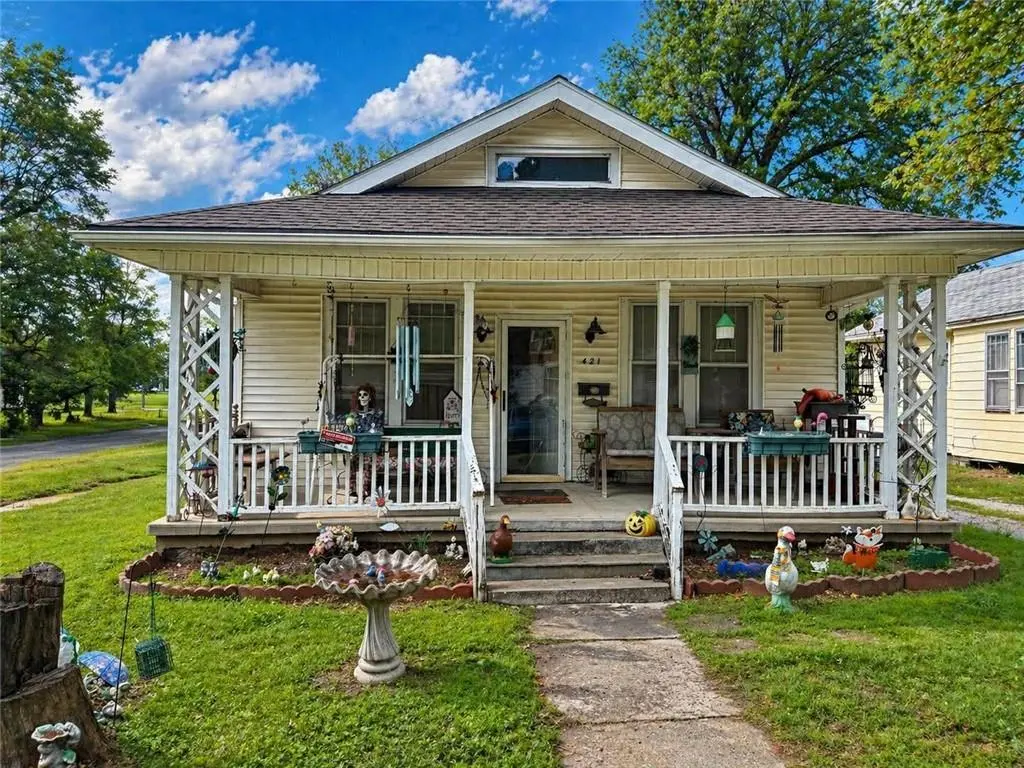
421 Lynn St · Columbus, KS
Flood risk 1/10 · Minimal
- FEMA flood zone
- X (unshaded)
- Chance of flooding over 30 yrs
- 0.0%
- Est. flood insurance / yr
- $507 – $1,088
Fire risk 4/10 · Minor
- Est. fire insurance / yr
- $1,154 – $2,142
Heat risk 5/10 · Moderate
- Hot days now (above 108°F)
- 7 days/yr
- Hot days in 30 yrs
- 20 days/yr
Wind risk 2/10 · Minimal
- Chance of severe wind over 30 yrs
- 2.0%
Air-quality risk 2/10 · Minimal
- Unhealthy air days now
- 1 days/yr
- Unhealthy air days in 30 yrs
- 1 days/yr
Risk factors via First Street. Map © Google.
Why this score? — see what drove the B- grade
The composite is a weighted blend of 9 inputs, each scored 0–100. Each bar is that input's sub-score; the figure is the points it added to the 100-point composite (weight × sub-score).
- Cash flow +29.5/30.0
- ARV discount +10.2/15.0
- DSCR +10.0/10.0
- 1% rule +8.0/10.0
- Livability +3.7/5.0
- Rent growth +2.5/5.0
- Condition / age +2.5/5.0
- Schools +2.4/10.0
- Appreciation +0.0/10.0
$69,000
🖨 Deal sheet 📄 Offer letter ✓ Due diligence
Listing remarks MLS
This 2-bedroom bungalow is situated on a corner lot and includes a detached garage, drive-under garage area, backyard, storage shed, and patio. The property is equipped with solar panels, which the seller will pay in full prior to closing and will remain with the property. Buyers are encouraged to verify utility savings, system specifications, warranties, and transfer requirements to their satisfaction. Contact your agent today for additional information or to schedule a showing.
Key facts
- Fenced patio
- Backyard
- Corner lot
Tags
Property features AI
Finance
- HOA & community: No association fees
Exterior
- Parking: Detached 1-car garage
- Utilities: Public water; Public sewer
- Home design: Single-family residence; Residential property; Bungalow; Approximately 1,084 above-grade living area
- Construction: Vinyl siding; Composition roof; Approximately 101+ years old
- Exterior features: Lot approximately 11,760 square feet; Not in a flood plain
Interior
- Bedrooms: 2 bedrooms
- Bathrooms: 1 full bathroom
- Heating & cooling: Other heating; Window unit(s) for cooling
- Interior features: Crawl space basement; Bungalow-style floor plan
Neighborhood map
What this means for you Summary
Snapshot
- This is a 2-bed/1.0-bath single-family listed at $69k.
Deal economics
- At list price, monthly cash flow is $246 ($3k/yr) — positive.
- The deal already cash-flows at list — no discount required.
- Meets the 1% rule at list price ($900 rent vs $69k).
- Recommended offer: $67k (3.0% below list) — sets the bar for market timing.
- Cap rate 10.6% vs local median 5.4% in Columbus — top-decile yield for the area; either an underpriced asset or a hidden risk that comps aren't pricing in. Stress-test before assuming the spread holds.
Location & tenants
- Location reads 73/100 on livability (#96 in KS) — a middle-class / working-renter tenant base. Strengths: cost of living A+, health & safety A+, housing B; Watch: schools D-, amenities F, commute F.
- Columbus (town): math 22% / reading 35% proficiency, ranked #120 of 169 in KS (top 71%) — low school quality limits family demand, transient renter base, plan for 1-2y turnover.
- Market conditions: 40 active listings in the ZIP; 1 comparable units currently listed for rent nearby; 17 units permitted in Cherokee County in 2024 (0 in 5+ unit buildings).
Forward outlook
- Local home prices are declining (-3.0%/yr); year-one equity from $477 of loan paydown is wiped out by about $2k of value loss. Plan a longer hold.
- Cherokee County population projected at -26% by 2050 — secular population decline; favor cash flow + early exit over multi-decade hold.
- At projected returns (-3.0% appreciation + 3.0% rent growth), your $19k cash investment doubles in ~8 years — after that, you're playing with house money.
Negotiation context
- It's been on market 49 days — a 3% lower offer ($67k) is reasonable based on typical stale-listing flexibility.
- 4 sale attempts since 10y ago with the ask held roughly flat each time — persistent listings suggest the price (not the market) is what's stuck; bring a comps-based counter.
- Current owner paid $14k; list at $69k implies a 376% gain — meaningful room to come down on a strong offer.
Risks & watch-outs
- Watch-outs: built in 1920 — expect roof / HVAC / electrical / plumbing capex.
- Climate carrying-cost: extreme-heat days projected 7→20/yr by 2055 (HVAC capex compounding) — expect insurance premiums to compound above CPI over the hold.
Questions for the listing agent
- It's been on market 49 days. Have you received any prior offers? Is the seller open to a 3% concession, seller financing, or rate buy-down credit?
- Built in 1920 — when were the roof, HVAC, electrical panel, plumbing, and water heater last replaced?
- Is there a deadline driving the sale (1031 exchange, divorce, estate, relocation)? That informs how much negotiation room exists.
- Schools are D-rated, which usually means shorter tenancies and higher turnover. Who's the typical renter profile here, and what's been the actual vacancy rate?
- What's the average days-on-market for RENTAL listings here right now (not sales)? A rising rental-DOM trend means longer vacancies and softer asking-rent achievability than the comps imply.
- What's the recent tenant-quality profile in this submarket — average credit score on applications, eviction rate, late-payment / NSF rate, and stable-employment percentage? A property-management company in the area should have these aggregated.
- How much new for-sale + rental construction is in the pipeline within 1–3 miles? Heavy new supply typically softens prices + rents 12–24 months out; constrained supply supports both.
Investment metrics
- 1% rule
- 1.30% ✓
- Cap rate
- 10.57%
- Cash-on-cash
- 15.27%
- DSCR
- 1.68
- GRM
- 6.4
CMA / ARV
- ARV (median comp)
- $73,367
- List price
- $69,000
- Delta
- -5.95%
- Verdict
- FAIR
- Comps
- 20 within 1.0 mi
Show comp detail 9 sales within ~0.75 mi
| Address | Dist | Beds/Ba | Sqft | Sold | Price | $/sf | Match |
|---|---|---|---|---|---|---|---|
| 401 S Lynn Ave | 0.04mi | 3/1.0 (+1) | 1,068 (-2%) | 1mo | $45,000 | $42 | 90 |
| 501 S Kansas St | 0.34mi | 2/1.0 | 1,068 (-2%) | 10mo | $80,000 | $75 | 73 |
| 321 W Maple St | 0.36mi | 1/1.0 (-1) | 1,104 (+2%) | 8mo | $49,999 | $45 | 68 |
| 525 S Delaware St | 0.49mi | 2/1.0 | 1,066 (-2%) | 20mo | $90,000 | $84 | 58 |
| 908 W Pine St | 0.38mi | 3/1.0 (+1) | 1,035 (-4%) | 15mo | $70,000 | $68 | 57 |
| 214 W Mulberry St | 0.25mi | 2/1.0 | 1,223 (+13%) | 18mo | $60,000 | $49 | 52 |
| 533 S Indiana Ave | 0.42mi | 3/1.0 (+1) | 1,149 (+6%) | 18mo | $30,000 | $26 | 50 |
| 506 S Delaware Ave | 0.51mi | 3/1.5 (+1) | 1,148 (+6%) | 12mo | $95,000 | $83 | 49 |
| 203 S Lash Ave | 0.58mi | 3/2.0 (+1) | 1,123 (+4%) | 17mo | $69,999 | $62 | 44 |
Match score weights: distance 35% · size 25% · config 20% · recency 20%. Top-matched comps best support the ARV.
Projected returns pro-forma
-3.0% appreciation · 3.0% rent growth · sell at horizon
- IRR
- 6.0%
- Equity multiple
- 1.23×
- Total profit
- $4,484
- Equity at exit
- $10,288
- IRR
- 15.4%
- Equity multiple
- 2.25×
- Total profit
- $24,094
- Equity at exit
- $5,966
Cash invested: $19,320 (down + closing). Projections, not guarantees.
Landlord ↔ Tenant lean methodology
- Overall (STATE)
- 83 Strongly Landlord-Friendly
- State Kansas
- 83 Strongly Landlord-Friendly · R+10
- County
- — inherits STATE
- City
- — inherits STATE
ZIP-level market 66725
- Home prices YoY
- -11.7%
- Active inventory
- 40
- Price-to-rent
- 6.4×
Monthly cashflow live
- Estimated rent
- $900 medium interval (Pro) →
- Mortgage (P&I)
- −$362
- Tax from tax record
- −$75 /mo · $895/yr
- Insurance
- −$29
- HOA
- −$0
- Vacancy / Maint / Mgmt
- −$189
- Net cashflow
- $246
Break-even live
UW: 25.0% down · 7.5% · 30yr · 1.5% tax · 5.0% vac · 8.0% maint · 8.0% mgmt
Financing live
Cash to close
- Down payment
- $17,250
- Closing costs
- $2,070
- Reserves months
- —
- Total cash needed
- —
Loan-product check · same deal, 3 products live
Conventional
25% down · 7.5% · 30yr
- Down + closing
- —
- Monthly P&I
- —
- Monthly cashflow
- —
- DSCR
- —
- Eligible?
- —
Personal DTI + credit; lowest rate.
DSCR
20% down · 8.5% · 30yr
- Down + closing
- —
- Monthly P&I
- —
- Monthly cashflow
- —
- DSCR
- —
- Eligible?
- —
No personal income docs; deal must DSCR.
Hard money
10% down · 12.0% · 12mo
- Down + closing
- —
- Monthly P&I
- —
- Monthly cashflow
- —
- DSCR
- —
- Eligible?
- —
Short-term bridge; refi at stabilization.
Rent comps 1 comps
| Address | Beds | Baths | Sqft | Rent | $/sqft | DOM | Units | Dist |
|---|---|---|---|---|---|---|---|---|
| 401 Northeast Ave Columbus, KS | 1.0 | 1.0 | 900 | $900 | $1.00 | 21d | 1 | 1.03mi |
Listing history 26 events
-
2026-06-19days on market $69,000 Active 49 DOM
-
2026-06-18days on market $69,000 Active 48 DOM
-
2026-06-17days on market $69,000 Active 47 DOM
-
2026-06-16days on market $69,000 Active 46 DOM
-
2026-06-15days on market $69,000 Active 45 DOM
-
2026-06-14days on market $69,000 Active 43 DOM
-
2026-06-13days on market $69,000 Active 42 DOM
-
2026-06-10days on market $69,000 Active 40 DOM
-
2026-06-09days on market $69,000 Active 39 DOM
-
2026-06-08days on market $69,000 Active 38 DOM
-
2026-06-07days on market $69,000 Active 37 DOM
-
2026-06-05days on market $69,000 Active 34 DOM
-
2026-06-03days on market $69,000 Active 33 DOM
-
2026-06-02days on market $69,000 Active 32 DOM
-
2026-06-01days on market $69,000 Active 31 DOM
-
2026-05-31days on market $69,000 Active 30 DOM
-
2026-05-30days on market $69,000 Active 29 DOM
-
2026-05-01$69,000 Active 207-char remark
-
2026-04-29$69,000 Active 198-char remark
Show marketing remark (484 chars)
This 2-bedroom bungalow is situated on a corner lot and includes a detached garage, drive-under garage area, backyard, storage shed, and patio. The property is equipped with solar panels, which the seller will pay in full prior to closing and will remain with the property. Buyers are encouraged to verify utility savings, system specifications, warranties, and transfer requirements to their satisfaction. Contact your agent today for additional information or to schedule a showing.
-
2019-09-03soldstatus
Show marketing remark (318 chars)
Two houses that will sell on one deed. Here is 419 and 421 S Lynn they are both 2 bedroom bungalows. 421 (white) sets on the corner and a has a detached garage and a shed in the back yard, with a nice yard and a patio. It was mostly remodeled in 2017. 419 (yellow) has been a rental for a long time and needs some TLC.
-
2019-07-10$55,000
Show marketing remark (318 chars)
Two houses that will sell on one deed. Here is 419 and 421 S Lynn they are both 2 bedroom bungalows. 421 (white) sets on the corner and a has a detached garage and a shed in the back yard, with a nice yard and a patio. It was mostly remodeled in 2017. 419 (yellow) has been a rental for a long time and needs some TLC.
-
2016-11-15soldstatus
-
2016-04-06$22,500
-
1992-01-01soldstatus $14,500
-
1986-12-01soldstatus $12,000
-
1986-07-01soldstatus $13,500
ⓘ Source: listings_history table (triggers on properties + properties_extension) + one-shot
backfill from property_details.listing_events for pre-trigger history.
Tax reassessment forecast KS · Resets to sale price
- Current annual tax
- $895 · $75/mo
- Projected year-2 tax
- $973 · $81/mo
- Expected delta
- +$78/yr (+$7/mo · 8.8%)
ⓘ Screening estimate from a state-policy table — verify with the county assessor before closing.
Climate risk First Street
- Flood 1/10 Low FEMA zone X (unshaded) · 0% chance over 30 yrs
- Wildfire 4/10 Moderate
- Heat 5/10 Major 7 d/yr ≥108°F today · 20 d/yr by 30 yrs out
- Wind 2/10 Low 2% chance of damaging wind over 30 yrs
- Air quality 2/10 Low 1 unhealthy d/yr today · 1 by 30 yrs out
Nearby sold comps map
Loading sold comps map…
Walkable amenities ~0.75 mi
Loading nearby amenities…
Taxation est. · year 1
- Rental income
- $10,800
- − Mortgage interest
- −$3,865
- − Property taxes
- −$895
- − Insurance
- −$345
- − Repairs & maintenance
- −$864
- − Management
- −$864
- − Depreciation
- −$2,007
- Taxable income
- $1,960
- Est. tax owed @ 24.0%
- −$470
- After-tax cash flow
- $2,480/yr
For passive investors: Depreciation is non-cash, so a rental often shows a tax loss while cash-flowing — sheltering income. Rental losses are passive: they offset passive income freely, and up to $25,000/yr can offset ordinary (W-2) income if you actively participate and your MAGI is under $100k (phasing out to $0 by $150k); unused losses carry forward. On sale, claimed depreciation is recaptured at up to 25%, and gains may owe capital-gains tax (a 1031 exchange can defer both). Figures are a year-1 estimate at your 24.0% rate — not tax advice; consult a CPA.
Schools (NCES district)
- District
- Columbus
- NCES district ID
- 2005070
- Math proficiency
- 22% ▼ -1.00%
- Reading proficiency
- 35% ▼ -3.00%
- Median HH income
- $41,308
- Composite
- 24.08/100
- National rank
- #7756
- State rank
- #120 of 169 in KS
Livability — Columbus
- Score
- 73/100
- State rank
- #96
- US rank
- #5460
Category grades
Schools grade is shown separately in the Schools card above.
Census & demographics
- Census place
- Columbus, KS
- Population (ZIP)
- 5,102
Population outlook (Cherokee County) Hauer SSP2
- Today (2025)
- 18,848 people
- By 2030
- 17,862 · -5.2%
- By 2040
- 15,850 · -15.9%
- By 2050
- 13,915 · -26.2%
- By 2075
- 10,102 · -46.4%
- By 2100
- 6,977 · -63.0%
Race, ethnicity, and origin ACS 2023
- Neighborhood character
- Predominantly White (86%)
- Race & ethnicity
- White 86% Two or more races 8% Black 2% Hispanic / Latino 2% Native American 1%
- Common ancestry
- Italian 4% Lithuanian 2% Serbian 1%
- Foreign-born
- 1% · Canada
- Languages at home
- 97% English-only · Spanish 3%
Political lean MEDSL · Cherokee
- 2024 margin
- Solid R (+52.9) · D 22.6% · R 75.5% · Other 1.9%
- 2008→2024 swing
- -29.2pp toward R · 2008: -23.7pp · 2024: -52.9pp
- All cycles
- 2024: R+52.9 2020: R+49.9 2016: R+48.4 2012: R+29.5 2008: R+23.7
Not yet ingested
- Civics
- —
Market trends
- HPI YoY
- ▼ -28.61%
- Current HPI
- 216.89
- Rent YoY
- —
- Metro
- —
- State GDP YoY
- —
- F500 in state
- 0
Price history
+411.1% since first listed9 events — show timeline
- 2026-05-01 Listed $69,000 Heartland MLS as Distributed by MLS Grid
- 2026-04-29 Listed $69,000 OGAR
- 2019-09-03 Sold (MLS) — OGAR
- 2019-07-10 Listed $55,000 OGAR
- 2016-11-15 Sold (MLS) — OGAR
- 2016-04-06 Listed $22,500 OGAR
- 1992-01-01 Sold (Public Records) $14,500 Public Records
- 1986-12-01 Sold (Public Records) $12,000 Public Records
- 1986-07-01 Sold (Public Records) $13,500 Public Records
Property tax history
+4.4%/yrLatest (2025): $895 · -1.8% YoY. Source: county tax records.
Cash-flow waterfall
monthlySold comps — $/sqft
last 12 mo · ≤1 miLoading sold comps…