 🏗️ New Construction
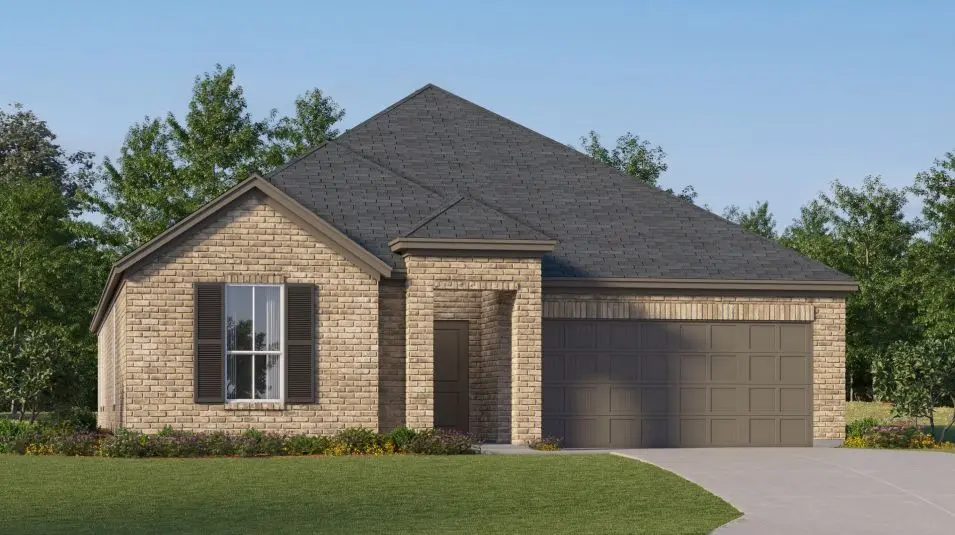
Elton Plan · Mesquite, TX
Flood risk No data
- FEMA flood zone
- —
- Chance of flooding over 30 yrs
- —
- Est. flood insurance / yr
- —
Fire risk No data
- Est. fire insurance / yr
- —
Heat risk No data
- Hot days now (above threshold)
- —
- Hot days in 30 yrs
- —
Wind risk No data
- Chance of severe wind over 30 yrs
- —
Air-quality risk No data
- Unhealthy air days now
- —
- Unhealthy air days in 30 yrs
- —
Risk factors via First Street. Map © Google.
Why this score? — see what drove the F grade
The composite is a weighted blend of 9 inputs, each scored 0–100. Each bar is that input's sub-score; the figure is the points it added to the 100-point composite (weight × sub-score).
- ARV discount +7.5/15.0
- Cash flow +6.8/30.0
- Livability +3.5/5.0
- Schools +2.9/10.0
- Rent growth +2.5/5.0
- Condition / age +2.5/5.0
- 1% rule +1.8/10.0
- DSCR +1.0/10.0
- Appreciation +0.0/10.0
$369,999
🖨 Deal sheet (PDF) 📄 Offer letter ✓ Due diligence
Listing remarks MLS
This new single-level home is host to an inviting open floorplan with convenient access to a covered patio, ideal for seamless entertaining. Three secondary bedrooms are located off the foyer, and the luxurious owner's suite is tucked to the side of the home, complete with an en-suite bathroom and walk-in closet. A versatile flex space can be found off the main living area.
Key facts
- Flex space
- Walk-in closet
- Open floorplan
Tags
Neighborhood map
What this means for you Summary
Snapshot
- This is a 4-bed/2.0-bath single-family listed at $370k.
Deal economics
- At list price, monthly cash flow is $-679 ($-8k/yr) — negative.
- To cash-flow at today's rent, offer at most $340k (8.2% below list).
- To meet the 1% rule (rent ≥ 1% of price), the offer needs to be $297k (19.7% below list).
- Recommended offer: $297k (19.7% below list) — sets the bar for 1% rule.
Location & tenants
- Location reads 70/100 on livability (#358 in TX) — a middle-class / working-renter tenant base. Strengths: cost of living A+, housing A+, health & safety A-; Watch: crime F, commute F.
- Mesquite ISD (suburban): math 35% / reading 32% proficiency, ranked #536 of 826 in TX (top 65%) — families likely to look elsewhere, expect single-tenant / working-renter base with shorter leases; 63% free/reduced lunch — lower-income household profile, screen leases tightly.
- Zoned schools: Gentry El (math 34% / reading 40%, grade F, #1,769 of 4,322 statewide, top 44%, 637 students, 79% FRL); Berry Middle (math 45% / reading 41%, grade D-, #540 of 1,662 statewide, top 33%, 579 students, 76% FRL); Horn H S (math 41% / reading 36%, grade F, #866 of 1,632 statewide, top 54%, 3,029 students, 74% FRL).
- Market conditions: Rents flat; 598 active listings in the ZIP; 32 comparable units currently listed for rent nearby; rentals at typical pace (median 26d on market — plan ~3-4 weeks tenant-placement turnaround); high-income renter base; 12,577 units permitted in Dallas County in 2024 (6,829 in 5+ unit buildings).
- This rent runs 32% of the median local income ($111k/yr) — at the standard rent-burdened threshold; future hikes will face affordability resistance.
Forward outlook
- Local home prices are declining (-3.0%/yr); year-one equity from $3k of loan paydown is wiped out by about $13k of value loss. Plan a longer hold.
- Dallas County population projected at +35% by 2050 — long-run rental-demand tailwind backs the buy-and-hold thesis.
Negotiation context
- It's been on market 198 days — a 12% lower offer ($326k) is reasonable based on typical stale-listing flexibility.
Questions for the listing agent
- What do current leases actually rent for vs. the listed asking? Can we see a recent rent roll and the last 12 months of T-12 income?
- It's been on market 198 days. Have you received any prior offers? Is the seller open to a 20% concession, seller financing, or rate buy-down credit?
- Why hasn't it sold? Are there any deal-killer items the seller is aware of (foundation, flood, title, zoning, code violations)?
- Is there a deadline driving the sale (1031 exchange, divorce, estate, relocation)? That informs how much negotiation room exists.
- Crime grade is F in this area — have there been break-ins, vandalism, or insurance claims at this property in the last 3 years? What carrier currently insures it and at what premium?
- The area grade is low — what's the realistic commute time and amenity access for the typical tenant pool here? Any planned neighborhood developments (good or bad) we should know about?
- What's the average days-on-market for RENTAL listings here right now (not sales)? A rising rental-DOM trend means longer vacancies and softer asking-rent achievability than the comps imply.
- What's the recent tenant-quality profile in this submarket — average credit score on applications, eviction rate, late-payment / NSF rate, and stable-employment percentage? A property-management company in the area should have these aggregated.
- How much new for-sale + rental construction is in the pipeline within 1–3 miles? Heavy new supply typically softens prices + rents 12–24 months out; constrained supply supports both.
Investment metrics
- 1% rule
- 0.68% ✗
- Cap rate
- 4.43%
- Cash-on-cash
- -6.64%
- DSCR
- 0.70
- GRM
- 12.3
CMA / ARV
- ARV (median comp)
- $438,100
- List price
- $369,999
- Delta
- -15.54%
- Verdict
- UNDERPRICED
- Comps
- 20 within 1.0 mi
Show comp detail 12 sales within ~0.75 mi
| Address | Dist | Beds/Ba | Sqft | Sold | Price | $/sf | Match |
|---|---|---|---|---|---|---|---|
| 1805 Tree House Trl | 0.12mi | 4/2.0 | 2,204 (+6%) | 5mo | $404,990 | $184 | 81 |
| 1708 Possum Fire Trl | 0.19mi | 4/3.0 | 2,182 (+5%) | 6mo | $464,006 | $213 | 74 |
| 2021 Jade Frst | 0.37mi | 4/3.0 | 2,001 (-4%) | 7mo | $399,999 | $200 | 66 |
| 1901 Kit Fox Run | 0.48mi | 4/3.0 | 1,945 (-7%) | 2mo | $360,000 | $185 | 61 |
| 2225 Hazel Lily Run | 0.37mi | 4/3.0 | 2,358 (+13%) | 0mo | $414,990 | $176 | 56 |
| 1833 Cedarbriar Dr | 0.62mi | 3/2.0 (-1) | 2,011 (-4%) | 6mo | $305,000 | $152 | 55 |
| 2417 Johnson Dr | 0.69mi | 4/2.0 | 1,982 (-5%) | 7mo | $349,900 | $177 | 54 |
| 2008 Cantura Dr | 0.73mi | 3/2.0 (-1) | 2,164 (+4%) | 1mo | $299,000 | $138 | 54 |
| 2105 Jade Forest Ln | 0.40mi | 3/2.0 (-1) | 1,821 (-13%) | 6mo | $409,990 | $225 | 50 |
| 1813 Jade Forest Ln | 0.40mi | 4/3.0 | 2,358 (+13%) | 6mo | $449,990 | $191 | 50 |
| 2404 Tarrango Trl | 0.73mi | 3/2.0 (-1) | 1,898 (-9%) | 1mo | $364,990 | $192 | 45 |
| 2021 Cantura Dr | 0.68mi | 3/3.0 (-1) | 1,815 (-13%) | 3mo | $294,900 | $162 | 36 |
Match score weights: distance 35% · size 25% · config 20% · recency 20%. Top-matched comps best support the ARV.
Projected returns pro-forma
-3.0% appreciation · 0.07% rent growth · sell at horizon
- IRR
- -31.1%
- Equity multiple
- -0.00×
- Total profit
- $-122,714
- Equity at exit
- $65,322
- IRR
- -53.9%
- Equity multiple
- -0.59×
- Total profit
- $-195,321
- Equity at exit
- $37,879
Cash invested: $122,668 (down + closing). Projections, not guarantees.
Landlord ↔ Tenant lean methodology
- Overall (STATE)
- 87 Strongly Landlord-Friendly
- State Texas
- 87 Strongly Landlord-Friendly · R+5
- County
- — inherits STATE
- City
- — inherits STATE
ZIP-level market 75181
- Home prices YoY
- -9.4%
- Rents YoY
- 0.1%
- Active inventory
- 598
- Price-to-rent
- 10.4×
Monthly cashflow live
- Estimated rent
- $2,973 high interval (Pro) →
- Mortgage (P&I)
- −$2,297
- Tax est. 1.5%
- −$548 /mo · $6,572/yr
- Insurance
- −$183
- HOA
- −$0
- Vacancy / Maint / Mgmt
- −$624
- Net cashflow
- $-679
Break-even live
Sensitivity live
| Price | -10% $-376 | -5% $-528 | +0% $-679 | +5% $-830 | +10% $-982 |
|---|---|---|---|---|---|
| Rent | -10% $-914 | -5% $-797 | +0% $-679 | +5% $-562 | +10% $-444 |
| Rate | -1.0pp $-458 | -0.5pp $-568 | base $-679 | +0.5pp $-793 | +1.0pp $-908 |
UW: 25.0% down · 7.5% · 30yr · 1.5% tax · 5.0% vac · 8.0% maint · 8.0% mgmt
Financing live
Cash to close
- Down payment
- $109,525
- Closing costs
- $13,143
- Reserves months
- —
- Total cash needed
- —
Loan-product check · same deal, 3 products live
Conventional
25% down · 7.5% · 30yr
- Down + closing
- —
- Monthly P&I
- —
- Monthly cashflow
- —
- DSCR
- —
- Eligible?
- —
Personal DTI + credit; lowest rate.
DSCR
20% down · 8.5% · 30yr
- Down + closing
- —
- Monthly P&I
- —
- Monthly cashflow
- —
- DSCR
- —
- Eligible?
- —
No personal income docs; deal must DSCR.
Hard money
10% down · 12.0% · 12mo
- Down + closing
- —
- Monthly P&I
- —
- Monthly cashflow
- —
- DSCR
- —
- Eligible?
- —
Short-term bridge; refi at stabilization.
Rent comps 32 comps
| Address | Beds | Baths | Sqft | Rent | $/sqft | DOM | Units | Dist |
|---|---|---|---|---|---|---|---|---|
| 1908 Twisted Tree Ln Mesquite, TX | 5.0 | 2.5 | 2750 | $3,670 | $1.33 | 26d | 1 | 0.27mi |
| 2004 Poppy Way Mesquite, TX | 3.0 | 2.0 | 1572 | $2,700 | $1.72 | 45d | 1 | 0.32mi |
| 2201 Cantura Dr Mesquite, TX | 4.0 | 2.0 | 2432 | $2,700 | $1.11 | 0d | 1 | 0.59mi |
| 1817 Cedarbriar Dr Mesquite, TX | 5.0 | 3.5 | 2538 | $3,495 | $1.38 | 45d | 1 | 0.61mi |
| 2439 Whitetail Dr Mesquite, TX | 4.0 | 2.5 | 2484 | $2,800 | $1.13 | 26d | 1 | 0.72mi |
| 1809 Osage Trl Mesquite, TX | 4.0 | 2.0 | 2022 | $2,599 | $1.29 | 19d | 1 | 0.77mi |
| 2600 Waterloo Ln Mesquite, TX | 3.0 | 2.0 | 1460 | $1,900 | $1.30 | 45d | 1 | 0.82mi |
| 1729 Hazer Ln Mesquite, TX | 3.0 | 2.0 | 1498 | $2,400 | $1.60 | 22d | 1 | 0.83mi |
| 732 Creekview Ct Mesquite, TX | 5.0 | 3.0 | 2313 | $3,495 | $1.51 | 45d | 1 | 0.91mi |
| 815 Valleycreek Rd Mesquite, TX | 3.0 | 2.0 | 1788 | $2,500 | $1.40 | 45d | 1 | 1.02mi |
| 1332 Nimitz Way Mesquite, TX | 4.0 | 2.0 | 2109 | $2,280 | $1.08 | 22d | 1 | 1.02mi |
| 1309 Dawson Way Mesquite, TX | 4.0 | 2.0 | 1952 | $2,222 | $1.14 | 9d | 1 | 1.05mi |
| 1308 Dawson Way Mesquite, TX | 4.0 | 2.5 | 2476 | $3,573 | $1.44 | 26d | 1 | 1.08mi |
| 2749 Ingram Cir Mesquite, TX | 3.0 | 2.0 | 1791 | $2,119 | $1.18 | 5d | 1 | 1.24mi |
| 2637 Austin Dr Mesquite, TX | 4.0 | 2.5 | 2291 | $3,350 | $1.46 | 45d | 1 | 1.28mi |
| 2621 Ash Crk Mesquite, TX | 3.0 | 2.0 | 1843 | $2,299 | $1.25 | 45d | 1 | 1.30mi |
| 2302 Highbank Dr Mesquite, TX | 3.0 | 2.0 | 1783 | $2,145 | $1.20 | 45d | 1 | 1.33mi |
| 716 Elm Falls Pl Mesquite, TX | 3.0 | 2.0 | 2444 | $2,300 | $0.94 | 22d | 1 | 1.35mi |
| 1626 Rancho Dr Mesquite, TX | 4.0 | 2.0 | 2562 | $2,419 | $0.94 | 26d | 1 | 1.38mi |
| 2725 Stillwater Dr Mesquite, TX | 5.0 | 2.5 | 2228 | $3,199 | $1.44 | 0d | 1 | 1.41mi |
| 2829 Kerrville Dr Mesquite, TX | 4.0 | 2.5 | 2349 | $2,700 | $1.15 | 6d | 1 | 1.41mi |
| 2805 Cameron Way Mesquite, TX | 3.0 | 2.0 | 1660 | $2,150 | $1.30 | 14d | 1 | 1.43mi |
| 2724 Windswept Ln Mesquite, TX | 3.0 | 2.0 | 1402 | $2,300 | $1.64 | 26d | 1 | 1.44mi |
| 1704 Bent Brook Dr Mesquite, TX | 5.0 | 3.0 | 2726 | $2,900 | $1.06 | 20d | 1 | 1.44mi |
| 2213 Creek Royal Dr Mesquite, TX | 3.0 | 2.0 | 1505 | $1,850 | $1.23 | 24d | 1 | 1.45mi |
| 2213 Creek Royal Dr Mesquite, TX | 3.0 | 2.0 | 1505 | $1,850 | $1.23 | 45d | 1 | 1.45mi |
| 1217 Buckeye Dr Mesquite, TX | 3.0 | 2.0 | 1735 | $1,995 | $1.15 | 24d | 1 | 1.46mi |
| 1217 Buckeye Dr Mesquite, TX | 3.0 | 2.0 | 1735 | $1,995 | $1.15 | 45d | 1 | 1.46mi |
| 2812 Clearmeadow Dr Mesquite, TX | 4.0 | 2.0 | 1837 | $2,800 | $1.52 | 0d | 1 | 1.48mi |
| 2314 Stillwater Dr Mesquite, TX | 4.0 | 2.0 | 1995 | $2,600 | $1.30 | 26d | 1 | 1.48mi |
| 2314 Stillwater Dr Mesquite, TX | 4.0 | 2.0 | 1995 | $2,600 | $1.30 | 0d | 1 | 1.48mi |
| 2208 Browning Dr Mesquite, TX | 3.0 | 2.0 | 1406 | $1,955 | $1.39 | 45d | 1 | 1.49mi |
Listing history 16 events
-
2026-06-21days on market $369,999 Active 198 DOM
-
2026-06-18days on market $369,999 Active 195 DOM
-
2026-06-17days on market $369,999 Active 194 DOM
-
2026-06-16days on market $369,999 Active 193 DOM
-
2026-06-15days on market $369,999 Active 192 DOM
-
2026-06-13days on market $369,999 Active 190 DOM
-
2026-06-13days on market $369,999 Active 189 DOM
-
2026-06-09days on market $369,999 Active 186 DOM
-
2026-06-08days on market $369,999 Active 185 DOM
-
2026-06-07days on market $369,999 Active 184 DOM
-
2026-06-04days on market $369,999 Active 181 DOM
-
2026-06-03days on market $369,999 Active 180 DOM
-
2026-06-02days on market $369,999 Active 179 DOM
-
2026-06-01days on market $369,999 Active 178 DOM
-
2026-05-31days on market $369,999 Active 177 DOM
-
2025-12-05$369,999 Active 376-char remark
Show marketing remark (376 chars)
This new single-level home is host to an inviting open floorplan with convenient access to a covered patio, ideal for seamless entertaining. Three secondary bedrooms are located off the foyer, and the luxurious owner's suite is tucked to the side of the home, complete with an en-suite bathroom and walk-in closet. A versatile flex space can be found off the main living area.
ⓘ Source: listings_history table (triggers on properties + properties_extension) + one-shot
backfill from property_details.listing_events for pre-trigger history.
Nearby sold comps map
Loading sold comps map…
Walkable amenities ~0.75 mi
Loading nearby amenities…
Taxation est. · year 1
- Rental income
- $35,673
- − Mortgage interest
- −$24,540
- − Property taxes
- −$6,572
- − Insurance
- −$2,191
- − Repairs & maintenance
- −$2,854
- − Management
- −$2,854
- − Depreciation
- −$12,745
- Taxable loss
- −$16,081
- Est. tax savings @ 24.0%
- +$3,860
- After-tax cash flow
- $-4,290/yr
For passive investors: Depreciation is non-cash, so a rental often shows a tax loss while cash-flowing — sheltering income. Rental losses are passive: they offset passive income freely, and up to $25,000/yr can offset ordinary (W-2) income if you actively participate and your MAGI is under $100k (phasing out to $0 by $150k); unused losses carry forward. On sale, claimed depreciation is recaptured at up to 25%, and gains may owe capital-gains tax (a 1031 exchange can defer both). Figures are a year-1 estimate at your 24.0% rate — not tax advice; consult a CPA.
Schools (NCES district)
- District
- Mesquite ISD
- NCES district ID
- 4830390
- Math proficiency
- 35% ▼ -11.00%
- Reading proficiency
- 32% ▼ -7.00%
- Median HH income
- $49,372
- Composite
- 29.06/100
- National rank
- #6606
- State rank
- #536 of 826 in TX
Livability — Mesquite
- Score
- 70/100
- State rank
- #358
- US rank
- #7743
Category grades
Schools grade is shown separately in the Schools card above.
Census & demographics
- Census place
- Mesquite, TX
- County
- Dallas County · 2,612,404 people
- City population
- 150,788
- Metro
- Dallas-Fort Worth-Arlington, TX
- Population (ZIP)
- 29,788
- Household income
- $111,052
- Rent vs Own
- Severe rent burden
- 857.0
Population outlook (Dallas County) Hauer SSP2
- Today (2025)
- 2,979,839 people
- By 2030
- 3,191,823 · +7.1%
- By 2040
- 3,619,611 · +21.5%
- By 2050
- 4,026,915 · +35.1%
- By 2075
- 4,957,073 · +66.4%
- By 2100
- 5,508,725 · +84.9%
Race, ethnicity, and origin ACS 2023
- Neighborhood character
- Highly diverse neighborhood (Simpson 0.71)
- Race & ethnicity
- Black 39% Hispanic / Latino 32% Two or more races 21% White 16% Asian 5% Native American 1%
- Hispanic origin (detail)
- Mexican 27% Puerto Rican 1%
- Common ancestry
- Slovak 2% Italian 1%
- Foreign-born
- 22% · Canada, Vietnam
- Languages at home
- 64% English-only · Spanish 27% Tagalog/Filipino 3% Other Asian/Pacific 1%
Political lean MEDSL · Dallas
- 2024 margin
- Strong D (+22.2) · D 60.2% · R 38.0% · Other 1.8%
- 2008→2024 swing
- +6.9pp toward D · 2008: 15.3pp · 2024: 22.2pp
- All cycles
- 2024: D+22.2 2020: D+31.6 2016: D+26.2 2012: D+15.4 2008: D+15.3
Not yet ingested
- Civics
- —
Market trends
- HPI YoY
- ▼ -26.63%
- Current HPI
- 257.0959
- Rent YoY
- ▲ 0.07%
- Metro
- Dallas-Fort Worth-Arlington, TX
- State GDP YoY
- ▲ 3.95%
- F500 in state
- 110
Industry mix (Fortune 500 HQ in TX)
| Industry | F500 HQs | Revenue |
|---|---|---|
| Energy | 16 | $1,198B |
|
||
| Technology | 5 | $198B |
|
||
| Engineering / Construction | 4 | $72B |
|
||
| Energy Services | 3 | $60B |
|
||
| Utilities | 3 | $41B |
|
||
| Healthcare | 2 | $330B |
|
||
Price history
1 event — show timeline
- 2025-12-05 Listed $369,999 Zillow
Cash-flow waterfall
monthlySold comps — $/sqft
last 12 mo · ≤1 miLoading sold comps…