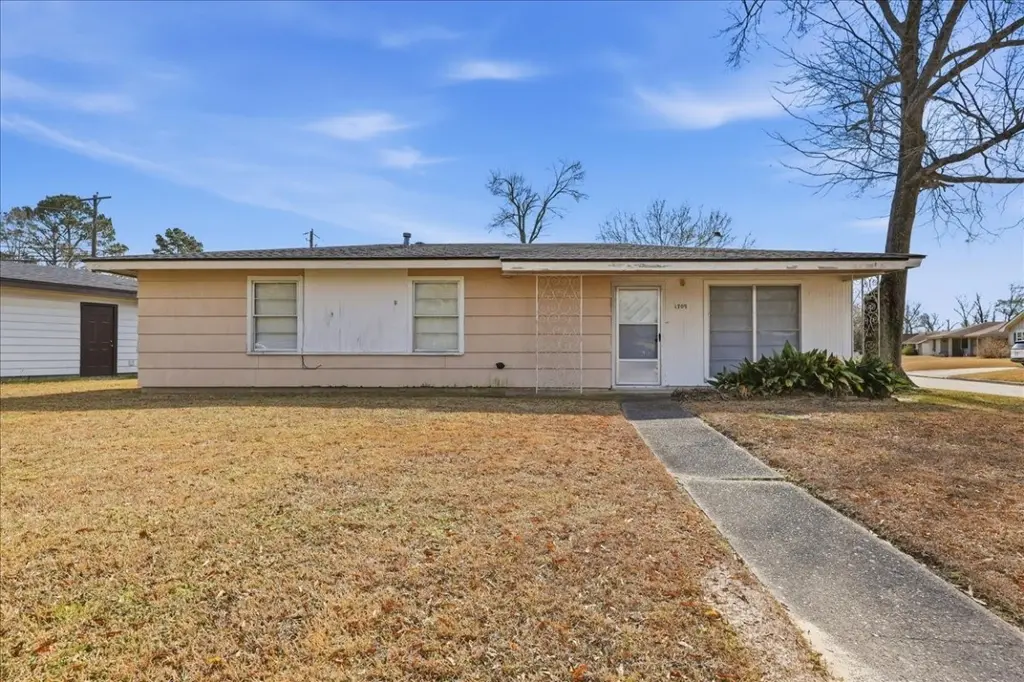
1709 Robin Ave · Orange, TX
Flood risk 5/10 · Moderate
- FEMA flood zone
- X (shaded)
- Chance of flooding over 30 yrs
- 0.26%
- Est. flood insurance / yr
- $507 – $1,088
Fire risk 3/10 · Minor
- Est. fire insurance / yr
- $1,222 – $2,270
Heat risk 9/10 · Severe
- Hot days now (above 109°F)
- 7 days/yr
- Hot days in 30 yrs
- 24 days/yr
Wind risk 9/10 · Severe
- Chance of severe wind over 30 yrs
- 99.0%
Air-quality risk 3/10 · Minor
- Unhealthy air days now
- 2 days/yr
- Unhealthy air days in 30 yrs
- 3 days/yr
Risk factors via First Street. Map © Google.
Why this score? — see what drove the B grade
The composite is a weighted blend of 9 inputs, each scored 0–100. Each bar is that input's sub-score; the figure is the points it added to the 100-point composite (weight × sub-score).
- Cash flow +28.6/30.0
- ARV discount +15.0/15.0
- DSCR +10.0/10.0
- 1% rule +8.5/10.0
- Livability +3.6/5.0
- Schools +3.3/10.0
- Rent growth +2.5/5.0
- Condition / age +2.5/5.0
- Appreciation +0.0/10.0
$109,900
🖨 Deal sheet 📄 Offer letter ✓ Due diligence
Listing remarks MLS
Great Opportunity For A 3 Bedroom, 1 1/2 Bath Home Located In LCM ISD And Nested On A Corner Lot!!! This great floor plan has wonderful potential and is ready for its next owner. The original owner lived in this home since its construction in 1958! The home features two living areas, with plenty of space for relaxing, entertaining or creating a nice home office and also offers original wood floors, a two car carport, nice storage building and a fenced yard. Come make this great listing your new home!!!
Key facts
- Fenced yard
- Two living areas
- Original wood floors
Tags
Neighborhood map
What this means for you Summary
Snapshot
- This is a 3-bed/1.5-bath single-family listed at $110k.
Deal economics
- At list price, monthly cash flow is $361 ($4k/yr) — positive.
- The deal already cash-flows at list — no discount required.
- Meets the 1% rule at list price ($1k rent vs $110k).
- Recommended offer: $97k (12.0% below list) — sets the bar for market timing.
- Cap rate 10.2% vs local median 3.9% in Orange — top-decile yield for the area; either an underpriced asset or a hidden risk that comps aren't pricing in. Stress-test before assuming the spread holds.
Location & tenants
- Location reads 71/100 on livability (#286 in TX) — a middle-class / working-renter tenant base. Strengths: cost of living A+, housing A+, health & safety A+; Watch: crime D+, employment D+, schools D-.
- Little Cypress-Mauriceville CISD (rural): math 35% / reading 40% proficiency, ranked #435 of 826 in TX (top 53%) — families likely to look elsewhere, expect single-tenant / working-renter base with shorter leases.
- Market conditions: 294 active listings in the ZIP; 12 comparable units currently listed for rent nearby; rentals at typical pace (median 14d on market — plan ~3-4 weeks tenant-placement turnaround); 235 units permitted in Orange County in 2024 (50 in 5+ unit buildings).
Forward outlook
- Local home prices are declining (-3.0%/yr); year-one equity from $760 of loan paydown is wiped out by about $3k of value loss. Plan a longer hold.
- Orange County population projected at +6% by 2050 — modest demand growth; plan on rents tracking national, not racing it.
- At projected returns (-3.0% appreciation + 3.0% rent growth), your $31k cash investment doubles in ~9 years — after that, you're playing with house money.
Negotiation context
- It's been on market 126 days — a 12% lower offer ($97k) is reasonable based on typical stale-listing flexibility.
- 2 sale attempts; this cycle's ask has dropped $15k (12%) from the opening price — seller is motivated, your offer sets the floor, not the list.
Risks & watch-outs
- Watch-outs: built in 1958 — expect roof / HVAC / electrical / plumbing capex.
- Climate carrying-cost: moderate flood risk; severe wind risk, 99% chance of damaging wind over 30y; extreme-heat days projected 7→24/yr by 2055 (HVAC capex compounding) — expect insurance premiums to compound above CPI over the hold.
Questions for the listing agent
- It's been on market 126 days. Have you received any prior offers? Is the seller open to a 12% concession, seller financing, or rate buy-down credit?
- Built in 1958 — when were the roof, HVAC, electrical panel, plumbing, and water heater last replaced?
- Why hasn't it sold? Are there any deal-killer items the seller is aware of (foundation, flood, title, zoning, code violations)?
- Is there a deadline driving the sale (1031 exchange, divorce, estate, relocation)? That informs how much negotiation room exists.
- Schools are D-rated, which usually means shorter tenancies and higher turnover. Who's the typical renter profile here, and what's been the actual vacancy rate?
- Crime grade is D in this area — have there been break-ins, vandalism, or insurance claims at this property in the last 3 years? What carrier currently insures it and at what premium?
- What's the average days-on-market for RENTAL listings here right now (not sales)? A rising rental-DOM trend means longer vacancies and softer asking-rent achievability than the comps imply.
- What's the recent tenant-quality profile in this submarket — average credit score on applications, eviction rate, late-payment / NSF rate, and stable-employment percentage? A property-management company in the area should have these aggregated.
- How much new for-sale + rental construction is in the pipeline within 1–3 miles? Heavy new supply typically softens prices + rents 12–24 months out; constrained supply supports both.
Investment metrics
- 1% rule
- 1.35% ✓
- Cap rate
- 10.24%
- Cash-on-cash
- 14.08%
- DSCR
- 1.63
- GRM
- 6.2
CMA / ARV
- ARV (median comp)
- $153,741
- List price
- $109,900
- Delta
- -28.52%
- Verdict
- UNDERPRICED
- Comps
- 18 within 1.0 mi
Show comp detail 4 sales within ~0.75 mi
| Address | Dist | Beds/Ba | Sqft | Sold | Price | $/sf | Match |
|---|---|---|---|---|---|---|---|
| 1701 Robin | 0.01mi | 3/1.0 | 1,225 (-9%) | 11mo | $167,000 | $136 | 74 |
| 1833 W Decker Ave | 0.18mi | 3/1.5 | 1,183 (-12%) | 2mo | $169,900 | $144 | 70 |
| 1908 Maple | 0.16mi | 3/1.5 | 1,202 (-11%) | 11mo | $159,900 | $133 | 66 |
| 2049 Wildwood Ave | 0.22mi | 3/2.0 | 1,424 (+6%) | 18mo | $175,000 | $123 | 63 |
Match score weights: distance 35% · size 25% · config 20% · recency 20%. Top-matched comps best support the ARV.
Projected returns pro-forma
-3.0% appreciation · 3.0% rent growth · sell at horizon
- IRR
- 4.4%
- Equity multiple
- 1.17×
- Total profit
- $5,246
- Equity at exit
- $16,386
- IRR
- 13.9%
- Equity multiple
- 2.12×
- Total profit
- $34,398
- Equity at exit
- $9,502
Cash invested: $30,772 (down + closing). Projections, not guarantees.
Landlord ↔ Tenant lean methodology
- Overall (STATE)
- 87 Strongly Landlord-Friendly
- State Texas
- 87 Strongly Landlord-Friendly · R+5
- County
- — inherits STATE
- City
- — inherits STATE
ZIP-level market 77632
- Home prices YoY
- -31.6%
- Active inventory
- 294
- Price-to-rent
- 6.2×
Monthly cashflow live
- Estimated rent
- $1,478 high interval (Pro) →
- Mortgage (P&I)
- −$576
- Tax from tax record
- −$185 /mo · $2,215/yr
- Insurance
- −$46
- HOA
- −$0
- Vacancy / Maint / Mgmt
- −$310
- Net cashflow
- $361
Break-even live
UW: 25.0% down · 7.5% · 30yr · 1.5% tax · 5.0% vac · 8.0% maint · 8.0% mgmt
Financing live
Cash to close
- Down payment
- $27,475
- Closing costs
- $3,297
- Reserves months
- —
- Total cash needed
- —
Loan-product check · same deal, 3 products live
Conventional
25% down · 7.5% · 30yr
- Down + closing
- —
- Monthly P&I
- —
- Monthly cashflow
- —
- DSCR
- —
- Eligible?
- —
Personal DTI + credit; lowest rate.
DSCR
20% down · 8.5% · 30yr
- Down + closing
- —
- Monthly P&I
- —
- Monthly cashflow
- —
- DSCR
- —
- Eligible?
- —
No personal income docs; deal must DSCR.
Hard money
10% down · 12.0% · 12mo
- Down + closing
- —
- Monthly P&I
- —
- Monthly cashflow
- —
- DSCR
- —
- Eligible?
- —
Short-term bridge; refi at stabilization.
Rent comps 12 comps
| Address | Beds | Baths | Sqft | Rent | $/sqft | DOM | Units | Dist |
|---|---|---|---|---|---|---|---|---|
| 3901 Beverly Ave Orange, TX | 3.0 | 2.0 | 1359 | $1,500 | $1.10 | 14d | 1 | 0.13mi |
| 1907 Walnut Ave Orange, TX | 3.0 | 1.5 | 1360 | $1,475 | $1.08 | 14d | 1 | 0.21mi |
| 4417 Willowglen St Orange, TX | 3.0 | 2.0 | 1658 | $1,650 | $1.00 | 14d | 1 | 0.27mi |
| 1019 Ruby Ln Orange, TX | 2.0 | 1.0 | 1243 | $1,100 | $0.88 | 14d | 1 | 0.88mi |
| 1030 Clairmont Dr Orange, TX | 3.0 | 2.0 | 1372 | $1,850 | $1.35 | 21d | 1 | 0.93mi |
| 9 W Eads Ave Orange, TX | 3.0 | 2.0 | 1255 | $1,400 | $1.12 | 44d | 1 | 0.94mi |
| 2208 Monterrey Dr Orange, TX | 3.0 | 1.0 | 1132 | $1,200 | $1.06 | 44d | 1 | 0.94mi |
| 3 Pacific Cir Orange, TX | 4.0 | 1.0 | 1361 | $1,500 | $1.10 | 21d | 1 | 1.03mi |
| 2309 7th St Orange, TX | 3.0 | 1.0 | 1036 | $995 | $0.96 | 14d | 1 | 1.07mi |
| 1205 Wrenway Orange, TX | 4.0 | 2.0 | 1551 | $1,775 | $1.14 | 14d | 1 | 1.32mi |
| 2801 W Sunset Dr Orange, TX | 1.0–3.0 | 1.0–2.0 | 1113 | $1,400 | $1.26 | 13d | 27 | 1.38mi |
| 1500 Link Ave Orange, TX | 1.0–2.0 | 1.0–1.5 | 1082 | $1,050 | $0.97 | 13d | 1 | 1.44mi |
Listing history 21 events
-
2026-06-18days on market $109,900 Active 126 DOM
-
2026-06-17days on market $109,900 Active 125 DOM
-
2026-06-16days on market $109,900 Active 124 DOM
-
2026-06-15days on market $109,900 Active 123 DOM
-
2026-06-14days on market $109,900 Active 121 DOM
-
2026-06-13pricedays on market $109,900 Active 120 DOM
-
2026-06-10days on market $114,900 Active 118 DOM
-
2026-06-09days on market $114,900 Active 117 DOM
-
2026-06-08days on market $114,900 Active 116 DOM
-
2026-06-07days on market $114,900 Active 115 DOM
-
2026-06-03days on market $114,900 Active 111 DOM
-
2026-06-02days on market $114,900 Active 110 DOM
-
2026-06-01days on market $114,900 Active 109 DOM
-
2026-05-31days on market $114,900 Active 108 DOM
-
2026-05-30days on market $114,900 Active 107 DOM
-
2026-05-06price $114,900 509-char remark
Show marketing remark (507 chars)
Great Opportunity For A 3 Bedroom, 1 1/2 Bath Home Located In LCM ISD And Nested On A Corner Lot!!! This great floor plan has wonderful potential and is ready for its next owner. The original owner lived in this home since its construction in 1958! The home features two living areas, with plenty of space for relaxing, entertaining or creating a nice home office and also offers original wood floors, a two car carport, nice storage building and a fenced yard. Come make this great listing your new home!!!
-
2026-05-06price $114,900 507-char remark
Show marketing remark (507 chars)
Great Opportunity For A 3 Bedroom, 1 1/2 Bath Home Located In LCM ISD And Nested On A Corner Lot!!! This great floor plan has wonderful potential and is ready for its next owner. The original owner lived in this home since its construction in 1958! The home features two living areas, with plenty of space for relaxing, entertaining or creating a nice home office and also offers original wood floors, a two car carport, nice storage building and a fenced yard. Come make this great listing your new home!!!
-
2026-03-31price $119,900 507-char remark
Show marketing remark (509 chars)
Great Opportunity For A 3 Bedroom, 1 1/2 Bath Home Located In LCM ISD And Nested On A Corner Lot!!! This great floor plan has wonderful potential and is ready for its next owner. The original owner lived in this home since its construction in 1958! The home features two living areas, with plenty of space for relaxing, entertaining or creating a nice home office and also offers original wood floors, a two car carport, nice storage building and a fenced yard. Come make this great listing your new home!!!
-
2026-03-31price $119,900 509-char remark
Show marketing remark (509 chars)
Great Opportunity For A 3 Bedroom, 1 1/2 Bath Home Located In LCM ISD And Nested On A Corner Lot!!! This great floor plan has wonderful potential and is ready for its next owner. The original owner lived in this home since its construction in 1958! The home features two living areas, with plenty of space for relaxing, entertaining or creating a nice home office and also offers original wood floors, a two car carport, nice storage building and a fenced yard. Come make this great listing your new home!!!
-
2026-02-12$124,900 Active 509-char remark
Show marketing remark (507 chars)
Great Opportunity For A 3 Bedroom, 1 1/2 Bath Home Located In LCM ISD And Nested On A Corner Lot!!! This great floor plan has wonderful potential and is ready for its next owner. The original owner lived in this home since its construction in 1958! The home features two living areas, with plenty of space for relaxing, entertaining or creating a nice home office and also offers original wood floors, a two car carport, nice storage building and a fenced yard. Come make this great listing your new home!!!
-
2026-02-12$124,900 Active 507-char remark
Show marketing remark (507 chars)
Great Opportunity For A 3 Bedroom, 1 1/2 Bath Home Located In LCM ISD And Nested On A Corner Lot!!! This great floor plan has wonderful potential and is ready for its next owner. The original owner lived in this home since its construction in 1958! The home features two living areas, with plenty of space for relaxing, entertaining or creating a nice home office and also offers original wood floors, a two car carport, nice storage building and a fenced yard. Come make this great listing your new home!!!
ⓘ Source: listings_history table (triggers on properties + properties_extension) + one-shot
backfill from property_details.listing_events for pre-trigger history.
Tax reassessment forecast TX · Resets to sale price
- Current annual tax
- $2,215 · $185/mo
- Projected year-2 tax
- $2,215 · $185/mo
- Expected delta
- $0/yr ($0/mo · 0.0%)
ⓘ Screening estimate from a state-policy table — verify with the county assessor before closing.
Climate risk First Street
- Flood 5/10 Major FEMA zone X (shaded) · 26% chance over 30 yrs
- Wildfire 3/10 Moderate
- Heat 9/10 Extreme 7 d/yr ≥109°F today · 24 d/yr by 30 yrs out
- Wind 9/10 Extreme 99% chance of damaging wind over 30 yrs
- Air quality 3/10 Moderate 2 unhealthy d/yr today · 3 by 30 yrs out
Nearby sold comps map
Loading sold comps map…
Walkable amenities ~0.75 mi
Loading nearby amenities…
Taxation est. · year 1
- Rental income
- $17,740
- − Mortgage interest
- −$6,156
- − Property taxes
- −$2,215
- − Insurance
- −$550
- − Repairs & maintenance
- −$1,419
- − Management
- −$1,419
- − Depreciation
- −$3,197
- Taxable income
- $2,784
- Est. tax owed @ 24.0%
- −$668
- After-tax cash flow
- $3,666/yr
For passive investors: Depreciation is non-cash, so a rental often shows a tax loss while cash-flowing — sheltering income. Rental losses are passive: they offset passive income freely, and up to $25,000/yr can offset ordinary (W-2) income if you actively participate and your MAGI is under $100k (phasing out to $0 by $150k); unused losses carry forward. On sale, claimed depreciation is recaptured at up to 25%, and gains may owe capital-gains tax (a 1031 exchange can defer both). Figures are a year-1 estimate at your 24.0% rate — not tax advice; consult a CPA.
Schools (NCES district)
- District
- Little Cypress-Mauriceville CISD
- NCES district ID
- 4827690
- Math proficiency
- 35% ▼ -5.00%
- Reading proficiency
- 40% ▲ 1.00%
- Median HH income
- $60,483
- Composite
- 33.41/100
- National rank
- #5473
- State rank
- #435 of 826 in TX
Livability — Orange
- Score
- 71/100
- State rank
- #286
- US rank
- #6456
Category grades
Schools grade is shown separately in the Schools card above.
Census & demographics
- Census place
- Orange, TX
- County
- Orange County · 87,112 people
- City population
- 22,976
- Metro
- Beaumont-Port Arthur, TX
- Population (ZIP)
- 22,976
- Household income
- $74,418
- Rent vs Own
- Severe rent burden
- 431.0
Population outlook (Orange County) Hauer SSP2
- Today (2025)
- 88,065 people
- By 2030
- 89,591 · +1.7%
- By 2040
- 91,982 · +4.4%
- By 2050
- 93,023 · +5.6%
- By 2075
- 94,871 · +7.7%
- By 2100
- 88,155 · +0.1%
Race, ethnicity, and origin ACS 2023
- Neighborhood character
- Predominantly White (85%)
- Race & ethnicity
- White 85% Hispanic / Latino 8% Two or more races 6% Black 4%
- Hispanic origin (detail)
- Mexican 6%
- Common ancestry
- Lithuanian 8% Slovak 2% Italian 2%
- Foreign-born
- 2% · Canada
- Languages at home
- 95% English-only · Spanish 4%
Political lean MEDSL · Orange
- 2024 margin
- Solid R (+66.8) · D 16.4% · R 83.1%
- 2008→2024 swing
- -19.6pp toward R · 2008: -47.1pp · 2024: -66.8pp
- All cycles
- 2024: R+66.8 2020: R+63.4 2016: R+61.9 2012: R+54.3 2008: R+47.1
Not yet ingested
- Civics
- —
Market trends
- HPI YoY
- ▼ -68.96%
- Current HPI
- 149.354
- Rent YoY
- —
- Metro
- Beaumont-Port Arthur, TX
- State GDP YoY
- ▲ 3.95%
- F500 in state
- 110
Industry mix (Fortune 500 HQ in TX)
| Industry | F500 HQs | Revenue |
|---|---|---|
| Energy | 16 | $1,198B |
|
||
| Technology | 5 | $198B |
|
||
| Engineering / Construction | 4 | $72B |
|
||
| Energy Services | 3 | $60B |
|
||
| Utilities | 3 | $41B |
|
||
| Healthcare | 2 | $330B |
|
||
Price history
-8.0% since first listed6 events — show timeline
- 2026-05-06 Price Changed $114,900 BBOR
- 2026-05-06 Price Changed $114,900 HARMLS
- 2026-03-31 Price Changed $119,900 HARMLS
- 2026-03-31 Price Changed $119,900 BBOR
- 2026-02-12 Listed $124,900 HARMLS
- 2026-02-12 Listed $124,900 BBOR
Property tax history
+0.2%/yrLatest (2025): $2,215 · +0.9% YoY. Source: county tax records.
Cash-flow waterfall
monthlySold comps — $/sqft
last 12 mo · ≤1 miLoading sold comps…