3800 S Ocean Dr #409 · Hollywood, FL
Flood risk 10/10 · Severe
- FEMA flood zone
- AE
- Chance of flooding over 30 yrs
- 0.99%
- Est. flood insurance / yr
- $1,737 – $8,500
Fire risk 1/10 · Minimal
- Est. fire insurance / yr
- $947 – $1,759
Heat risk 10/10 · Severe
- Hot days now (above 104°F)
- 6 days/yr
- Hot days in 30 yrs
- 20 days/yr
Wind risk 10/10 · Severe
- Chance of severe wind over 30 yrs
- 99.0%
Air-quality risk 2/10 · Minimal
- Unhealthy air days now
- 1 days/yr
- Unhealthy air days in 30 yrs
- 2 days/yr
Risk factors via First Street. Map © Google.
Why this score? — see what drove the C+ grade
The composite is a weighted blend of 9 inputs, each scored 0–100. Each bar is that input's sub-score; the figure is the points it added to the 100-point composite (weight × sub-score).
- Cash flow +24.7/30.0
- 1% rule +10.0/10.0
- DSCR +8.0/10.0
- ARV discount +7.5/15.0
- Schools +4.1/10.0
- Livability +3.8/5.0
- Rent growth +3.2/5.0
- Condition / age +2.5/5.0
- Appreciation +0.0/10.0
$264,000
🖨 Deal sheet 📄 Offer letter ✓ Due diligence
Listing remarks
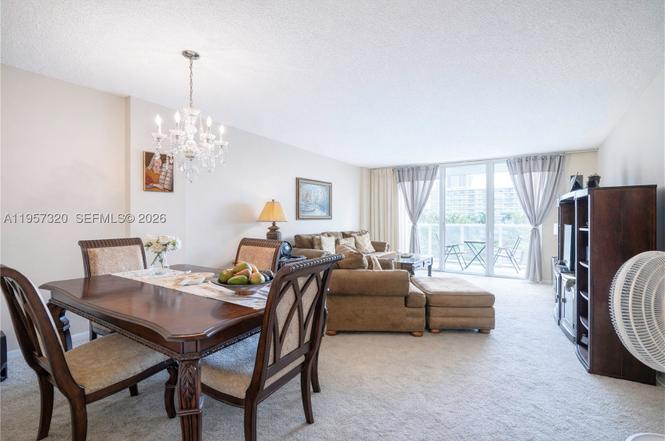
Spacious 1-bedroom, 1.5-bath residence at the desirable Hallmark of Hollywood, ideally located at 3800 S Ocean Dr. This south-facing unit offers pleasant views of the pool area and the Intracoastal Waterway, with abundant natural light throughout the day. The condo features a new A/C system and water Heater, new carpet throughout, and a kitchen updated. The bathrooms are original and offer a great opportunity for customization. 1 assigned garage parking space is included. The Hallmark is a full-service, amenity-rich community offering 24-hour security, a heated pool, fitness center, library, card and social rooms, and courtesy bus service. Ideally located across from the beach with easy acc
Key facts
- New a c system
- Pleasant views
- New carpet
Tags
Property features AI
Finance
- Financial info: Pets not allowed
- HOA & community: Monthly association fee; Association covers management, amenities, cable TV, HVAC, insurance, internet, laundry, structure maintenance, pest control, sewer, security, trash and water; Community amenities include billiard room, clubhouse, elevators, fitness center, laundry, pool, sauna, storage, trash service, transportation service and vehicle wash area
Exterior
- Parking: Assigned covered parking; Attached garage (1 space)
- Security: Doorman; Secured garage/parking
- Utilities: Cable available
- Home design: Condominium / attached property; Faces south; Entry on level 4; 18-story building
- Construction: Block construction
- Exterior features: Balcony (open); Heated pool; Intracoastal access; Is waterfront
Interior
- Kitchen: Dishwasher; Electric range; Refrigerator
- Bedrooms: Bedroom on main level
- Flooring: Carpet; Ceramic tile
- Bathrooms: 1 full bathroom; 1 half bathroom
- Heating & cooling: Central heating; Central air conditioning
- Interior features: Furnished; Entrance foyer; Eat-in kitchen; Living/dining room; Tub with shower; Walk-in closet(s)
- Laundry & utility: Common area laundry
Neighborhood map
What this means for you Summary
Snapshot
- This is a 1-bed/2.0-bath condo listed at $264k.
Deal economics
- At list price, monthly cash flow is $127 ($2k/yr) — positive.
- The deal already cash-flows at list — no discount required.
- Meets the 1% rule at list price ($4k rent vs $264k).
- Recommended offer: $232k (12.0% below list) — sets the bar for market timing.
- Cap rate 8.8% vs local median 3.2% in Hollywood — top-decile yield for the area; either an underpriced asset or a hidden risk that comps aren't pricing in. Stress-test before assuming the spread holds.
Location & tenants
- Location reads 76/100 on livability (#232 in FL, #3,548 nationally) — a middle-class / working-renter tenant base. Strengths: commute A+, housing A+, crime B+; Watch: amenities D.
- Broward (suburban): math 42% / reading 53% proficiency, ranked #46 of 73 in FL (top 63%) — families likely to look elsewhere, expect single-tenant / working-renter base with shorter leases.
- Market conditions: Rents rising (+2.9%/yr); 828 active listings in the ZIP; 40 comparable units currently listed for rent nearby; rentals at typical pace (median 22d on market — plan ~3-4 weeks tenant-placement turnaround); solid renter incomes; 2,111 units permitted in Broward County in 2024 (1,265 in 5+ unit buildings).
- At $4,197/mo this rent would consume 52% of the median local household income ($96k/yr) (locally 563% of renters already pay >50% of income on rent) — very limited rent-growth headroom before tenants either downsize or default.
Forward outlook
- Local home prices are declining (-3.0%/yr); year-one equity from $2k of loan paydown is wiped out by about $8k of value loss. Plan a longer hold.
- Broward County population projected at +34% by 2050 — long-run rental-demand tailwind backs the buy-and-hold thesis.
Negotiation context
- It's been on market 135 days — a 12% lower offer ($232k) is reasonable based on typical stale-listing flexibility.
- 9 sale attempts since 5y ago; this cycle's ask is 16400% above the opening price — seller raised mid-cycle; expect resistance to lowballs.
- Current owner paid $65k; list at $264k implies a 306% gain — meaningful room to come down on a strong offer.
Risks & watch-outs
- Watch-outs: flood insurance adds $427/mo.
- Climate carrying-cost: in FEMA flood zone AE (mandatory federal flood insurance); severe wind risk, 99% chance of damaging wind over 30y; extreme-heat days projected 6→20/yr by 2055 (HVAC capex compounding) — expect insurance premiums to compound above CPI over the hold.
Questions for the listing agent
- It's been on market 135 days. Have you received any prior offers? Is the seller open to a 12% concession, seller financing, or rate buy-down credit?
- What's the actual annual flood-insurance premium (NFIP or private), and is the property in a SFHA with mandatory coverage?
- What does the HOA fee cover, when was the last increase, and are there any pending special assessments or reserve-fund shortfalls?
- Any open or pending special assessments — roof, HVAC, plumbing, elevator, façade? What's the per-unit balance and payoff schedule, and is the seller paying it off at close or rolling it to the buyer?
- Why hasn't it sold? Are there any deal-killer items the seller is aware of (foundation, flood, title, zoning, code violations)?
- Is there a deadline driving the sale (1031 exchange, divorce, estate, relocation)? That informs how much negotiation room exists.
- What's the average days-on-market for RENTAL listings here right now (not sales)? A rising rental-DOM trend means longer vacancies and softer asking-rent achievability than the comps imply.
- What's the recent tenant-quality profile in this submarket — average credit score on applications, eviction rate, late-payment / NSF rate, and stable-employment percentage? A property-management company in the area should have these aggregated.
- How much new apartment / multifamily construction is in the pipeline within 1–3 miles? Heavy new supply (>2% of stock underway) typically softens rents 12–24 months out; light construction supports rent growth.
Investment metrics
- 1% rule
- 1.59% ✓
- Cap rate
- 8.81%
- Cash-on-cash
- 8.98%
- DSCR
- 1.40
- GRM
- 5.2
CMA / ARV
No comps found within radius.
Projected returns pro-forma
-3.0% appreciation · 2.92% rent growth · sell at horizon
- IRR
- -12.8%
- Equity multiple
- 0.54×
- Total profit
- $-34,144
- Equity at exit
- $39,363
- IRR
- -3.4%
- Equity multiple
- 0.77×
- Total profit
- $-17,058
- Equity at exit
- $22,826
Cash invested: $73,920 (down + closing). Projections, not guarantees.
Landlord ↔ Tenant lean methodology
- Overall (STATE)
- 87 Strongly Landlord-Friendly
- State Florida
- 87 Strongly Landlord-Friendly · R+3
- County
- — inherits STATE
- City
- — inherits STATE
ZIP-level market 33019
- Rents YoY
- 2.9%
- Active inventory
- 828
- Price-to-rent
- 5.2×
Monthly cashflow live
- Estimated rent
- $4,197 high interval (Pro) →
- Mortgage (P&I)
- −$1,384
- Tax from tax record
- −$436 /mo · $5,229/yr
- Insurance
- −$110
- Flood insurance flood zone
- −$427 /mo · $5,118/yr
- HOA
- −$832
- Vacancy / Maint / Mgmt
- −$881
- Net cashflow
- $127
Break-even live
UW: 25.0% down · 7.5% · 30yr · 1.5% tax · 5.0% vac · 8.0% maint · 8.0% mgmt
Financing live
Cash to close
- Down payment
- $66,000
- Closing costs
- $7,920
- Reserves months
- —
- Total cash needed
- —
Loan-product check · same deal, 3 products live
Conventional
25% down · 7.5% · 30yr
- Down + closing
- —
- Monthly P&I
- —
- Monthly cashflow
- —
- DSCR
- —
- Eligible?
- —
Personal DTI + credit; lowest rate.
DSCR
20% down · 8.5% · 30yr
- Down + closing
- —
- Monthly P&I
- —
- Monthly cashflow
- —
- DSCR
- —
- Eligible?
- —
No personal income docs; deal must DSCR.
Hard money
10% down · 12.0% · 12mo
- Down + closing
- —
- Monthly P&I
- —
- Monthly cashflow
- —
- DSCR
- —
- Eligible?
- —
Short-term bridge; refi at stabilization.
Rent comps 40 comps
| Address | Beds | Baths | Sqft | Rent | $/sqft | DOM | Units | Dist |
|---|---|---|---|---|---|---|---|---|
| 3901 S Ocean Dr Unit 11M Hollywood, FL | 1.0 | 1.0 | 874 | $4,400 | $5.03 | 24d | 1 | 0.12mi |
| 3901 S Ocean Dr Unit 10M Hollywood, FL | 1.0 | 1.0 | 874 | $5,000 | $5.72 | 24d | 1 | 0.12mi |
| 3901 S Ocean Dr Unit 10Z Hollywood, FL | 1.0 | 1.0 | 874 | $4,000 | $4.58 | 24d | 1 | 0.12mi |
| 3901 S Ocean Dr Unit 10Z Hollywood, FL | 1.0 | 1.0 | 874 | $4,000 | $4.58 | 3d | 1 | 0.12mi |
| 3901 S Ocean Dr Unit 1227197P Hollywood, FL | 1.0–2.0 | 1.0–2.0 | 1054 | $2,727 | $2.59 | 1d | 2 | 0.12mi |
| 3901 S Ocean Dr Unit 11M Hollywood, FL | 1.0 | 1.0 | 874 | $4,400 | $5.03 | 3d | 1 | 0.12mi |
| 3801 S Ocean Dr Unit 4R Hollywood, FL | 1.0 | 1.0 | 812 | $3,850 | $4.74 | 24d | 1 | 0.13mi |
| 4010 S Ocean Dr Unit T3509 Hollywood, FL | 2.0 | 2.0 | 1060 | $6,000 | $5.66 | 22d | 1 | 0.13mi |
| 4010 S Ocean Dr Unit T3609 Hollywood, FL | 2.0 | 2.0 | 1060 | $6,300 | $5.94 | 3d | 1 | 0.13mi |
| 4010 S Ocean Dr Unit 1388506P Hollywood, FL | 2.0 | 2.0 | 1097 | $4,881 | $4.45 | 7d | 1 | 0.13mi |
| 4010 S Ocean Dr Unit T3609 Hollywood, FL | 2.0 | 2.0 | 1060 | $6,300 | $5.94 | 24d | 1 | 0.13mi |
| 4010 S Ocean Dr Unit R2102 Hollywood, FL | 2.0 | 2.0 | 1075 | $6,500 | $6.05 | 24d | 1 | 0.13mi |
| 4010 S Ocean Dr Unit 1227485P Hollywood, FL | 2.0–3.0 | 2.0 | 1118 | $5,049 | $4.51 | 15d | 2 | 0.13mi |
| 3725 S Ocean Dr Hollywood, FL | 2.0–3.0 | 2.0 | 1377 | $4,000 | $2.90 | 2d | 7 | 0.14mi |
| 3725 S Ocean Dr Hollywood, FL | 2.0–3.0 | 2.0 | 1377 | $4,000 | $2.90 | 14d | 8 | 0.14mi |
| 4001 S Ocean Dr Hollywood, FL | 2.0–3.0 | 1.5–3.0 | 1471 | $4,800 | $3.26 | 24d | 3 | 0.14mi |
| 4001 S Ocean Dr Hollywood, FL | 2.0–3.0 | 1.5–3.0 | 1471 | $4,000 | $2.72 | 22d | 4 | 0.14mi |
| 4010 S Ocean Dr Hollywood, FL | 1.0–3.0 | 1.0–3.5 | 1078 | $5,000 | $4.64 | 24d | 5 | 0.14mi |
| 2721 E Hallandale Beach Blvd Unit 1049818P Hollywood, FL | 1.0–2.0 | 1.0–2.0 | 946 | $3,355 | $3.54 | 3d | 2 | 0.17mi |
| 4111 S Ocean Dr #1810 Hollywood, FL | 1.0 | 1.0 | 1000 | $5,500 | $5.50 | 24d | 1 | 0.17mi |
| 4111 S Ocean Dr Unit 1557596P Hollywood, FL | 1.0 | 1.0 | 796 | $5,356 | $6.73 | 7d | 1 | 0.17mi |
| 4111 S Ocean Dr Unit 1022181P Hollywood, FL | 1.0–2.0 | 1.0–2.0 | 968 | $4,407 | $4.55 | 16d | 2 | 0.17mi |
| 1800 S Ocean Dr #909 Hallandale Beach, FL | 2.0 | 1.0 | 1086 | $4,000 | $3.68 | 24d | 1 | 0.25mi |
| 1800 S Ocean Dr #4209 Hallandale Beach, FL | 2.0 | 1.0 | 1086 | $4,000 | $3.68 | 20d | 1 | 0.25mi |
| 1800 S Ocean Dr #4209 Hallandale Beach, FL | 2.0 | 1.0 | 1086 | $4,000 | $3.68 | 1d | 1 | 0.25mi |
| 2600 E Hallandale Beach Blvd Unit T3110 Hallandale Beach, FL | 2.0 | 2.0 | 1028 | $3,650 | $3.55 | 24d | 1 | 0.27mi |
| 2600 E Hallandale Beach Blvd Unit T3208 Hallandale Beach, FL | 2.0 | 2.0 | 1030 | $6,950 | $6.75 | 24d | 1 | 0.27mi |
| 2600 E Hallandale Beach Blvd Unit T3307 Hallandale Beach, FL | 2.0 | 2.0 | 1030 | $4,500 | $4.37 | 24d | 1 | 0.27mi |
| 2601 E Hallandale Beach Blvd Unit 1227344P Hallandale Beach, FL | 1.0–2.0 | 1.0–2.0 | 844 | $2,465 | $2.92 | 1d | 2 | 0.27mi |
| 2602 E Hallandale Beach Blvd Hallandale Beach, FL | 1.0–2.0 | 1.0–2.0 | 1092 | $4,750 | $4.35 | 24d | 3 | 0.28mi |
| 2602 E Hallandale Beach Blvd Hallandale Beach, FL | 1.0–2.0 | 1.0–2.0 | 1070 | $4,219 | $3.94 | 20d | 4 | 0.28mi |
| 2602 E Hallandale Beach Blvd Hallandale Beach, FL | 3.0 | 1.0–3.0 | 1011 | $3,862 | $3.82 | 1d | 5 | 0.28mi |
| 1830 S Ocean Dr #3407 Hallandale Beach, FL | 1.0 | 1.0 | 871 | $4,000 | $4.59 | 24d | 1 | 0.30mi |
| 1830 S Ocean Dr #2412 Hallandale Beach, FL | 1.0 | 1.0 | 844 | $3,600 | $4.27 | 10d | 1 | 0.30mi |
| 1830 S Ocean Dr #2409 Hallandale Beach, FL | 1.0 | 1.0 | 844 | $4,300 | $5.09 | 14d | 1 | 0.30mi |
| 1830 S Ocean Dr #1709 Hallandale Beach, FL | 1.0 | 1.0 | 844 | $4,500 | $5.33 | 24d | 1 | 0.30mi |
| 1830 S Ocean Dr #4005 Hallandale Beach, FL | 1.0 | 1.0 | 811 | $4,600 | $5.67 | 24d | 1 | 0.30mi |
| 1830 S Ocean Dr #1812 Hallandale Beach, FL | 1.0 | 1.0 | 844 | $4,999 | $5.92 | 20d | 1 | 0.30mi |
| 1830 S Ocean Dr #4612 Hallandale Beach, FL | 1.0 | 1.0 | 844 | $4,950 | $5.86 | 24d | 1 | 0.30mi |
| 1830 S Ocean Dr #1107 Hallandale Beach, FL | 1.0 | 1.0 | 871 | $3,750 | $4.31 | 24d | 1 | 0.30mi |
HOA detail condo
- Monthly dues
- $832 · $9,984/yr
- Likely covers
- waterpoolgymsecurity
- Assessments
- None detected in remarks — confirm with the listing agent.
Listing history 38 events
-
2026-06-18days on market $264,000 Active 135 DOM
-
2026-06-17days on market $264,000 Active 134 DOM
-
2026-06-16days on market $264,000 Active 133 DOM
-
2026-06-15days on market $264,000 Active 132 DOM
-
2026-06-13days on market $264,000 Active 130 DOM
-
2026-06-09days on market $264,000 Active 126 DOM
-
2026-06-07days on market $264,000 Active 124 DOM
-
2026-06-04days on market $264,000 Active 121 DOM
-
2026-06-03days on market $264,000 Active 120 DOM
-
2026-06-02days on market $264,000 Active 119 DOM
-
2026-06-01days on market $264,000 Active 118 DOM
-
2026-05-31days on market $264,000 Active 117 DOM
-
2026-05-05$1,600
-
2026-04-17historical $1,600
-
2026-04-15price $1,600
-
2026-04-14$1,699
-
2026-03-25price $264,000
-
2026-01-29$279,000 Active
-
2025-05-16historical $1,500
-
2025-05-15price $1,500
-
2025-05-02$1,700
-
2024-02-22historical
-
2024-02-08$295,000 Active
-
2024-01-09price $295,000
-
2023-12-03price $315,000
-
2023-11-07$329,000 Active
-
2023-03-02historical
-
2023-02-10price $289,000
-
2022-12-15price $309,000
-
2022-12-14price $319,000
-
2022-11-30$329,000 Active
-
2021-08-12historical
-
2021-06-28$249,900 Active
-
2021-04-02historical
-
2021-01-31price $249,000
-
2021-01-31$249 Active
-
1992-01-21soldstatus $65,000
-
1982-04-01soldstatus $60,000
ⓘ Source: listings_history table (triggers on properties + properties_extension) + one-shot
backfill from property_details.listing_events for pre-trigger history.
Tax reassessment forecast FL · Resets to sale price
- Current annual tax
- $5,229 · $436/mo
- Projected year-2 tax
- $5,229 · $436/mo
- Expected delta
- $0/yr ($0/mo · 0.0%)
ⓘ Screening estimate from a state-policy table — verify with the county assessor before closing.
Climate risk First Street
- Flood 10/10 Extreme FEMA zone AE · 99% chance over 30 yrs
- Wildfire 1/10 Low
- Heat 10/10 Extreme 6 d/yr ≥104°F today · 20 d/yr by 30 yrs out
- Wind 10/10 Extreme 99% chance of damaging wind over 30 yrs
- Air quality 2/10 Low 1 unhealthy d/yr today · 2 by 30 yrs out
Nearby sold comps map
Loading sold comps map…
Walkable amenities ~0.75 mi
Loading nearby amenities…
Taxation est. · year 1
- Rental income
- $50,361
- − Mortgage interest
- −$14,788
- − Property taxes
- −$5,229
- − Insurance
- −$6,439
- − Repairs & maintenance
- −$4,029
- − Management
- −$4,029
- − HOA
- −$9,984
- − Depreciation
- −$7,680
- Taxable loss
- −$1,816
- Est. tax savings @ 24.0%
- +$436
- After-tax cash flow
- $1,957/yr
For passive investors: Depreciation is non-cash, so a rental often shows a tax loss while cash-flowing — sheltering income. Rental losses are passive: they offset passive income freely, and up to $25,000/yr can offset ordinary (W-2) income if you actively participate and your MAGI is under $100k (phasing out to $0 by $150k); unused losses carry forward. On sale, claimed depreciation is recaptured at up to 25%, and gains may owe capital-gains tax (a 1031 exchange can defer both). Figures are a year-1 estimate at your 24.0% rate — not tax advice; consult a CPA.
Schools (NCES district)
- District
- Broward
- NCES district ID
- 1200180
- Math proficiency
- 42% ▼ -18.00%
- Reading proficiency
- 53% ▼ -5.00%
- Median HH income
- $52,139
- Composite
- 40.88/100
- National rank
- #3621
- State rank
- #46 of 73 in FL
Livability — Hollywood
- Score
- 76/100
- State rank
- #232
- US rank
- #3548
Category grades
Schools grade is shown separately in the Schools card above.
Census & demographics
- Census place
- Hollywood, FL
- County
- Broward County · 1,963,430 people
- City population
- 109,079
- Metro
- Miami-Fort Lauderdale-Pompano Beach, FL
- Population (ZIP)
- 14,293
- Household income
- $96,497
- Rent vs Own
- Severe rent burden
- 563.0
Population outlook (Broward County) Hauer SSP2
- Today (2025)
- 2,207,033 people
- By 2030
- 2,360,704 · +7.0%
- By 2040
- 2,661,208 · +20.6%
- By 2050
- 2,946,698 · +33.5%
- By 2075
- 3,602,273 · +63.2%
- By 2100
- 3,970,984 · +79.9%
Race, ethnicity, and origin ACS 2023
- Neighborhood character
- Majority White (61%)
- Race & ethnicity
- White 61% Hispanic / Latino 32% Two or more races 25% Black 2%
- Hispanic origin (detail)
- Puerto Rican 2% Cuban 6% Salvadoran 2%
- Common ancestry
- Scotch-Irish 7% Romanian 4% Lithuanian 4%
- Foreign-born
- 43% · Canada, Jamaica, Dominican Republic
- Languages at home
- 53% English-only · Spanish 30% Russian/Polish/Slavic 6% Other Indo-European 4%
Political lean MEDSL · Broward
- 2024 margin
- D (+17.0) · D 58.0% · R 41.0%
- 2008→2024 swing
- -17.8pp toward R · 2008: 34.7pp · 2024: 17.0pp
- All cycles
- 2024: D+17.0 2020: D+29.8 2016: D+35.0 2012: D+34.9 2008: D+34.7
Not yet ingested
- Civics
- —
Market trends
- HPI YoY
- ▼ -434.82%
- Current HPI
- 307.2922
- Rent YoY
- ▲ 2.92%
- Metro
- Miami-Fort Lauderdale-Pompano Beach, FL
- State GDP YoY
- ▲ 3.28%
- F500 in state
- 36
Industry mix (Fortune 500 HQ in FL)
| Industry | F500 HQs | Revenue |
|---|---|---|
| Industrial Technology | 2 | $29B |
|
||
| Insurance | 2 | $17B |
|
||
| Retail | 1 | $60B |
|
||
| Technology Distribution | 1 | $58B |
|
||
| Homebuilding | 1 | $35B |
|
||
| Technology Manufacturing | 1 | $35B |
|
||
Price history
-97.3% since first listed26 events — show timeline
- 2026-05-05 Listed for Rent $1,600 MARMLS
- 2026-04-17 Rental Removed $1,600 MARMLS
- 2026-04-15 Price Changed $1,600 MARMLS
- 2026-04-14 Listed for Rent $1,699 MARMLS
- 2026-03-25 Price Changed $264,000 MARMLS
- 2026-01-29 Listed $279,000 MARMLS
- 2025-05-16 Rental Removed $1,500 MARMLS
- 2025-05-15 Price Changed $1,500 MARMLS
- 2025-05-02 Listed for Rent $1,700 MARMLS
- 2024-02-22 Listing Removed — MARMLS
- 2024-02-08 Listed $295,000 MARMLS
- 2024-01-09 Price Changed $295,000 MARMLS
- 2023-12-03 Price Changed $315,000 MARMLS
- 2023-11-07 Listed $329,000 MARMLS
- 2023-03-02 Listing Removed — MARMLS
- 2023-02-10 Price Changed $289,000 MARMLS
- 2022-12-15 Price Changed $309,000 MARMLS
- 2022-12-14 Price Changed $319,000 MARMLS
- 2022-11-30 Listed $329,000 MARMLS
- 2021-08-12 Listing Removed — MARMLS
- 2021-06-28 Listed $249,900 MARMLS
- 2021-04-02 Listing Removed — MARMLS
- 2021-01-31 Price Changed $249,000 MARMLS
- 2021-01-31 Listed $249 MARMLS
- 1992-01-21 Sold (Public Records) $65,000 Public Records
- 1982-04-01 Sold (Public Records) $60,000 Public Records
Property tax history
+6.2%/yrLatest (2025): $5,229 · +3.6% YoY. Source: county tax records.
Cash-flow waterfall
monthlySold comps — $/sqft
last 12 mo · ≤1 miLoading sold comps…