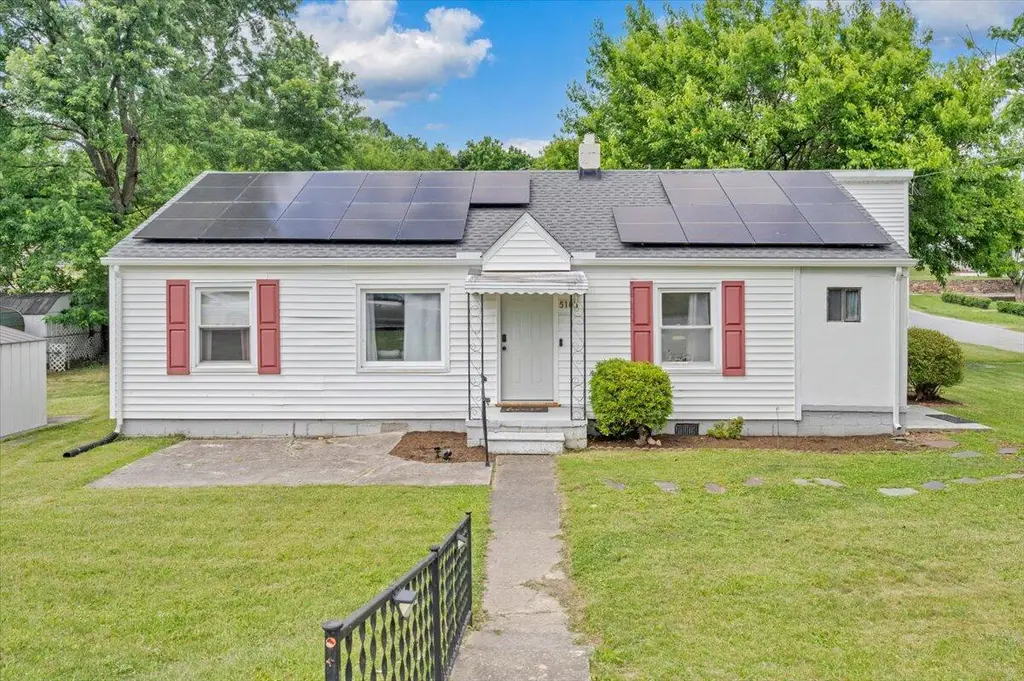
5103 Woodlawn Rd NW · Roanoke, VA
Flood risk 1/10 · Minimal
- FEMA flood zone
- X (unshaded)
- Chance of flooding over 30 yrs
- 0.0%
- Est. flood insurance / yr
- $507 – $1,088
Fire risk 1/10 · Minimal
- Est. fire insurance / yr
- $666 – $1,236
Heat risk 5/10 · Moderate
- Hot days now (above 101°F)
- 7 days/yr
- Hot days in 30 yrs
- 18 days/yr
Wind risk 2/10 · Minimal
- Chance of severe wind over 30 yrs
- 1.0%
Air-quality risk 1/10 · Minimal
- Unhealthy air days now
- 0 days/yr
- Unhealthy air days in 30 yrs
- 0 days/yr
Risk factors via First Street. Map © Google.
Why this score? — see what drove the F grade
The composite is a weighted blend of 9 inputs, each scored 0–100. Each bar is that input's sub-score; the figure is the points it added to the 100-point composite (weight × sub-score).
- Cash flow +10.6/30.0
- ARV discount +4.1/15.0
- Schools +4.1/10.0
- Rent growth +3.9/5.0
- Livability +3.7/5.0
- DSCR +3.1/10.0
- 1% rule +2.5/10.0
- Condition / age +2.5/5.0
- Appreciation +0.0/10.0
$203,500
🖨 Deal sheet (PDF) 📄 Offer letter ✓ Due diligence
Listing remarks MLS
Don't miss this adorable, well-maintained cottage-style ranch home! This home offers easy one-level living and is close to restaurants, bus line, highways/interstate and churches. Shows very well and would make a nice home for 1st time home buyer or for someone downsizing. Home has functional obsolescence as you have to go through 3rd bedroom to get to 4th bedroom, but 3rd bedroom could be used as office. Rear deck and fenced back yard.
Key facts
- Off street parking
- Level lot
- Rear deck
Tags
Property features AI
Finance
- Other: Listing agent: TONI GRAVELY; Listing broker: KELLER WILLIAMS COASTAL VIRGINIA
- Financial info: Annual tax information available
Exterior
- Utilities: Has heating; Has cooling
- Home design: Residential property; Built in 1946
- Construction: Built in 1946
- Exterior features: Lot approximately 0.17 acre (about 7,405 sq ft)
Interior
- Bedrooms: 4 bedrooms (all on the main level)
- Flooring: Carpet; Vinyl
- Bathrooms: 1 full bathroom; 1 half bathroom; 1 bathroom on the main level
- Heating & cooling: Heat pump (electric) for heating; Has cooling
- Interior features: Carpet and vinyl flooring
Neighborhood map
What this means for you Summary
Snapshot
- This is a 3-bed/2.0-bath single-family listed at $204k.
Deal economics
- At list price, monthly cash flow is $-99 ($-1k/yr) — negative.
- To cash-flow at today's rent, offer at most $186k (8.6% below list).
- To meet the 1% rule (rent ≥ 1% of price), the offer needs to be $153k (24.9% below list).
- Recommended offer: $153k (24.9% below list) — sets the bar for 1% rule.
- Cap rate 5.7% vs local median 4.2% in Roanoke — top-decile yield for the area; either an underpriced asset or a hidden risk that comps aren't pricing in. Stress-test before assuming the spread holds.
Location & tenants
- Location reads 73/100 on livability (#163 in VA) — a middle-class / working-renter tenant base. Strengths: cost of living A+, health & safety A+, housing A; Watch: amenities C-, employment D, crime F.
- Roanoke City Public School District (urban): math 40% / reading 58% proficiency, ranked #102 of 131 in VA (top 78%) — families likely to look elsewhere, expect single-tenant / working-renter base with shorter leases; 67% free/reduced lunch — lower-income household profile, screen leases tightly.
- Zoned schools: Westside Elementary (math 10% / reading 28%, grade F, #1,093 of 1,108 statewide, top 99%, 640 students, 98% FRL); Addison Aerospace Magnet Middle (math 25% / reading 55%, grade F, #306 of 342 statewide, top 90%, 523 students, 97% FRL); William Fleming High (math 66% / reading 68%, grade B, #185 of 319 statewide, top 61%, 1,911 students, 96% FRL) — zoned schools average 97% FRL vs 67% district-wide (30 pts higher); higher-poverty schools than district average — tighter screening recommended.
- Market conditions: Rents rising fast (+5.7%/yr); 152 active listings in the ZIP; 7 comparable units currently listed for rent nearby; rentals at typical pace (median 23d on market — plan ~3-4 weeks tenant-placement turnaround); 43% of comp listings sitting > 30 days — soft ceiling on asking rent; 113 units permitted in Roanoke city in 2024 (0 in 5+ unit buildings).
- This rent runs 39% of the median local income ($47k/yr) — at the standard rent-burdened threshold; future hikes will face affordability resistance.
Forward outlook
- Local home prices are declining (-3.0%/yr); year-one equity from $1k of loan paydown is wiped out by about $6k of value loss. Plan a longer hold.
- Roanoke County population projected at +11% by 2050 — modest demand growth; plan on rents tracking national, not racing it.
Negotiation context
- Only 8 days on market — expect competitive offers; lowballing is unlikely to land.
- 2 sale attempts since 5y ago with the ask held roughly flat each time — persistent listings suggest the price (not the market) is what's stuck; bring a comps-based counter.
- Current owner paid $134k; list at $204k implies a 51% gain — meaningful room to come down on a strong offer.
Risks & watch-outs
- Watch-outs: built in 1946 — expect roof / HVAC / electrical / plumbing capex.
- Climate carrying-cost: extreme-heat days projected 7→18/yr by 2055 (HVAC capex compounding) — expect insurance premiums to compound above CPI over the hold.
Questions for the listing agent
- What do current leases actually rent for vs. the listed asking? Can we see a recent rent roll and the last 12 months of T-12 income?
- Built in 1946 — when were the roof, HVAC, electrical panel, plumbing, and water heater last replaced?
- Is there a deadline driving the sale (1031 exchange, divorce, estate, relocation)? That informs how much negotiation room exists.
- Schools are A-rated — typically a magnet for longer-tenancy family renters. What's the average tenant stay here, and is there a school-zone premium baked into asking?
- Crime grade is F in this area — have there been break-ins, vandalism, or insurance claims at this property in the last 3 years? What carrier currently insures it and at what premium?
- The area grade is low — what's the realistic commute time and amenity access for the typical tenant pool here? Any planned neighborhood developments (good or bad) we should know about?
- What's the average days-on-market for RENTAL listings here right now (not sales)? A rising rental-DOM trend means longer vacancies and softer asking-rent achievability than the comps imply.
- What's the recent tenant-quality profile in this submarket — average credit score on applications, eviction rate, late-payment / NSF rate, and stable-employment percentage? A property-management company in the area should have these aggregated.
- How much new for-sale + rental construction is in the pipeline within 1–3 miles? Heavy new supply typically softens prices + rents 12–24 months out; constrained supply supports both.
Investment metrics
- 1% rule
- 0.75% ✗
- Cap rate
- 5.71%
- Cash-on-cash
- -2.09%
- DSCR
- 0.91
- GRM
- 11.1
CMA / ARV
- ARV (on-the-fly)
- $189,240
- Comps found
- 12
Show comp detail 12 sales within ~0.75 mi
| Address | Dist | Beds/Ba | Sqft | Sold | Price | $/sf | Match |
|---|---|---|---|---|---|---|---|
| 4926 Northwood Dr NW | 0.32mi | 3/2.0 | 1,091 (-4%) | 1mo | $245,000 | $225 | 77 |
| 4702 Edgelawn Ave NW | 0.33mi | 3/2.0 | 1,064 (-7%) | 6mo | $215,000 | $202 | 68 |
| 1001 Peck St NW | 0.33mi | 3/1.0 | 1,058 (-7%) | 8mo | $123,500 | $117 | 62 |
| 4783 Showalter Rd NW | 0.43mi | 3/1.0 | 1,225 (+8%) | 4mo | $150,000 | $122 | 60 |
| 1046 Silverwood Rd NW | 0.61mi | 3/1.0 | 1,125 (-1%) | 8mo | $187,000 | $166 | 59 |
| 4832 Showalter Rd NW | 0.41mi | 3/1.0 | 1,300 (+14%) | 5mo | $170,000 | $131 | 50 |
| 987 Mountain Rd NW | 0.45mi | 3/1.0 | 1,268 (+11%) | 10mo | $199,000 | $157 | 48 |
| 216 Ross St | 0.60mi | 2/1.0 (-1) | 1,095 (-4%) | 12mo | $225,000 | $205 | 47 |
| 103 Ross St | 0.63mi | 3/1.0 | 1,000 (-12%) | 4mo | $133,400 | $133 | 42 |
| 5027 Morwanda St NW | 0.64mi | 2/1.0 (-1) | 1,244 (+9%) | 7mo | $175,500 | $141 | 40 |
| 102 Ross St | 0.60mi | 3/1.0 | 1,000 (-12%) | 8mo | $229,950 | $230 | 40 |
| 1723 Victoria St | 0.75mi | 3/1.5 | 1,283 (+12%) | 12mo | $240,000 | $187 | 32 |
Match score weights: distance 35% · size 25% · config 20% · recency 20%. Top-matched comps best support the ARV.
Projected returns pro-forma
-3.0% appreciation · 5.71% rent growth · sell at horizon
- IRR
- -17.0%
- Equity multiple
- 0.38×
- Total profit
- $-35,047
- Equity at exit
- $30,343
- IRR
- -4.9%
- Equity multiple
- 0.64×
- Total profit
- $-20,233
- Equity at exit
- $17,595
Cash invested: $56,980 (down + closing). Projections, not guarantees.
Landlord ↔ Tenant lean methodology
- Overall (STATE)
- 55 Moderately Landlord-Leaning
- State Virginia
- 55 Moderately Landlord-Leaning · D+2
- County
- — inherits STATE
- City
- — inherits STATE
ZIP-level market 24017
- Home prices YoY
- -28.3%
- Rents YoY
- 5.7%
- Active inventory
- 152
- Price-to-rent
- 11.1×
Monthly cashflow live
- Estimated rent
- $1,529 high interval (Pro) →
- Mortgage (P&I)
- −$1,067
- Tax from tax record
- −$155 /mo · $1,858/yr
- Insurance
- −$85
- HOA
- −$0
- Vacancy / Maint / Mgmt
- −$321
- Net cashflow
- $-99
Break-even live
Sensitivity live
| Price | -10% $16 | -5% $-42 | +0% $-99 | +5% $-157 | +10% $-214 |
|---|---|---|---|---|---|
| Rent | -10% $-220 | -5% $-160 | +0% $-99 | +5% $-39 | +10% $22 |
| Rate | -1.0pp $3 | -0.5pp $-47 | base $-99 | +0.5pp $-152 | +1.0pp $-206 |
UW: 25.0% down · 7.5% · 30yr · 1.5% tax · 5.0% vac · 8.0% maint · 8.0% mgmt
Financing live
Cash to close
- Down payment
- $50,875
- Closing costs
- $6,105
- Reserves months
- —
- Total cash needed
- —
Loan-product check · same deal, 3 products live
Conventional
25% down · 7.5% · 30yr
- Down + closing
- —
- Monthly P&I
- —
- Monthly cashflow
- —
- DSCR
- —
- Eligible?
- —
Personal DTI + credit; lowest rate.
DSCR
20% down · 8.5% · 30yr
- Down + closing
- —
- Monthly P&I
- —
- Monthly cashflow
- —
- DSCR
- —
- Eligible?
- —
No personal income docs; deal must DSCR.
Hard money
10% down · 12.0% · 12mo
- Down + closing
- —
- Monthly P&I
- —
- Monthly cashflow
- —
- DSCR
- —
- Eligible?
- —
Short-term bridge; refi at stabilization.
Rent comps 7 comps
| Address | Beds | Baths | Sqft | Rent | $/sqft | DOM | Units | Dist |
|---|---|---|---|---|---|---|---|---|
| 1741 Pexton Ave Salem, VA | 3.0 | 1.0 | 792 | $1,452 | $1.83 | 15d | 1 | 0.36mi |
| 4310 Tyree Rd NW Roanoke, VA | 3.0 | 1.0 | 913 | $1,650 | $1.81 | 15d | 1 | 0.71mi |
| 328 Woodside Dr Salem, VA | 3.0 | 2.5 | 1408 | $1,999 | $1.42 | 23d | 1 | 1.15mi |
| 4626 Autumn Ln NW Roanoke, VA | 3.0 | 2.5 | 1408 | $1,999 | $1.42 | 15d | 1 | 1.19mi |
| 3802 Panorama Ave NW #6 Roanoke, VA | 2.0 | 1.0 | 900 | $1,050 | $1.17 | 45d | 1 | 1.27mi |
| 3802 Panorama Ave NW #2 Roanoke, VA | 2.0 | 1.0 | 900 | $995 | $1.11 | 45d | 1 | 1.27mi |
| 3802 Panorama Ave NW #12 Roanoke, VA | 3.0 | 1.0 | 1100 | $995 | $0.90 | 45d | 1 | 1.27mi |
Listing history 7 events
-
2026-06-13statusdays on market $203,500 Pending 8 DOM
-
2026-06-10days on market $203,500 Active 6 DOM
-
2026-06-09days on market $203,500 Active 5 DOM
-
2026-06-08remarks 600-char remark
-
2026-06-08days on market $203,500 Active 4 DOM
-
2026-06-05remarks 563-char remark
-
2026-06-05$203,500 Active 1 DOM
ⓘ Source: listings_history table (triggers on properties + properties_extension) + one-shot
backfill from property_details.listing_events for pre-trigger history.
Tax reassessment forecast VA · Resets to sale price
- Current annual tax
- $1,858 · $155/mo
- Projected year-2 tax
- $1,858 · $155/mo
- Expected delta
- $0/yr ($0/mo · 0.0%)
ⓘ Screening estimate from a state-policy table — verify with the county assessor before closing.
Climate risk First Street
- Flood 1/10 Low FEMA zone X (unshaded) · 0% chance over 30 yrs
- Wildfire 1/10 Low
- Heat 5/10 Major 7 d/yr ≥101°F today · 18 d/yr by 30 yrs out
- Wind 2/10 Low 100% chance of damaging wind over 30 yrs
- Air quality 1/10 Low 0 unhealthy d/yr today · 0 by 30 yrs out
Nearby sold comps map
Loading sold comps map…
Walkable amenities ~0.75 mi
Loading nearby amenities…
Taxation est. · year 1
- Rental income
- $18,344
- − Mortgage interest
- −$11,399
- − Property taxes
- −$1,858
- − Insurance
- −$1,018
- − Repairs & maintenance
- −$1,467
- − Management
- −$1,467
- − Depreciation
- −$5,920
- Taxable loss
- −$4,786
- Est. tax savings @ 24.0%
- +$1,149
- After-tax cash flow
- $-41/yr
For passive investors: Depreciation is non-cash, so a rental often shows a tax loss while cash-flowing — sheltering income. Rental losses are passive: they offset passive income freely, and up to $25,000/yr can offset ordinary (W-2) income if you actively participate and your MAGI is under $100k (phasing out to $0 by $150k); unused losses carry forward. On sale, claimed depreciation is recaptured at up to 25%, and gains may owe capital-gains tax (a 1031 exchange can defer both). Figures are a year-1 estimate at your 24.0% rate — not tax advice; consult a CPA.
Schools (NCES district)
- District
- Roanoke City Public School District
- NCES district ID
- 5103300
- Math proficiency
- 40% ▼ -38.00%
- Reading proficiency
- 58% ▼ -12.00%
- Median HH income
- $38,592
- Composite
- 40.8/100
- National rank
- #3639
- State rank
- #102 of 131 in VA
Livability — Roanoke
- Score
- 73/100
- State rank
- #163
- US rank
- #5055
Category grades
Schools grade is shown separately in the Schools card above.
Census & demographics
- Census place
- Roanoke, VA
- County
- Roanoke City · 101,625 people
- City population
- 168,930
- Metro
- Roanoke, VA
- Population (ZIP)
- 23,678
- Household income
- $47,360
- Rent vs Own
- Severe rent burden
- 913.0
Population outlook (Roanoke County) Hauer SSP2
- Today (2025)
- 106,094 people
- By 2030
- 108,927 · +2.7%
- By 2040
- 114,104 · +7.5%
- By 2050
- 118,032 · +11.3%
- By 2075
- 123,363 · +16.3%
- By 2100
- 116,827 · +10.1%
Race, ethnicity, and origin ACS 2023
- Neighborhood character
- Diverse neighborhood (Simpson 0.58)
- Race & ethnicity
- Black 59% White 25% Hispanic / Latino 9% Asian 4% Two or more races 4%
- Hispanic origin (detail)
- Mexican 2% Cuban 1%
- Common ancestry
- Slovak 1% Romanian 1% Lithuanian 1%
- Foreign-born
- 9% · Canada, China, Vietnam
- Languages at home
- 87% English-only · Spanish 8% Other Indo-European 3% German/W. Germanic 1%
Political lean MEDSL · Roanoke
- 2024 margin
- Strong D (+23.6) · D 61.1% · R 37.5% · Other 1.4%
- 2008→2024 swing
- +0.2pp no change · 2008: 23.4pp · 2024: 23.6pp
- All cycles
- 2024: D+23.6 2020: D+25.8 2016: D+17.6 2012: D+21.5 2008: D+23.4
Not yet ingested
- Civics
- —
Market trends
- HPI YoY
- ▼ -78.29%
- Current HPI
- 198.5991
- Rent YoY
- ▲ 5.71%
- Metro
- Roanoke, VA
- State GDP YoY
- ▲ 2.40%
- F500 in state
- 50
Industry mix (Fortune 500 HQ in VA)
| Industry | F500 HQs | Revenue |
|---|---|---|
| Aerospace / Defense | 4 | $236B |
|
||
| Technology / Defense | 3 | $32B |
|
||
| Financial Services | 2 | $176B |
|
||
| Utilities | 2 | $27B |
|
||
| Insurance | 2 | $25B |
|
||
| Technology | 2 | $15B |
|
||
Price history
+516.7% since first listed4 events — show timeline
- 2026-06-02 Listed $203,500 MLSRV
- 2022-01-03 Sold (MLS) $134,500 MLSRV
- 2021-09-30 Listed $135,000 MLSRV
- 2007-03-05 Sold (Public Records) $33,000 Public Records
Property tax history
+7.8%/yrLatest (2025): $1,858 · +15.3% YoY. Source: county tax records.
Cash-flow waterfall
monthlySold comps — $/sqft
last 12 mo · ≤1 miLoading sold comps…