722 Irvin Ln · Williamsburg, PA
Flood risk 1/10 · Minimal
- FEMA flood zone
- X (unshaded)
- Chance of flooding over 30 yrs
- 0.0%
- Est. flood insurance / yr
- $507 – $1,088
Fire risk 1/10 · Minimal
- Est. fire insurance / yr
- $511 – $949
Heat risk 3/10 · Minor
- Hot days now (above 95°F)
- 7 days/yr
- Hot days in 30 yrs
- 17 days/yr
Wind risk 2/10 · Minimal
- Chance of severe wind over 30 yrs
- —
Air-quality risk 2/10 · Minimal
- Unhealthy air days now
- 1 days/yr
- Unhealthy air days in 30 yrs
- 2 days/yr
Risk factors via First Street. Map © Google.
Why this score? — see what drove the D- grade
The composite is a weighted blend of 9 inputs, each scored 0–100. Each bar is that input's sub-score; the figure is the points it added to the 100-point composite (weight × sub-score).
- Cash flow +11.3/30.0
- Appreciation +7.4/10.0
- Schools +3.9/10.0
- Livability +3.7/5.0
- DSCR +3.3/10.0
- 1% rule +3.0/10.0
- Rent growth +2.5/5.0
- Condition / age +2.5/5.0
- ARV discount +1.0/15.0
$149,900
🖨 Deal sheet (PDF) 📄 Offer letter ✓ Due diligence
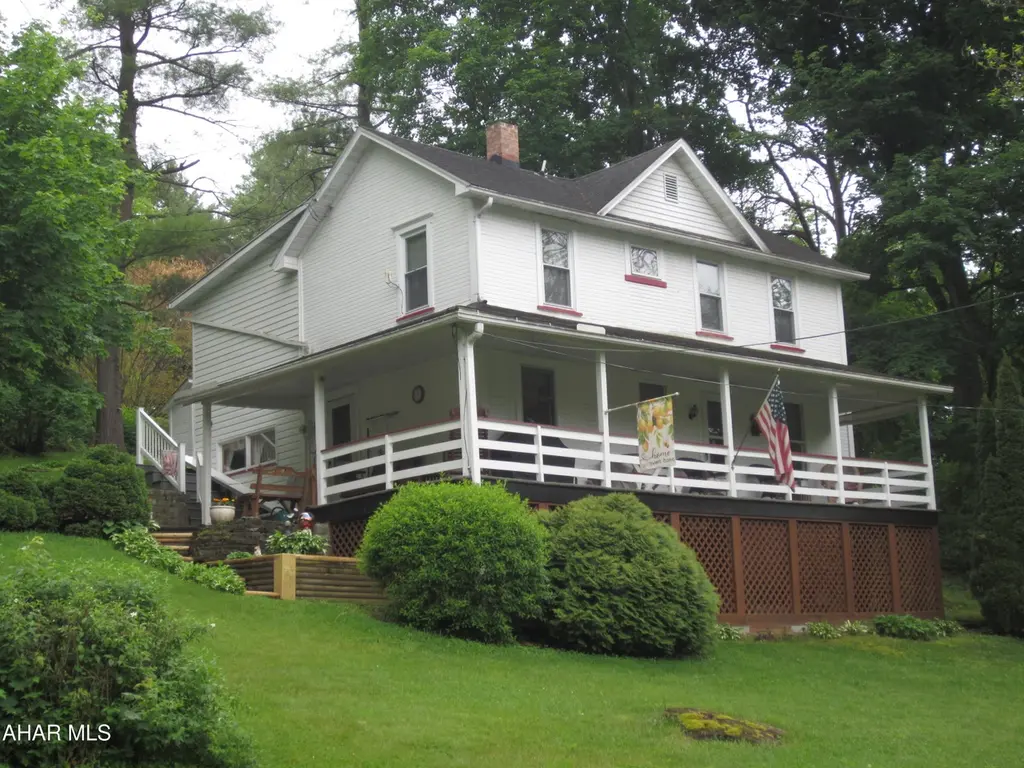
Listing remarks
Sitting at the edge of town on Cedar Hill Road, Woodbury Township is this solid, well kept 3 bedroom one and one half bath, two story home. Nice landscape, paved driveway, fire pit, carport and covered wrap around front porch that will keep you content in the outdoors. Inside, this home is very clean and ready to move into. Oak kitchen cabinets. good lighting, large dining room and spacious living room and nice size bedrooms w/ closets. The forced air furnace is only 4 years old, has been serviced and ready to go. Hot water heater is 3 years old and electric panel is 100 AMP breakers. It's not far from fishing at Clover Creek or riding the bike trail.
Key facts
- Oak kitchen cabinets
- Paved driveway
- Carport
Tags
Property features AI
Exterior
- Parking: Detached parking
- Utilities: Public water
- Home design: Single-family residence; Two stories
- Construction: Aluminum siding; Wood siding; Built with foundation (basement present)
- Exterior features: Shingle roof; Shed(s); Sloped lot
Interior
- Kitchen: Dishwasher; Microwave; Range; Refrigerator
- Flooring: Laminate; Vinyl; Carpet
- Bathrooms: 1 full bathroom; 1 half bathroom
- Heating & cooling: Forced air heating (oil); Ceiling fan(s)
- Interior features: Insulated windows; Storm windows; Porch
- Laundry & utility: Washer; Dryer; Basement
Neighborhood map
What this means for you Summary
Snapshot
- This is a 3-bed/1.5-bath single-family listed at $150k.
Deal economics
- At list price, monthly cash flow is $-54 ($-646/yr) — negative.
- To cash-flow at today's rent, offer at most $140k (6.3% below list).
- To meet the 1% rule (rent ≥ 1% of price), the offer needs to be $119k (20.4% below list).
- Recommended offer: $119k (20.4% below list) — sets the bar for 1% rule.
Location & tenants
- Location reads 73/100 on livability (#561 in PA) — a middle-class / working-renter tenant base. Strengths: crime A+, cost of living A+, housing A+; Watch: employment C-, amenities F, commute F.
- Williamsburg Community SD (rural): math 35% / reading 58% proficiency, ranked #260 of 539 in PA (top 48%) — families likely to look elsewhere, expect single-tenant / working-renter base with shorter leases.
- Zoned schools: Williamsburg Community El Sch (math 37% / reading 57%, grade D-, #737 of 1,518 statewide, top 52%, 236 students, 52% FRL); Williamsburg Community Jshs (math 32% / reading 57%, grade F, #196 of 437 statewide, top 47%, 228 students, 34% FRL).
- Market conditions: 15 active listings in the ZIP; 99 units permitted in Blair County in 2024 (0 in 5+ unit buildings).
Forward outlook
- In year one you build about $8k of equity ($1k loan paydown + $7k appreciation (4.9% local appreciation)).
- Blair County population projected at -18% by 2050 — secular population decline; favor cash flow + early exit over multi-decade hold.
- At projected returns (4.9% appreciation + 3.0% rent growth), your $42k cash investment doubles in ~5 years — after that, you're playing with house money.
- By year 5, paydown + projected appreciation supports a ~$36k cash-out refi (75% LTV) — recoverable capital for the next deal without selling this one.
Negotiation context
- Only 6 days on market — expect competitive offers; lowballing is unlikely to land.
Risks & watch-outs
- Watch-outs: built in 1910 — expect roof / HVAC / electrical / plumbing capex.
Questions for the listing agent
- What do current leases actually rent for vs. the listed asking? Can we see a recent rent roll and the last 12 months of T-12 income?
- Built in 1910 — when were the roof, HVAC, electrical panel, plumbing, and water heater last replaced?
- Is there a deadline driving the sale (1031 exchange, divorce, estate, relocation)? That informs how much negotiation room exists.
- The area grade is low — what's the realistic commute time and amenity access for the typical tenant pool here? Any planned neighborhood developments (good or bad) we should know about?
- What's the average days-on-market for RENTAL listings here right now (not sales)? A rising rental-DOM trend means longer vacancies and softer asking-rent achievability than the comps imply.
- What's the recent tenant-quality profile in this submarket — average credit score on applications, eviction rate, late-payment / NSF rate, and stable-employment percentage? A property-management company in the area should have these aggregated.
- How much new for-sale + rental construction is in the pipeline within 1–3 miles? Heavy new supply typically softens prices + rents 12–24 months out; constrained supply supports both.
Investment metrics
- 1% rule
- 0.80% ✗
- Cap rate
- 5.86%
- Cash-on-cash
- -1.54%
- DSCR
- 0.93
- GRM
- 10.5
CMA / ARV
- ARV (on-the-fly)
- $131,022
- Comps found
- 5
Show comp detail 5 sales within ~0.75 mi
| Address | Dist | Beds/Ba | Sqft | Sold | Price | $/sf | Match |
|---|---|---|---|---|---|---|---|
| 125 E 2nd St | 0.26mi | 3/1.0 | 1,521 (+1%) | 6mo | $167,000 | $110 | 80 |
| 215 E 3rd St | 0.29mi | 3/1.0 | 1,628 (+8%) | 8mo | $140,000 | $86 | 64 |
| 120-22 E 2nd Ave | 0.29mi | 3/1.0 | 1,544 (+2%) | 24mo | $115,000 | $74 | 61 |
| 221 E 4th St | 0.29mi | 2/2.0 (-1) | 1,694 (+12%) | 9mo | $180,000 | $106 | 51 |
| 646 W 2nd St | 0.71mi | 3/1.0 | 1,720 (+14%) | 6mo | $149,000 | $87 | 37 |
Match score weights: distance 35% · size 25% · config 20% · recency 20%. Top-matched comps best support the ARV.
Projected returns pro-forma
4.86% appreciation · 3.0% rent growth · sell at horizon
- IRR
- 11.2%
- Equity multiple
- 1.71×
- Total profit
- $29,926
- Equity at exit
- $83,683
- IRR
- 12.5%
- Equity multiple
- 3.24×
- Total profit
- $94,019
- Equity at exit
- $143,393
Cash invested: $41,972 (down + closing). Projections, not guarantees.
Landlord ↔ Tenant lean methodology
- Overall (STATE)
- 62 Landlord-Friendly
- State Pennsylvania
- 62 Landlord-Friendly · EVEN
- County
- — inherits STATE
- City
- — inherits STATE
ZIP-level market 16693
- Home prices YoY
- 3.8%
- Active inventory
- 15
- Price-to-rent
- 10.5×
Monthly cashflow live
- Estimated rent
- $1,193 medium interval (Pro) →
- Mortgage (P&I)
- −$786
- Tax from tax record
- −$148 /mo · $1,772/yr
- Insurance
- −$62
- HOA
- −$0
- Vacancy / Maint / Mgmt
- −$250
- Net cashflow
- $-54
Break-even live
Sensitivity live
| Price | -10% $31 | -5% $-11 | +0% $-54 | +5% $-96 | +10% $-139 |
|---|---|---|---|---|---|
| Rent | -10% $-148 | -5% $-101 | +0% $-54 | +5% $-7 | +10% $40 |
| Rate | -1.0pp $22 | -0.5pp $-16 | base $-54 | +0.5pp $-93 | +1.0pp $-132 |
UW: 25.0% down · 7.5% · 30yr · 1.5% tax · 5.0% vac · 8.0% maint · 8.0% mgmt
Financing live
Cash to close
- Down payment
- $37,475
- Closing costs
- $4,497
- Reserves months
- —
- Total cash needed
- —
Loan-product check · same deal, 3 products live
Conventional
25% down · 7.5% · 30yr
- Down + closing
- —
- Monthly P&I
- —
- Monthly cashflow
- —
- DSCR
- —
- Eligible?
- —
Personal DTI + credit; lowest rate.
DSCR
20% down · 8.5% · 30yr
- Down + closing
- —
- Monthly P&I
- —
- Monthly cashflow
- —
- DSCR
- —
- Eligible?
- —
No personal income docs; deal must DSCR.
Hard money
10% down · 12.0% · 12mo
- Down + closing
- —
- Monthly P&I
- —
- Monthly cashflow
- —
- DSCR
- —
- Eligible?
- —
Short-term bridge; refi at stabilization.
Listing history 5 events
-
2026-06-02status $149,900 Pending 6 DOM
-
2026-06-01days on market $149,900 Active 6 DOM
-
2026-05-31days on market $149,900 Active 5 DOM
-
2026-05-30days on market $149,900 Active 4 DOM
-
2026-05-26$149,900 Active
ⓘ Source: listings_history table (triggers on properties + properties_extension) + one-shot
backfill from property_details.listing_events for pre-trigger history.
Tax reassessment forecast PA · Partial reset (capped growth)
- Current annual tax
- $1,772 · $148/mo
- Projected year-2 tax
- $2,070 · $173/mo
- Expected delta
- +$298/yr (+$25/mo · 16.8%)
ⓘ Screening estimate from a state-policy table — verify with the county assessor before closing.
Climate risk First Street
- Flood 1/10 Low FEMA zone X (unshaded) · 0% chance over 30 yrs
- Wildfire 1/10 Low
- Heat 3/10 Moderate 7 d/yr ≥95°F today · 17 d/yr by 30 yrs out
- Wind 2/10 Low
- Air quality 2/10 Low 1 unhealthy d/yr today · 2 by 30 yrs out
Nearby sold comps map
Loading sold comps map…
Walkable amenities ~0.75 mi
Loading nearby amenities…
Taxation est. · year 1
- Rental income
- $14,314
- − Mortgage interest
- −$8,397
- − Property taxes
- −$1,772
- − Insurance
- −$750
- − Repairs & maintenance
- −$1,145
- − Management
- −$1,145
- − Depreciation
- −$4,361
- Taxable loss
- −$3,255
- Est. tax savings @ 24.0%
- +$781
- After-tax cash flow
- $135/yr
For passive investors: Depreciation is non-cash, so a rental often shows a tax loss while cash-flowing — sheltering income. Rental losses are passive: they offset passive income freely, and up to $25,000/yr can offset ordinary (W-2) income if you actively participate and your MAGI is under $100k (phasing out to $0 by $150k); unused losses carry forward. On sale, claimed depreciation is recaptured at up to 25%, and gains may owe capital-gains tax (a 1031 exchange can defer both). Figures are a year-1 estimate at your 24.0% rate — not tax advice; consult a CPA.
Schools (NCES district)
- District
- Williamsburg Community SD
- NCES district ID
- 4226430
- Math proficiency
- 35% ▼ -7.00%
- Reading proficiency
- 58% ▼ -4.00%
- Median HH income
- $43,977
- Composite
- 39.22/100
- National rank
- #4014
- State rank
- #260 of 539 in PA
Livability — Williamsburg
- Score
- 73/100
- State rank
- #561
- US rank
- #5279
Category grades
Schools grade is shown separately in the Schools card above.
Census & demographics
- Population (ZIP)
- 4,015
Population outlook (Blair County) Hauer SSP2
- Today (2025)
- 121,571 people
- By 2030
- 117,966 · -3.0%
- By 2040
- 109,174 · -10.2%
- By 2050
- 99,542 · -18.1%
- By 2075
- 76,775 · -36.8%
- By 2100
- 54,326 · -55.3%
Race, ethnicity, and origin ACS 2023
- Neighborhood character
- Predominantly White (93%)
- Race & ethnicity
- White 93% Two or more races 5% Hispanic / Latino 2%
- Common ancestry
- Slovak 3% Serbian 2% Romanian 1%
- Foreign-born
- 1% · Canada
- Languages at home
- 96% English-only · German/W. Germanic 3%
Political lean MEDSL · Blair
- 2024 margin
- Solid R (+43.5) · D 27.9% · R 71.4%
- 2008→2024 swing
- -19.2pp toward R · 2008: -24.3pp · 2024: -43.5pp
- All cycles
- 2024: R+43.5 2020: R+43.5 2016: R+46.4 2012: R+33.5 2008: R+24.3
Not yet ingested
- Civics
- —
Market trends
- HPI YoY
- ▲ 4.86%
- Current HPI
- 133.0129
- Rent YoY
- —
- Metro
- —
- State GDP YoY
- ▲ 1.68%
- F500 in state
- 34
Industry mix (Fortune 500 HQ in PA)
| Industry | F500 HQs | Revenue |
|---|---|---|
| Healthcare | 2 | $309B |
|
||
| Insurance | 2 | $27B |
|
||
| Telecommunications / Media | 1 | $124B |
|
||
| Industrial Distribution | 1 | $22B |
|
||
| Financial Services | 1 | $20B |
|
||
| Chemicals / Materials | 1 | $18B |
|
||
Price history
1 event — show timeline
- 2026-05-26 Listed $149,900 AHARMLS
Property tax history
+11.9%/yrLatest (2025): $1,772 · +3.9% YoY. Source: county tax records.
Cash-flow waterfall
monthlySold comps — $/sqft
last 12 mo · ≤1 miLoading sold comps…