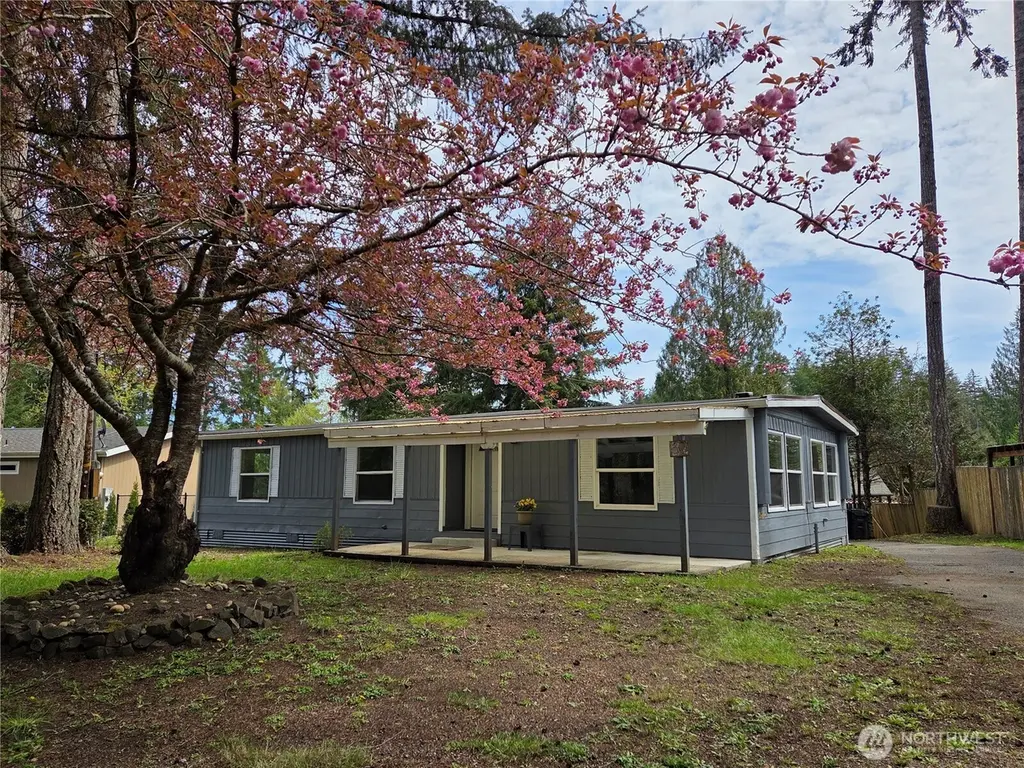
60 E Balbriggan Rd · Shelton, WA
Flood risk 1/10 · Minimal
- FEMA flood zone
- X (unshaded)
- Chance of flooding over 30 yrs
- 0.0%
- Est. flood insurance / yr
- $507 – $1,088
Fire risk 3/10 · Minor
- Est. fire insurance / yr
- $604 – $1,122
Heat risk 3/10 · Minor
- Hot days now (above 88°F)
- 7 days/yr
- Hot days in 30 yrs
- 14 days/yr
Wind risk 1/10 · Minimal
- Chance of severe wind over 30 yrs
- —
Air-quality risk 6/10 · Moderate
- Unhealthy air days now
- 7 days/yr
- Unhealthy air days in 30 yrs
- 7 days/yr
Risk factors via First Street. Map © Google.
Why this score? — see what drove the F grade
The composite is a weighted blend of 9 inputs, each scored 0–100. Each bar is that input's sub-score; the figure is the points it added to the 100-point composite (weight × sub-score).
- ARV discount +11.8/15.0
- Cash flow +7.3/30.0
- Schools +4.0/10.0
- Livability +3.7/5.0
- Rent growth +2.5/5.0
- Condition / age +2.5/5.0
- 1% rule +1.6/10.0
- DSCR +1.5/10.0
- Appreciation +0.0/10.0
$254,000
🖨 Deal sheet 📄 Offer letter ✓ Due diligence
Listing remarks
Freshly updated home in Lake Limerick on your own large 10,454sf lot! 1,152sf home, offering 2 beds & 2 full baths, fabulous kitchen with white cabinetry and island, oiled butcher block counter tops (All new appliances including stove & dishwasher prior to close)! Huge primary with ensuite bath & double closets. New carpets & laminate flooring, new lighting, nice open concept. Paved driveway offers ample parking & RV parking. Community residential golf course, club house, pro golf shop, 7 beautiful community parks, 4 community boat launches, and lakes stocked with fish!!
Key facts
- Laminate flooring
- Double closets
- Large lot
Tags
Neighborhood map
What this means for you Summary
Snapshot
- This is a 2-bed/2.0-bath manufactured listed at $254k.
Deal economics
- At list price, monthly cash flow is $-337 ($-4k/yr) — negative.
- To cash-flow at today's rent, offer at most $195k (23.4% below list).
- To meet the 1% rule (rent ≥ 1% of price), the offer needs to be $167k (34.3% below list).
- Recommended offer: $167k (34.3% below list) — sets the bar for 1% rule.
- Cap rate 4.7% vs local median 3.1% in Shelton — top-decile yield for the area; either an underpriced asset or a hidden risk that comps aren't pricing in. Stress-test before assuming the spread holds.
Location & tenants
- Location reads 73/100 on livability (#203 in WA) — a middle-class / working-renter tenant base. Strengths: housing A+, health & safety A+, amenities A-; Watch: schools D+, employment D+, crime F.
- Pioneer School District (rural): math 37% / reading 51% proficiency, ranked #188 of 291 in WA (top 65%) — families likely to look elsewhere, expect single-tenant / working-renter base with shorter leases.
- Market conditions: 439 active listings in the ZIP; solid renter incomes; 299 units permitted in Mason County in 2024 (0 in 5+ unit buildings).
Forward outlook
- Local home prices are declining (-3.0%/yr); year-one equity from $2k of loan paydown is wiped out by about $8k of value loss. Plan a longer hold.
- Mason County population projected at -14% by 2050 — secular population decline; favor cash flow + early exit over multi-decade hold.
Negotiation context
- It's been on market 65 days — a 6% lower offer ($239k) is reasonable based on typical stale-listing flexibility.
- 4 sale attempts since 18y ago with the ask held roughly flat each time — persistent listings suggest the price (not the market) is what's stuck; bring a comps-based counter.
- Current owner paid $120k; list at $254k implies a 112% gain — meaningful room to come down on a strong offer.
Questions for the listing agent
- What do current leases actually rent for vs. the listed asking? Can we see a recent rent roll and the last 12 months of T-12 income?
- It's been on market 65 days. Have you received any prior offers? Is the seller open to a 34% concession, seller financing, or rate buy-down credit?
- Built in 1973 — when were the roof, HVAC, electrical panel, plumbing, and water heater last replaced?
- What does the HOA fee cover, when was the last increase, and are there any pending special assessments or reserve-fund shortfalls?
- Why hasn't it sold? Are there any deal-killer items the seller is aware of (foundation, flood, title, zoning, code violations)?
- Is there a deadline driving the sale (1031 exchange, divorce, estate, relocation)? That informs how much negotiation room exists.
- Schools are D-rated, which usually means shorter tenancies and higher turnover. Who's the typical renter profile here, and what's been the actual vacancy rate?
- Crime grade is F in this area — have there been break-ins, vandalism, or insurance claims at this property in the last 3 years? What carrier currently insures it and at what premium?
- The area grade is low — what's the realistic commute time and amenity access for the typical tenant pool here? Any planned neighborhood developments (good or bad) we should know about?
- What's the average days-on-market for RENTAL listings here right now (not sales)? A rising rental-DOM trend means longer vacancies and softer asking-rent achievability than the comps imply.
- What's the recent tenant-quality profile in this submarket — average credit score on applications, eviction rate, late-payment / NSF rate, and stable-employment percentage? A property-management company in the area should have these aggregated.
- How much new for-sale + rental construction is in the pipeline within 1–3 miles? Heavy new supply typically softens prices + rents 12–24 months out; constrained supply supports both.
Investment metrics
- 1% rule
- 0.66% ✗
- Cap rate
- 4.70%
- Cash-on-cash
- -5.68%
- DSCR
- 0.75
- GRM
- 12.7
CMA / ARV
- ARV (median comp)
- $281,140
- List price
- $254,000
- Delta
- -9.65%
- Verdict
- FAIR
- Comps
- 11 within 1.0 mi
Show comp detail 12 sales within ~0.75 mi
| Address | Dist | Beds/Ba | Sqft | Sold | Price | $/sf | Match |
|---|---|---|---|---|---|---|---|
| 60 E Balbriggan Rd | 0.00mi | 3/2.0 (+1) | 1,152 (0%) | 0mo | $245,000 | $213 | 95 |
| 180 E Barnsby Pl | 0.23mi | 2/2.0 | 1,152 (0%) | 3mo | $325,000 | $282 | 87 |
| 190 E Barnsby Pl | 0.21mi | 2/2.0 | 1,120 (-3%) | 3mo | $325,000 | $290 | 83 |
| 200 E Dartmoor | 0.15mi | 3/2.0 (+1) | 1,188 (+3%) | 7mo | $250,000 | $210 | 77 |
| 171 E Barnsby Pl | 0.18mi | 3/2.0 (+1) | 1,080 (-6%) | 5mo | $325,000 | $301 | 72 |
| 391 E Olde Lyme Rd | 0.20mi | 3/2.0 (+1) | 1,166 (+1%) | 20mo | $314,450 | $270 | 67 |
| 141 E Dalkeith Rd | 0.16mi | 3/2.0 (+1) | 1,280 (+11%) | 3mo | $330,000 | $258 | 66 |
| 181 E Olde Lyme Rd | 0.26mi | 3/2.0 (+1) | 1,296 (+12%) | 0mo | $322,000 | $248 | 62 |
| 330 E Dartmoor Dr | 0.05mi | 3/2.0 (+1) | 1,296 (+12%) | 14mo | $273,465 | $211 | 60 |
| 21 E Cromarty Ct | 0.29mi | 3/1.0 (+1) | 1,056 (-8%) | 8mo | $280,000 | $265 | 57 |
| 230 E Sleaford Rd | 0.45mi | 3/2.0 (+1) | 1,200 (+4%) | 15mo | $350,000 | $292 | 55 |
| 900 E Mikkelsen Rd | 0.51mi | 3/2.0 (+1) | 1,026 (-11%) | 15mo | $328,000 | $320 | 41 |
Match score weights: distance 35% · size 25% · config 20% · recency 20%. Top-matched comps best support the ARV.
Projected returns pro-forma
-3.0% appreciation · 3.0% rent growth · sell at horizon
- IRR
- -26.1%
- Equity multiple
- 0.12×
- Total profit
- $-62,637
- Equity at exit
- $37,872
- IRR
- -22.9%
- Equity multiple
- -0.16×
- Total profit
- $-82,300
- Equity at exit
- $21,961
Cash invested: $71,120 (down + closing). Projections, not guarantees.
Landlord ↔ Tenant lean methodology
- Overall (STATE)
- 28 Tenant-Leaning
- State Washington
- 28 Tenant-Leaning · D+8
- County
- — inherits STATE
- City
- — inherits STATE
ZIP-level market 98584
- Active inventory
- 439
- Price-to-rent
- 12.7×
Monthly cashflow live
- Estimated rent
- $1,669 medium interval (Pro) →
- Mortgage (P&I)
- −$1,332
- Tax from tax record
- −$90 /mo · $1,076/yr
- Insurance
- −$106
- HOA
- −$128
- Vacancy / Maint / Mgmt
- −$351
- Net cashflow
- $-337
Break-even live
UW: 25.0% down · 7.5% · 30yr · 1.5% tax · 5.0% vac · 8.0% maint · 8.0% mgmt
Financing live
Cash to close
- Down payment
- $63,500
- Closing costs
- $7,620
- Reserves months
- —
- Total cash needed
- —
Loan-product check · same deal, 3 products live
Conventional
25% down · 7.5% · 30yr
- Down + closing
- —
- Monthly P&I
- —
- Monthly cashflow
- —
- DSCR
- —
- Eligible?
- —
Personal DTI + credit; lowest rate.
DSCR
20% down · 8.5% · 30yr
- Down + closing
- —
- Monthly P&I
- —
- Monthly cashflow
- —
- DSCR
- —
- Eligible?
- —
No personal income docs; deal must DSCR.
Hard money
10% down · 12.0% · 12mo
- Down + closing
- —
- Monthly P&I
- —
- Monthly cashflow
- —
- DSCR
- —
- Eligible?
- —
Short-term bridge; refi at stabilization.
HOA detail
- Monthly dues
- $128 · $1,536/yr
Listing history 19 events
-
2026-06-07status $254,000 Pending 65 DOM
-
2026-06-03days on market $254,000 Active 65 DOM
-
2026-06-02days on market $254,000 Active 64 DOM
-
2026-06-01days on market $254,000 Active 63 DOM
-
2026-05-31days on market $254,000 Active 62 DOM
-
2026-05-30days on market $254,000 Active 61 DOM
-
2026-04-11price $254,000
-
2026-03-30$259,950 Active
-
2023-05-26soldstatus $120,000 Closed
-
2023-04-24status Pending
-
2023-04-17price $156,900
-
2023-03-08$159,900 Active
-
2022-11-10soldstatus $120,000 Closed
-
2022-11-04status Pending
-
2022-10-24$129,900 Active
-
2008-06-17soldstatus $45,000
-
2008-06-17soldstatus $45,000
-
2008-05-19historical
-
2008-03-23$58,000
ⓘ Source: listings_history table (triggers on properties + properties_extension) + one-shot
backfill from property_details.listing_events for pre-trigger history.
Tax reassessment forecast WA · Resets to sale price
- Current annual tax
- $1,076 · $90/mo
- Projected year-2 tax
- $2,489 · $207/mo
- Expected delta
- +$1,414/yr (+$118/mo · 131.4%)
ⓘ Screening estimate from a state-policy table — verify with the county assessor before closing.
Climate risk First Street
- Flood 1/10 Low FEMA zone X (unshaded) · 0% chance over 30 yrs
- Wildfire 3/10 Moderate
- Heat 3/10 Moderate 7 d/yr ≥88°F today · 14 d/yr by 30 yrs out
- Wind 1/10 Low
- Air quality 6/10 Major 7 unhealthy d/yr today · 7 by 30 yrs out
Nearby sold comps map
Loading sold comps map…
Walkable amenities ~0.75 mi
Loading nearby amenities…
Taxation est. · year 1
- Rental income
- $20,033
- − Mortgage interest
- −$14,228
- − Property taxes
- −$1,076
- − Insurance
- −$1,270
- − Repairs & maintenance
- −$1,603
- − Management
- −$1,603
- − HOA
- −$1,536
- − Depreciation
- −$7,389
- Taxable loss
- −$8,671
- Est. tax savings @ 24.0%
- +$2,081
- After-tax cash flow
- $-1,959/yr
For passive investors: Depreciation is non-cash, so a rental often shows a tax loss while cash-flowing — sheltering income. Rental losses are passive: they offset passive income freely, and up to $25,000/yr can offset ordinary (W-2) income if you actively participate and your MAGI is under $100k (phasing out to $0 by $150k); unused losses carry forward. On sale, claimed depreciation is recaptured at up to 25%, and gains may owe capital-gains tax (a 1031 exchange can defer both). Figures are a year-1 estimate at your 24.0% rate — not tax advice; consult a CPA.
Schools (NCES district)
- District
- Pioneer School District
- NCES district ID
- 5306750
- Math proficiency
- 37% ▼ -6.00%
- Reading proficiency
- 51% ▼ -2.00%
- Median HH income
- $51,151
- Composite
- 40.15/100
- National rank
- #7840
- State rank
- #188 of 291 in WA
Livability — Shelton
- Score
- 73/100
- State rank
- #203
- US rank
- #5586
Category grades
Schools grade is shown separately in the Schools card above.
Census & demographics
- County
- Mason County · 40,606 people
- City population
- 40,606
- Metro
- Shelton, WA
- Population (ZIP)
- 40,606
- Household income
- $78,610
- Rent vs Own
- Severe rent burden
- 687.0
Population outlook (Mason County) Hauer SSP2
- Today (2025)
- 60,005 people
- By 2030
- 58,567 · -2.4%
- By 2040
- 54,735 · -8.8%
- By 2050
- 51,470 · -14.2%
- By 2075
- 46,276 · -22.9%
- By 2100
- 39,883 · -33.5%
Race, ethnicity, and origin ACS 2023
- Neighborhood character
- Predominantly White (72%)
- Race & ethnicity
- White 72% Hispanic / Latino 15% Two or more races 11% Native American 3%
- Hispanic origin (detail)
- Mexican 8%
- Common ancestry
- Portuguese 4% Slovak 3% Italian 2%
- Foreign-born
- 8% · Canada
- Languages at home
- 88% English-only · Spanish 10%
Political lean MEDSL · Mason
- 2024 margin
- Toss-up / Even · D 47.2% · R 49.7% · Other 3.2%
- 2008→2024 swing
- -11.2pp toward R · 2008: 8.7pp · 2024: -2.5pp
- All cycles
- 2024: R+2.5 2020: R+3.9 2016: R+6.0 2012: D+6.9 2008: D+8.7
Not yet ingested
- Civics
- —
Market trends
- HPI YoY
- ▼ -232.42%
- Current HPI
- 199.0698
- Rent YoY
- —
- Metro
- Shelton, WA
- State GDP YoY
- ▲ 4.65%
- F500 in state
- 22
Industry mix (Fortune 500 HQ in WA)
| Industry | F500 HQs | Revenue |
|---|---|---|
| Retail | 2 | $269B |
|
||
| Technology / Retail | 1 | $638B |
|
||
| Technology | 1 | $245B |
|
||
| Telecommunications | 1 | $38B |
|
||
| Food / Beverage | 1 | $36B |
|
||
| Automotive / Trucks | 1 | $34B |
|
||
Price history
+337.9% since first listed13 events — show timeline
- 2026-04-11 Price Changed $254,000 NWMLS as Distributed by MLS Grid
- 2026-03-30 Listed $259,950 NWMLS as Distributed by MLS Grid
- 2023-05-26 Sold (MLS) $120,000 NWMLS as Distributed by MLS Grid
- 2023-04-24 Pending — NWMLS as Distributed by MLS Grid
- 2023-04-17 Price Changed $156,900 NWMLS as Distributed by MLS Grid
- 2023-03-08 Listed $159,900 NWMLS as Distributed by MLS Grid
- 2022-11-10 Sold (MLS) $120,000 NWMLS as Distributed by MLS Grid
- 2022-11-04 Pending — NWMLS as Distributed by MLS Grid
- 2022-10-24 Listed $129,900 NWMLS as Distributed by MLS Grid
- 2008-06-17 Sold (Public Records) $45,000 Public Records
- 2008-06-17 Sold (MLS) $45,000 NWMLS as Distributed by MLS Grid
- 2008-05-19 Delisted — NWMLS as Distributed by MLS Grid
- 2008-03-23 Listed $58,000 NWMLS as Distributed by MLS Grid
Property tax history
+4.5%/yrLatest (2026): $1,076 · +12.7% YoY. Source: county tax records.
Cash-flow waterfall
monthlySold comps — $/sqft
last 12 mo · ≤1 miLoading sold comps…