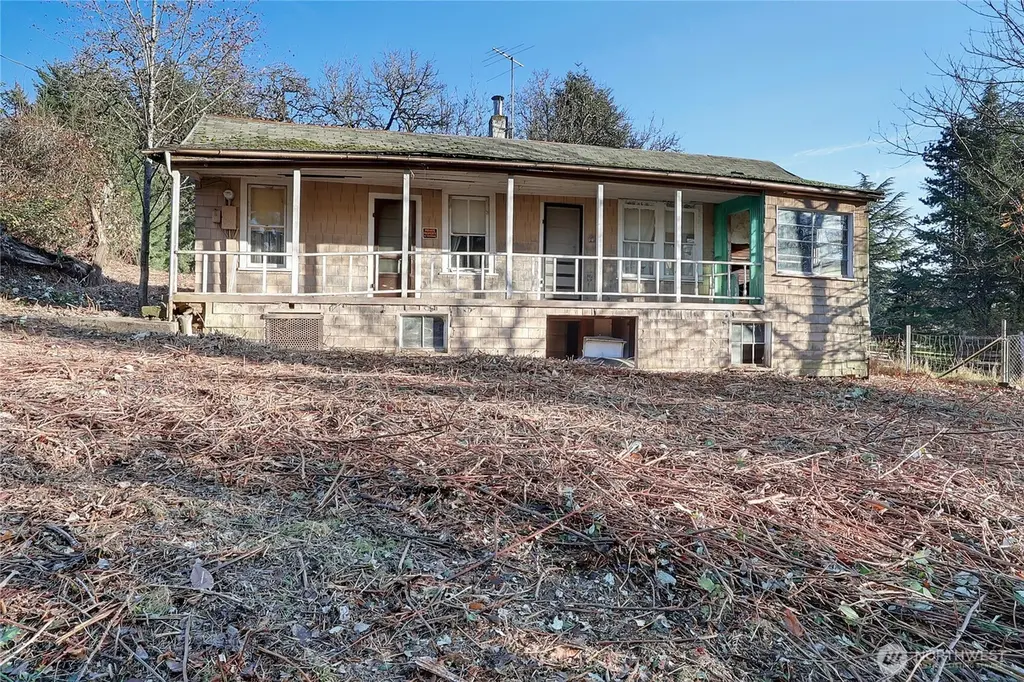
32910 5th Ave · Black Diamond, WA
Flood risk 1/10 · Minimal
- FEMA flood zone
- X (unshaded)
- Chance of flooding over 30 yrs
- 0.0%
- Est. flood insurance / yr
- $507 – $1,088
Fire risk 3/10 · Minor
- Est. fire insurance / yr
- $604 – $1,122
Heat risk 2/10 · Minimal
- Hot days now (above 87°F)
- 7 days/yr
- Hot days in 30 yrs
- 15 days/yr
Wind risk 1/10 · Minimal
- Chance of severe wind over 30 yrs
- —
Air-quality risk 8/10 · Major
- Unhealthy air days now
- 11 days/yr
- Unhealthy air days in 30 yrs
- 17 days/yr
Risk factors via First Street. Map © Google.
Why this score? — see what drove the C grade
The composite is a weighted blend of 9 inputs, each scored 0–100. Each bar is that input's sub-score; the figure is the points it added to the 100-point composite (weight × sub-score).
- Cash flow +22.2/30.0
- ARV discount +7.5/15.0
- DSCR +7.1/10.0
- Schools +5.5/10.0
- 1% rule +5.2/10.0
- Livability +4.0/5.0
- Rent growth +3.1/5.0
- Condition / age +2.5/5.0
- Appreciation +0.0/10.0
$295,000
🖨 Deal sheet 📄 Offer letter ✓ Due diligence
Listing remarks
LOOK! DEAL of the CENTURY! THERE IS NO OTHER PROPERTY QUITE LIKE THIS ONE! Your next project awaits! This FIXER on 1.06 ACRES is right in town, in BLACK DIAMOND & is ready for your NEW vision! This is a true Fixer Home on a Large lot at the end of a dead end street is zoned R4 with Power, City Sewer, City Water all on the lot. The Driveway begins where 5th Ave appears to end. Seller had a Survey & a Critical Areas Report done in 2021. There is a Partial Mountain View from part of the property - view from the upper part of the property. This Home has 3 Bedrooms, 1 Full Bathroom and Large Living, Dining and Kitchen. Lifting the House and adding some room to the Basement will offer
Key facts
- 1.06 acres
- Zoned r4
- 1.06 acre lot
Tags
Property features AI
Finance
- Other: Property has view; Lot size approximately 1.06 acres
- Financial info: Listing accepts cash and rehab loan financing
Exterior
- Parking: Off-street parking; RV parking
- Utilities: Electric energy source; Public water (City of Black Diamond); Sewer connected (City of Black Diamond); Power provided by PSE
- Home design: Single-family residence; One story with basement; Main-level entry; Built on lot; Residential fixer condition
- Construction: Wood construction; Composition roof
- Exterior features: Wood exterior; Wood products; Paved and secluded lot; RV parking available; Off-street parking
Interior
- Bedrooms: Three bedrooms (all on the main level)
- Flooring: Vinyl plank; Carpet
- Bathrooms: One full bathroom (on the main level)
- Heating & cooling: Wall furnace; No air conditioning listed
- Interior features: Unfinished basement; Vinyl plank and carpet flooring; Wall furnace heating; No cooling listed; Has a view
Neighborhood map
What this means for you Summary
Snapshot
- This is a 3-bed/1.0-bath single-family listed at $295k.
Deal economics
- At list price, monthly cash flow is $481 ($6k/yr) — positive.
- The deal already cash-flows at list — no discount required.
- Meets the 1% rule at list price ($3k rent vs $295k).
- Recommended offer: $291k (1.5% below list) — sets the bar for market timing.
- Cap rate 8.2% vs local median 2.2% in Black Diamond — top-decile yield for the area; either an underpriced asset or a hidden risk that comps aren't pricing in. Stress-test before assuming the spread holds.
Location & tenants
- Location reads 80/100 on livability (#87 in WA, #1,663 nationally) — a professional / high-income tenant draw. Strengths: crime A+, employment A+, housing A+; Watch: amenities D+, cost of living F.
- Enumclaw School District (suburban): math 54% / reading 68% proficiency, ranked #46 of 291 in WA (top 16%) — acceptable for families but not a draw, mixed tenant base, ~2y average lease.
- Zoned schools: Enumclaw Sr High School (1,339 students, 28% FRL) — zoned schools at 28% FRL track the district average.
- Market conditions: Rents rising (+2.2%/yr); 193 active listings in the ZIP; 1 comparable units currently listed for rent nearby; high-income renter base; 10,555 units permitted in King County in 2024 (7,119 in 5+ unit buildings).
Forward outlook
- Local home prices are declining (-3.0%/yr); year-one equity from $2k of loan paydown is wiped out by about $9k of value loss. Plan a longer hold.
- King County population projected at +44% by 2050 — long-run rental-demand tailwind backs the buy-and-hold thesis.
Negotiation context
- It's been on market 16 days — a 2% lower offer ($291k) is reasonable based on typical stale-listing flexibility.
- 5 sale attempts since 22y ago with the ask held roughly flat each time — persistent listings suggest the price (not the market) is what's stuck; bring a comps-based counter.
Risks & watch-outs
- Watch-outs: built in 1900 — expect roof / HVAC / electrical / plumbing capex.
Questions for the listing agent
- Built in 1900 — when were the roof, HVAC, electrical panel, plumbing, and water heater last replaced?
- Is there a deadline driving the sale (1031 exchange, divorce, estate, relocation)? That informs how much negotiation room exists.
- Schools are B-rated — typically a magnet for longer-tenancy family renters. What's the average tenant stay here, and is there a school-zone premium baked into asking?
- What's the average days-on-market for RENTAL listings here right now (not sales)? A rising rental-DOM trend means longer vacancies and softer asking-rent achievability than the comps imply.
- What's the recent tenant-quality profile in this submarket — average credit score on applications, eviction rate, late-payment / NSF rate, and stable-employment percentage? A property-management company in the area should have these aggregated.
- How much new for-sale + rental construction is in the pipeline within 1–3 miles? Heavy new supply typically softens prices + rents 12–24 months out; constrained supply supports both.
Investment metrics
- 1% rule
- 1.02% ✓
- Cap rate
- 8.25%
- Cash-on-cash
- 6.98%
- DSCR
- 1.31
- GRM
- 8.2
CMA / ARV
- ARV (median comp)
- $660,216
- List price
- $295,000
- Delta
- -55.32%
- Verdict
- UNDERPRICED
- Comps
- 20 within 1.0 mi
Show comp detail 3 sales within ~0.75 mi
| Address | Dist | Beds/Ba | Sqft | Sold | Price | $/sf | Match |
|---|---|---|---|---|---|---|---|
| 32701 5th Ave | 0.15mi | 2/1.0 (-1) | 1,260 (+7%) | 15mo | $475,000 | $377 | 65 |
| 25810 Lawson St | 0.35mi | 2/1.0 (-1) | 1,100 (-7%) | 15mo | $430,000 | $391 | 55 |
| 26202 Lawson St | 0.65mi | 2/1.0 (-1) | 1,100 (-7%) | 4mo | $525,000 | $477 | 50 |
Match score weights: distance 35% · size 25% · config 20% · recency 20%. Top-matched comps best support the ARV.
Projected returns pro-forma
-3.0% appreciation · 2.21% rent growth · sell at horizon
- IRR
- -6.5%
- Equity multiple
- 0.76×
- Total profit
- $-19,606
- Equity at exit
- $43,985
- IRR
- 2.2%
- Equity multiple
- 1.15×
- Total profit
- $12,592
- Equity at exit
- $25,506
Cash invested: $82,600 (down + closing). Projections, not guarantees.
Landlord ↔ Tenant lean methodology
- Overall (STATE)
- 28 Tenant-Leaning
- State Washington
- 28 Tenant-Leaning · D+8
- County
- — inherits STATE
- City
- — inherits STATE
ZIP-level market 98010
- Home prices YoY
- -19.9%
- Rents YoY
- 2.2%
- Active inventory
- 193
- Price-to-rent
- 8.2×
Monthly cashflow live
- Estimated rent
- $3,007 medium interval (Pro) →
- Mortgage (P&I)
- −$1,547
- Tax from tax record
- −$225 /mo · $2,700/yr
- Insurance
- −$123
- HOA
- −$0
- Vacancy / Maint / Mgmt
- −$631
- Net cashflow
- $481
Break-even live
UW: 25.0% down · 7.5% · 30yr · 1.5% tax · 5.0% vac · 8.0% maint · 8.0% mgmt
Financing live
Cash to close
- Down payment
- $73,750
- Closing costs
- $8,850
- Reserves months
- —
- Total cash needed
- —
Loan-product check · same deal, 3 products live
Conventional
25% down · 7.5% · 30yr
- Down + closing
- —
- Monthly P&I
- —
- Monthly cashflow
- —
- DSCR
- —
- Eligible?
- —
Personal DTI + credit; lowest rate.
DSCR
20% down · 8.5% · 30yr
- Down + closing
- —
- Monthly P&I
- —
- Monthly cashflow
- —
- DSCR
- —
- Eligible?
- —
No personal income docs; deal must DSCR.
Hard money
10% down · 12.0% · 12mo
- Down + closing
- —
- Monthly P&I
- —
- Monthly cashflow
- —
- DSCR
- —
- Eligible?
- —
Short-term bridge; refi at stabilization.
Rent comps 1 comps
| Address | Beds | Baths | Sqft | Rent | $/sqft | DOM | Units | Dist |
|---|---|---|---|---|---|---|---|---|
| 33820 Buckeye Ave SE Black Diamond, WA | 2.0 | 2.0 | 1340 | $3,150 | $2.35 | 44d | 1 | 1.28mi |
Listing history 13 events
-
2026-05-13$295,000 Active
-
2020-06-26soldstatus $290,000 Sold
-
2020-06-26soldstatus $290,000 Sold
-
2020-06-26soldstatus $290,000
-
2020-06-18status Pending
-
2020-06-18status Pending
-
2020-06-16$279,000 Active
-
2020-06-16$279,000 Active
-
2019-12-27soldstatus $160,000
-
2005-06-22soldstatus $105,000
-
2004-05-31
-
2004-05-31
-
2001-03-01soldstatus $85,000
ⓘ Source: listings_history table (triggers on properties + properties_extension) + one-shot
backfill from property_details.listing_events for pre-trigger history.
Tax reassessment forecast WA · Resets to sale price
- Current annual tax
- $2,700 · $225/mo
- Projected year-2 tax
- $2,891 · $241/mo
- Expected delta
- +$191/yr (+$16/mo · 7.1%)
ⓘ Screening estimate from a state-policy table — verify with the county assessor before closing.
Climate risk First Street
- Flood 1/10 Low FEMA zone X (unshaded) · 0% chance over 30 yrs
- Wildfire 3/10 Moderate
- Heat 2/10 Low 7 d/yr ≥87°F today · 15 d/yr by 30 yrs out
- Wind 1/10 Low
- Air quality 8/10 Severe 11 unhealthy d/yr today · 17 by 30 yrs out
Nearby sold comps map
Loading sold comps map…
Walkable amenities ~0.75 mi
Loading nearby amenities…
Taxation est. · year 1
- Rental income
- $36,084
- − Mortgage interest
- −$16,525
- − Property taxes
- −$2,700
- − Insurance
- −$1,475
- − Repairs & maintenance
- −$2,887
- − Management
- −$2,887
- − Depreciation
- −$8,582
- Taxable income
- $1,029
- Est. tax owed @ 24.0%
- −$247
- After-tax cash flow
- $5,520/yr
For passive investors: Depreciation is non-cash, so a rental often shows a tax loss while cash-flowing — sheltering income. Rental losses are passive: they offset passive income freely, and up to $25,000/yr can offset ordinary (W-2) income if you actively participate and your MAGI is under $100k (phasing out to $0 by $150k); unused losses carry forward. On sale, claimed depreciation is recaptured at up to 25%, and gains may owe capital-gains tax (a 1031 exchange can defer both). Figures are a year-1 estimate at your 24.0% rate — not tax advice; consult a CPA.
Schools (NCES district)
- District
- Enumclaw School District
- NCES district ID
- 5300001
- Math proficiency
- 54% ▼ -1.00%
- Reading proficiency
- 68% ▬ 0.00%
- Median HH income
- $68,441
- Composite
- 55.21/100
- National rank
- #2736
- State rank
- #46 of 291 in WA
Livability — Black Diamond
- Score
- 80/100
- State rank
- #87
- US rank
- #1663
Category grades
Schools grade is shown separately in the Schools card above.
Census & demographics
- Census place
- Black Diamond, WA
- County
- King County · 2,251,916 people
- City population
- 6,857
- Metro
- Seattle-Tacoma-Bellevue, WA
- Population (ZIP)
- 6,857
- Household income
- $142,048
- Rent vs Own
- Severe rent burden
- 14.0
Population outlook (King County) Hauer SSP2
- Today (2025)
- 2,576,485 people
- By 2030
- 2,803,316 · +8.8%
- By 2040
- 3,255,921 · +26.4%
- By 2050
- 3,706,444 · +43.9%
- By 2075
- 4,746,063 · +84.2%
- By 2100
- 5,407,730 · +109.9%
Race, ethnicity, and origin ACS 2023
- Neighborhood character
- Predominantly White (74%)
- Race & ethnicity
- White 74% Two or more races 12% Asian 10% Hispanic / Latino 9%
- Hispanic origin (detail)
- Mexican 2%
- Common ancestry
- Portuguese 4% Italian 4% Slovak 4%
- Foreign-born
- 14% · Canada, Jamaica, South Korea
- Languages at home
- 87% English-only · Spanish 5% Other Indo-European 4% Tagalog/Filipino 1%
Political lean MEDSL · King
- 2024 margin
- Solid D (+51.7) · D 74.2% · R 22.5% · Other 3.4%
- 2008→2024 swing
- +9.6pp toward D · 2008: 42.1pp · 2024: 51.7pp
- All cycles
- 2024: D+51.7 2020: D+52.7 2016: D+50.4 2012: D+39.9 2008: D+42.1
Not yet ingested
- Civics
- —
Market trends
- HPI YoY
- ▼ -80.21%
- Current HPI
- 322.0508
- Rent YoY
- ▲ 2.21%
- Metro
- Seattle-Tacoma-Bellevue, WA
- State GDP YoY
- ▲ 4.65%
- F500 in state
- 22
Industry mix (Fortune 500 HQ in WA)
| Industry | F500 HQs | Revenue |
|---|---|---|
| Retail | 2 | $269B |
|
||
| Technology / Retail | 1 | $638B |
|
||
| Technology | 1 | $245B |
|
||
| Telecommunications | 1 | $38B |
|
||
| Food / Beverage | 1 | $36B |
|
||
| Automotive / Trucks | 1 | $34B |
|
||
Price history
+247.1% since first listed14 events — show timeline
- 2026-05-29 Pending — NWMLS as Distributed by MLS Grid
- 2026-05-13 Listed $295,000 NWMLS as Distributed by MLS Grid
- 2020-06-26 Sold (Public Records) $290,000 Public Records
- 2020-06-26 Sold (MLS) $290,000 NWMLS as Distributed by MLS Grid
- 2020-06-26 Sold (MLS) $290,000 NWMLS as Distributed by MLS Grid
- 2020-06-18 Pending — NWMLS as Distributed by MLS Grid
- 2020-06-18 Pending — NWMLS as Distributed by MLS Grid
- 2020-06-16 Listed $279,000 NWMLS as Distributed by MLS Grid
- 2020-06-16 Listed $279,000 NWMLS as Distributed by MLS Grid
- 2019-12-27 Sold (Public Records) $160,000 Public Records
- 2005-06-22 Sold (Public Records) $105,000 Public Records
- 2004-05-31 Listed — NWMLS as Distributed by MLS Grid
- 2004-05-31 Listed — NWMLS as Distributed by MLS Grid
- 2001-03-01 Sold (Public Records) $85,000 Public Records
Property tax history
+4.2%/yrLatest (2025): $2,700 · +2.4% YoY. Source: county tax records.
Cash-flow waterfall
monthlySold comps — $/sqft
last 12 mo · ≤1 miLoading sold comps…