 🏷️ Likely Rental
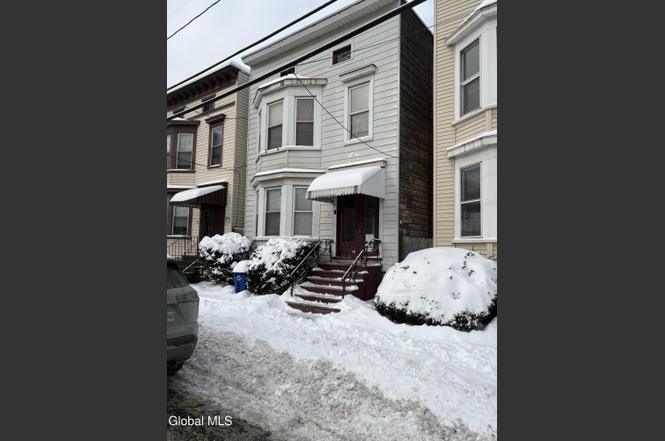
71 Quail St · Albany, NY
Flood risk 1/10 · Minimal
- FEMA flood zone
- X (unshaded)
- Chance of flooding over 30 yrs
- 0.0%
- Est. flood insurance / yr
- $473 – $860
Fire risk 1/10 · Minimal
- Est. fire insurance / yr
- $691 – $1,283
Heat risk 4/10 · Minor
- Hot days now (above 97°F)
- 7 days/yr
- Hot days in 30 yrs
- 16 days/yr
Wind risk 3/10 · Minor
- Chance of severe wind over 30 yrs
- 6.0%
Air-quality risk 1/10 · Minimal
- Unhealthy air days now
- 0 days/yr
- Unhealthy air days in 30 yrs
- 0 days/yr
Risk factors via First Street. Map © Google.
Why this score? — see what drove the B+ grade
The composite is a weighted blend of 9 inputs, each scored 0–100. Each bar is that input's sub-score; the figure is the points it added to the 100-point composite (weight × sub-score).
- Cash flow +30.0/30.0
- ARV discount +15.0/15.0
- 1% rule +10.0/10.0
- DSCR +10.0/10.0
- Livability +4.0/5.0
- Rent growth +3.8/5.0
- Schools +3.2/10.0
- Condition / age +2.5/5.0
- Appreciation +0.0/10.0
$149,900
🖨 Deal sheet 📄 Offer letter ✓ Due diligence
Multi-family units
County records classify this as Multi-Family (2-4 Unit). Listing-text estimate: 2 units. confirmed
Listing remarks MLS
.BEAUTIFUL, WELL MAINTAINED HOME. SHOWS WELL. ORIGINAL WOODWORK, UPDATED KITCHENS, AND NEWER ROOF.LONG TERM TENANT DOWN - A RELATIVE THAT'S WHY RENT IS SO LOW. TAXES W / BASIC STAR. Excellent Condition
Key facts
- Second-floor unit
- Ornate fireplace
- Two-family home
Tags
Neighborhood map
What this means for you Summary
Snapshot
- This is a 2 × 2-bed/1.5-bath units multifamily listed at $150k.
Deal economics
- At list price, monthly cash flow is $1k ($18k/yr) — positive. Per door: $739/mo.
- The deal already cash-flows at list — no discount required.
- Meets the 1% rule at list price ($3k rent vs $150k).
- Cap rate 18.1% vs local median 5.7% in Albany — top-decile yield for the area; either an underpriced asset or a hidden risk that comps aren't pricing in. Stress-test before assuming the spread holds.
Location & tenants
- Location reads 79/100 on livability (#129 in NY, #2,083 nationally) — a middle-class / working-renter tenant base. Strengths: amenities A+, commute A+, housing A+; Watch: employment C-, crime F.
- Albany City School District (urban): math 37% / reading 40% proficiency, ranked #543 of 590 in NY (top 92%) — families likely to look elsewhere, expect single-tenant / working-renter base with shorter leases; 66% free/reduced lunch — lower-income household profile, screen leases tightly.
- Zoned schools: Albany High School (math 74% / reading 67%, grade B+, #710 of 1,100 statewide, top 65%, 2,676 students, 69% FRL) — zoned schools at 69% FRL track the district average.
- Zoned-school proficiency averages 70% at this address vs 38% district-wide (+32 pts) — the actual schools serving this property are materially stronger than the Albany City School District average implies; a family-tenant draw the district grade alone would hide.
- Market conditions: Rents rising fast (+5.4%/yr); 89 active listings in the ZIP; 1 comparable units currently listed for rent nearby; lower-income renter base — watch delinquency; 675 units permitted in Albany County in 2024 (451 in 5+ unit buildings).
- At $3,315/mo this rent would consume 96% of the median local household income ($42k/yr) (locally 2035% of renters already pay >50% of income on rent) — very limited rent-growth headroom before tenants either downsize or default.
Forward outlook
- Local home prices are declining (-3.0%/yr); year-one equity from $1k of loan paydown is wiped out by about $4k of value loss. Plan a longer hold.
- Albany County population projected at +9% by 2050 — modest demand growth; plan on rents tracking national, not racing it.
- At projected returns (-3.0% appreciation + 5.4% rent growth), your $42k cash investment doubles in ~3 years — after that, you're playing with house money.
Negotiation context
- Only 11 days on market — expect competitive offers; lowballing is unlikely to land.
- 2 sale attempts since 17y ago with the ask held roughly flat each time — persistent listings suggest the price (not the market) is what's stuck; bring a comps-based counter.
- Current owner paid $75k; list at $150k implies a 100% gain — meaningful room to come down on a strong offer.
Risks & watch-outs
- Watch-outs: built in 1900 — expect roof / HVAC / electrical / plumbing capex.
Questions for the listing agent
- Can we see the unit-by-unit rent roll, current vacancy, and any below-market leases? What's the average tenancy length?
- What capital expenditures (roof, boiler, parking lot, exteriors) have been made in the last 5 years, and what's planned in the next 2?
- Built in 1900 — when were the roof, HVAC, electrical panel, plumbing, and water heater last replaced?
- Is there a deadline driving the sale (1031 exchange, divorce, estate, relocation)? That informs how much negotiation room exists.
- Crime grade is F in this area — have there been break-ins, vandalism, or insurance claims at this property in the last 3 years? What carrier currently insures it and at what premium?
- What's the average days-on-market for RENTAL listings here right now (not sales)? A rising rental-DOM trend means longer vacancies and softer asking-rent achievability than the comps imply.
- What's the recent tenant-quality profile in this submarket — average credit score on applications, eviction rate, late-payment / NSF rate, and stable-employment percentage? A property-management company in the area should have these aggregated.
- How much new apartment / multifamily construction is in the pipeline within 1–3 miles? Heavy new supply (>2% of stock underway) typically softens rents 12–24 months out; light construction supports rent growth.
Investment metrics
- 1% rule
- 2.21% ✓
- Cap rate
- 18.13%
- Cash-on-cash
- 42.28%
- DSCR
- 2.88
- GRM
- 3.8
CMA / ARV
- ARV (on-the-fly)
- $288,288
- Comps found
- 12
Show comp detail 12 sales within ~0.75 mi
| Address | Dist | Beds/Ba | Sqft | Sold | Price | $/sf | Match |
|---|---|---|---|---|---|---|---|
| 534 1st St | 0.09mi | 6/2.0 | 2,464 (0%) | 0mo | $175,000 | $71 | 95 |
| 189-B Quail St | 0.46mi | 6/2.0 | 2,512 (+2%) | 3mo | $185,000 | $74 | 73 |
| 24 Kent St | 0.35mi | 6/2.0 | 2,364 (-4%) | 4mo | $210,000 | $89 | 73 |
| 10 Wilkins Ave | 0.46mi | 6/2.0 | 2,294 (-7%) | 1mo | $280,000 | $122 | 66 |
| 558 Washington Ave | 0.36mi | 7/3.0 (+1) | 2,562 (+4%) | 3mo | $325,000 | $127 | 65 |
| 459 Hudson Ave | 0.57mi | 6/2.0 | 2,584 (+5%) | 3mo | $235,000 | $91 | 63 |
| 362 Clinton Ave | 0.54mi | 7/4.0 (+1) | 2,490 (+1%) | 2mo | $270,000 | $108 | 59 |
| 466 Hudson Ave | 0.60mi | 6/2.0 | 2,712 (+10%) | 3mo | $235,000 | $87 | 53 |
| 18.5 Dudley Hts | 0.73mi | 6/2.0 | 2,200 (-11%) | 0mo | $289,900 | $132 | 48 |
| 391 Washington Ave | 0.41mi | 7/4.0 (+1) | 2,217 (-10%) | 5mo | $350,000 | $158 | 47 |
| 97 Lark St | 0.73mi | 6/3.0 | 2,214 (-10%) | 4mo | $259,000 | $117 | 41 |
| 531 Hamilton St | 0.67mi | 5/3.0 (-1) | 2,112 (-14%) | 5mo | $284,750 | $135 | 32 |
Match score weights: distance 35% · size 25% · config 20% · recency 20%. Top-matched comps best support the ARV.
Projected returns pro-forma
-3.0% appreciation · 5.37% rent growth · sell at horizon
- IRR
- 41.8%
- Equity multiple
- 2.86×
- Total profit
- $78,095
- Equity at exit
- $22,351
- IRR
- 49.1%
- Equity multiple
- 6.35×
- Total profit
- $224,594
- Equity at exit
- $12,961
Cash invested: $41,972 (down + closing). Projections, not guarantees.
Landlord ↔ Tenant lean methodology
- Overall (STATE)
- 15 Strongly Tenant-Friendly
- State New York
- 15 Strongly Tenant-Friendly · D+10
- County
- — inherits STATE
- City
- — inherits STATE
ZIP-level market 12206
- Home prices YoY
- -9.9%
- Rents YoY
- 5.4%
- Active inventory
- 89
- Price-to-rent
- 7.5×
Monthly cashflow live
- Estimated rent
- $3,315 high interval (Pro) →
- Mortgage (P&I)
- −$786
- Tax from tax record
- −$292 /mo · $3,499/yr
- Insurance
- −$62
- HOA
- −$0
- Vacancy / Maint / Mgmt
- −$696
- Net cashflow
- $1,479
Break-even live
2-unit breakdown (identical units grouped — click to expand)
| Units | Beds | Baths | Est. rent |
|---|---|---|---|
| 2× units | 2 | 1.5 | $3,316 |
| #1 | 2 | 1.5 | $1,658 |
| #2 | 2 | 1.5 | $1,658 |
| Total (2 units) | $3,315 | ||
UW: 25.0% down · 7.5% · 30yr · 1.5% tax · 5.0% vac · 8.0% maint · 8.0% mgmt
Financing live
Cash to close
- Down payment
- $37,475
- Closing costs
- $4,497
- Reserves months
- —
- Total cash needed
- —
Loan-product check · same deal, 3 products live
Conventional
25% down · 7.5% · 30yr
- Down + closing
- —
- Monthly P&I
- —
- Monthly cashflow
- —
- DSCR
- —
- Eligible?
- —
Personal DTI + credit; lowest rate.
DSCR
20% down · 8.5% · 30yr
- Down + closing
- —
- Monthly P&I
- —
- Monthly cashflow
- —
- DSCR
- —
- Eligible?
- —
No personal income docs; deal must DSCR.
Hard money
10% down · 12.0% · 12mo
- Down + closing
- —
- Monthly P&I
- —
- Monthly cashflow
- —
- DSCR
- —
- Eligible?
- —
Short-term bridge; refi at stabilization.
Rent comps 1 comps
| Address | Beds | Baths | Sqft | Rent | $/sqft | DOM | Units | Dist |
|---|---|---|---|---|---|---|---|---|
| 69 Winthrop Ave Albany, NY | 6.0 | 2.0 | 2800 | $2,795 | $1.00 | 23d | 1 | 1.26mi |
Listing history 6 events
-
2026-02-10status Pending
-
2026-01-29$149,900 Active
-
2010-01-06soldstatus $74,796
-
2009-12-29soldstatus $74,796 201-char remark
Show marketing remark (201 chars)
.BEAUTIFUL, WELL MAINTAINED HOME. SHOWS WELL. ORIGINAL WOODWORK, UPDATED KITCHENS, AND NEWER ROOF.LONG TERM TENANT DOWN - A RELATIVE THAT'S WHY RENT IS SO LOW. TAXES W / BASIC STAR. Excellent Condition
-
2009-11-01historical 201-char remark
Show marketing remark (201 chars)
.BEAUTIFUL, WELL MAINTAINED HOME. SHOWS WELL. ORIGINAL WOODWORK, UPDATED KITCHENS, AND NEWER ROOF.LONG TERM TENANT DOWN - A RELATIVE THAT'S WHY RENT IS SO LOW. TAXES W / BASIC STAR. Excellent Condition
-
2009-01-14$74,796 201-char remark
Show marketing remark (201 chars)
.BEAUTIFUL, WELL MAINTAINED HOME. SHOWS WELL. ORIGINAL WOODWORK, UPDATED KITCHENS, AND NEWER ROOF.LONG TERM TENANT DOWN - A RELATIVE THAT'S WHY RENT IS SO LOW. TAXES W / BASIC STAR. Excellent Condition
ⓘ Source: listings_history table (triggers on properties + properties_extension) + one-shot
backfill from property_details.listing_events for pre-trigger history.
Tax reassessment forecast NY · Partial reset (capped growth)
- Current annual tax
- $3,499 · $292/mo
- Projected year-2 tax
- $3,499 · $292/mo
- Expected delta
- $0/yr ($0/mo · 0.0%)
ⓘ Screening estimate from a state-policy table — verify with the county assessor before closing.
Climate risk First Street
- Flood 1/10 Low FEMA zone X (unshaded) · 0% chance over 30 yrs
- Wildfire 1/10 Low
- Heat 4/10 Moderate 7 d/yr ≥97°F today · 16 d/yr by 30 yrs out
- Wind 3/10 Moderate 6% chance of damaging wind over 30 yrs
- Air quality 1/10 Low 0 unhealthy d/yr today · 0 by 30 yrs out
Nearby sold comps map
Loading sold comps map…
Walkable amenities ~0.75 mi
Loading nearby amenities…
Taxation est. · year 1
- Rental income
- $39,780
- − Mortgage interest
- −$8,397
- − Property taxes
- −$3,499
- − Insurance
- −$750
- − Repairs & maintenance
- −$3,182
- − Management
- −$3,182
- − Depreciation
- −$4,361
- Taxable income
- $16,409
- Est. tax owed @ 24.0%
- −$3,938
- After-tax cash flow
- $13,806/yr
For passive investors: Depreciation is non-cash, so a rental often shows a tax loss while cash-flowing — sheltering income. Rental losses are passive: they offset passive income freely, and up to $25,000/yr can offset ordinary (W-2) income if you actively participate and your MAGI is under $100k (phasing out to $0 by $150k); unused losses carry forward. On sale, claimed depreciation is recaptured at up to 25%, and gains may owe capital-gains tax (a 1031 exchange can defer both). Figures are a year-1 estimate at your 24.0% rate — not tax advice; consult a CPA.
Schools (NCES district)
- District
- Albany City School District
- NCES district ID
- 3602460
- Math proficiency
- 37% ▲ 6.00%
- Reading proficiency
- 40% ▲ 7.00%
- Median HH income
- $40,568
- Composite
- 32.34/100
- National rank
- #5744
- State rank
- #543 of 590 in NY
Livability — Albany
- Score
- 79/100
- State rank
- #129
- US rank
- #2083
Category grades
Schools grade is shown separately in the Schools card above.
Census & demographics
- Census place
- Albany, NY
- County
- Albany County · 196,626 people
- City population
- 116,921
- Metro
- Albany-Schenectady-Troy, NY
- Population (ZIP)
- 14,572
- Household income
- $41,548
- Rent vs Own
- Severe rent burden
- 2035.0
Population outlook (Albany County) Hauer SSP2
- Today (2025)
- 320,794 people
- By 2030
- 327,401 · +2.1%
- By 2040
- 338,218 · +5.4%
- By 2050
- 348,467 · +8.6%
- By 2075
- 381,693 · +19.0%
- By 2100
- 393,809 · +22.8%
Race, ethnicity, and origin ACS 2023
- Neighborhood character
- Highly diverse neighborhood (Simpson 0.75)
- Race & ethnicity
- Black 38% White 27% Hispanic / Latino 15% Two or more races 12% Asian 10%
- Hispanic origin (detail)
- Puerto Rican 10% Dominican 1%
- Common ancestry
- Italian 2% Lithuanian 2% Romanian 1%
- Foreign-born
- 22% · Canada, China
- Languages at home
- 75% English-only · Spanish 10% Other Indo-European 5% Chinese 3%
Political lean MEDSL · Albany
- 2024 margin
- Strong D (+25.8) · D 62.9% · R 37.1%
- 2008→2024 swing
- -3.6pp toward R · 2008: 29.4pp · 2024: 25.8pp
- All cycles
- 2024: D+25.8 2020: D+31.4 2016: D+24.3 2012: D+31.0 2008: D+29.4
Not yet ingested
- Civics
- —
Market trends
- HPI YoY
- ▼ -30.24%
- Current HPI
- 275.8109
- Rent YoY
- ▲ 5.37%
- Metro
- Albany-Schenectady-Troy, NY
- State GDP YoY
- ▲ 2.60%
- F500 in state
- 92
Industry mix (Fortune 500 HQ in NY)
| Industry | F500 HQs | Revenue |
|---|---|---|
| Financial Services | 10 | $950B |
|
||
| Consumer Goods | 9 | $162B |
|
||
| Insurance | 4 | $225B |
|
||
| Telecommunications | 2 | $144B |
|
||
| Pharmaceuticals | 2 | $112B |
|
||
| Media / Entertainment | 2 | $69B |
|
||
Price history
+100.4% since first listed6 events — show timeline
- 2026-02-10 Pending — Global MLS
- 2026-01-29 Listed $149,900 Global MLS
- 2010-01-06 Sold (Public Records) $74,796 Public Records
- 2009-12-29 Sold (MLS) $74,796 Global MLS
- 2009-11-01 Listing Removed — Global MLS
- 2009-01-14 Listed $74,796 Global MLS
Property tax history
+2.3%/yrLatest (2025): $3,499 · -8.3% YoY. Source: county tax records.
Cash-flow waterfall
monthlySold comps — $/sqft
last 12 mo · ≤1 miLoading sold comps…