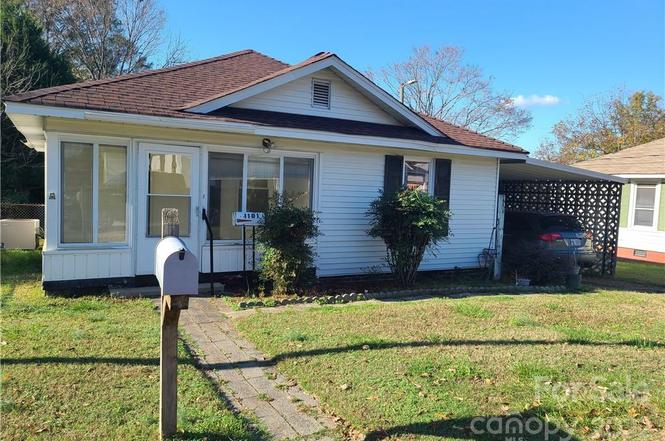
1101 Juniper Ave · Kannapolis, NC
Flood risk 1/10 · Minimal
- FEMA flood zone
- X (unshaded)
- Chance of flooding over 30 yrs
- 0.0%
- Est. flood insurance / yr
- $507 – $1,088
Fire risk 1/10 · Minimal
- Est. fire insurance / yr
- $906 – $1,684
Heat risk 6/10 · Moderate
- Hot days now (above 105°F)
- 7 days/yr
- Hot days in 30 yrs
- 17 days/yr
Wind risk 4/10 · Minor
- Chance of severe wind over 30 yrs
- 16.0%
Air-quality risk 2/10 · Minimal
- Unhealthy air days now
- 1 days/yr
- Unhealthy air days in 30 yrs
- 3 days/yr
Risk factors via First Street. Map © Google.
Why this score? — see what drove the C grade
The composite is a weighted blend of 9 inputs, each scored 0–100. Each bar is that input's sub-score; the figure is the points it added to the 100-point composite (weight × sub-score).
- Cash flow +20.5/30.0
- ARV discount +15.0/15.0
- DSCR +6.5/10.0
- 1% rule +4.9/10.0
- Livability +3.2/5.0
- Rent growth +3.1/5.0
- Schools +2.6/10.0
- Condition / age +2.5/5.0
- Appreciation +0.0/10.0
$180,000
🖨 Deal sheet (PDF) 📄 Offer letter ✓ Due diligence
Listing remarks MLS
Excellent investment opportunity 3 bedrooms, 2 baths Ranch with spacious backyard. Nome needs TLC. Conveniently located near downtown Kannapolis, ball park, shopping, restaurants.
Key facts
- Spacious backyard
- Near shopping
- Near restaurants
Tags
Property features AI
Finance
- HOA & community: No HOA
Exterior
- Parking: Driveway; 1-car carport
- Utilities: City water; Public sewer
- Home design: Single-family residential; Site-built construction; One story; Entry level: main
- Construction: Vinyl exterior; Crawl space foundation
- Exterior features: Gravel road; Publicly maintained road
Interior
- Kitchen: Electric oven
- Bedrooms: 3 bedrooms on the main level
- Bathrooms: 2 full bathrooms on the main level
- Heating & cooling: Baseboard heating (electric); Central air conditioning; Ceiling fans
- Interior features: 10 total rooms; Electric water heater
- Laundry & utility: Electric dryer hookup on the main level
Neighborhood map
What this means for you Summary
Snapshot
- This is a 3-bed/2.0-bath single-family listed at $180k.
Deal economics
- At list price, monthly cash flow is $238 ($3k/yr) — positive.
- The deal already cash-flows at list — no discount required.
- To meet the 1% rule (rent ≥ 1% of price), the offer needs to be $178k (0.9% below list).
- Recommended offer: $164k (9.0% below list) — sets the bar for market timing.
- Cap rate 7.9% vs local median 3.5% in Kannapolis — top-decile yield for the area; either an underpriced asset or a hidden risk that comps aren't pricing in. Stress-test before assuming the spread holds.
Location & tenants
- Location reads 64/100 on livability (#354 in NC) — a middle-class / working-renter tenant base. Strengths: cost of living A+, housing A+, crime B; Watch: employment D+, amenities F, commute F.
- Kannapolis City Schools (suburban): math 30% / reading 33% proficiency, ranked #141 of 178 in NC (top 79%) — families likely to look elsewhere, expect single-tenant / working-renter base with shorter leases; 63% free/reduced lunch — lower-income household profile, screen leases tightly.
- Zoned schools: North Kannapolis Elementary (math 37% / reading 27%, grade F, #908 of 1,410 statewide, top 67%, 269 students, 96% FRL); Kannapolis Middle (math 30% / reading 35%, grade F, #312 of 475 statewide, top 66%, 1,238 students, 100% FRL); A L Brown High (math 25% / reading 30%, grade F, #467 of 535 statewide, top 87%, 1,741 students, 100% FRL) — zoned schools average 98% FRL vs 63% district-wide (35 pts higher); higher-poverty schools than district average — tighter screening recommended.
- Market conditions: Rents rising (+2.5%/yr); 226 active listings in the ZIP; 23 comparable units currently listed for rent nearby; rentals at typical pace (median 17d on market — plan ~3-4 weeks tenant-placement turnaround); 592 units permitted in Rowan County in 2024 (5 in 5+ unit buildings).
Forward outlook
- Local home prices are declining (-3.0%/yr); year-one equity from $1k of loan paydown is wiped out by about $5k of value loss. Plan a longer hold.
- Rowan County population projected to shrink 6% by 2050 — rents likely to lag national; underwrite the cash flow, not the appreciation.
Negotiation context
- It's been on market 108 days — a 9% lower offer ($164k) is reasonable based on typical stale-listing flexibility.
- 2 sale attempts since 4y ago; this cycle's ask has dropped $15k (8%) from the opening price — seller is motivated, your offer sets the floor, not the list.
Risks & watch-outs
- Watch-outs: built in 1923 — expect roof / HVAC / electrical / plumbing capex.
- Climate carrying-cost: extreme-heat days projected 7→17/yr by 2055 (HVAC capex compounding) — expect insurance premiums to compound above CPI over the hold.
Questions for the listing agent
- It's been on market 108 days. Have you received any prior offers? Is the seller open to a 9% concession, seller financing, or rate buy-down credit?
- Built in 1923 — when were the roof, HVAC, electrical panel, plumbing, and water heater last replaced?
- Why hasn't it sold? Are there any deal-killer items the seller is aware of (foundation, flood, title, zoning, code violations)?
- Is there a deadline driving the sale (1031 exchange, divorce, estate, relocation)? That informs how much negotiation room exists.
- Schools are F-rated, which usually means shorter tenancies and higher turnover. Who's the typical renter profile here, and what's been the actual vacancy rate?
- What's the average days-on-market for RENTAL listings here right now (not sales)? A rising rental-DOM trend means longer vacancies and softer asking-rent achievability than the comps imply.
- What's the recent tenant-quality profile in this submarket — average credit score on applications, eviction rate, late-payment / NSF rate, and stable-employment percentage? A property-management company in the area should have these aggregated.
- How much new for-sale + rental construction is in the pipeline within 1–3 miles? Heavy new supply typically softens prices + rents 12–24 months out; constrained supply supports both.
Investment metrics
- 1% rule
- 0.99% ✗
- Cap rate
- 7.88%
- Cash-on-cash
- 5.67%
- DSCR
- 1.25
- GRM
- 8.4
CMA / ARV
- ARV (on-the-fly)
- $306,774
- Comps found
- 12
Show comp detail 12 sales within ~0.75 mi
| Address | Dist | Beds/Ba | Sqft | Sold | Price | $/sf | Match |
|---|---|---|---|---|---|---|---|
| 608 Poplar Ave | 0.33mi | 2/1.0 (-1) | 1,206 (-8%) | 1mo | $225,000 | $187 | 61 |
| 601 W 7th St | 0.46mi | 2/1.0 (-1) | 1,248 (-5%) | 2mo | $215,000 | $172 | 60 |
| 269 18th St W #10 | 0.69mi | 3/2.0 | 1,256 (-4%) | 2mo | $299,900 | $239 | 59 |
| 368 W 18th St | 0.66mi | 3/2.0 | 1,399 (+7%) | 1mo | $332,000 | $237 | 58 |
| 356 W 18th St | 0.66mi | 3/2.0 | 1,399 (+7%) | 1mo | $324,799 | $232 | 57 |
| 350 W 18th St | 0.66mi | 3/2.0 | 1,399 (+7%) | 1mo | $327,900 | $234 | 57 |
| 245 W 18th St | 0.65mi | 3/2.0 | 1,399 (+7%) | 2mo | $302,499 | $216 | 57 |
| 326 W 18th St | 0.66mi | 3/2.0 | 1,399 (+7%) | 2mo | $325,000 | $232 | 56 |
| 233 W 18th St | 0.65mi | 2/2.0 (-1) | 1,256 (-4%) | 2mo | $299,999 | $239 | 56 |
| 221 W 18th St | 0.65mi | 2/2.0 (-1) | 1,256 (-4%) | 2mo | $307,599 | $245 | 56 |
| 606 N Juniper St | 0.32mi | 2/1.0 (-1) | 1,161 (-11%) | 2mo | $200,000 | $172 | 55 |
| 1019 E 10th St | 0.64mi | 4/2.0 (+1) | 1,389 (+6%) | 1mo | $325,000 | $234 | 54 |
Match score weights: distance 35% · size 25% · config 20% · recency 20%. Top-matched comps best support the ARV.
Projected returns pro-forma
-3.0% appreciation · 2.5% rent growth · sell at horizon
- IRR
- -8.1%
- Equity multiple
- 0.70×
- Total profit
- $-14,912
- Equity at exit
- $26,839
- IRR
- 0.8%
- Equity multiple
- 1.06×
- Total profit
- $2,843
- Equity at exit
- $15,563
Cash invested: $50,400 (down + closing). Projections, not guarantees.
Landlord ↔ Tenant lean methodology
- Overall (STATE)
- 85 Strongly Landlord-Friendly
- State North Carolina
- 85 Strongly Landlord-Friendly · R+3
- County
- — inherits STATE
- City
- — inherits STATE
ZIP-level market 28081
- Rents YoY
- 2.5%
- Active inventory
- 226
- Price-to-rent
- 8.4×
Monthly cashflow live
- Estimated rent
- $1,784 high interval (Pro) →
- Mortgage (P&I)
- −$944
- Tax from tax record
- −$152 /mo · $1,825/yr
- Insurance
- −$75
- HOA
- −$0
- Vacancy / Maint / Mgmt
- −$375
- Net cashflow
- $238
Break-even live
Sensitivity live
| Price | -10% $340 | -5% $289 | +0% $238 | +5% $187 | +10% $136 |
|---|---|---|---|---|---|
| Rent | -10% $97 | -5% $168 | +0% $238 | +5% $309 | +10% $379 |
| Rate | -1.0pp $329 | -0.5pp $284 | base $238 | +0.5pp $191 | +1.0pp $144 |
UW: 25.0% down · 7.5% · 30yr · 1.5% tax · 5.0% vac · 8.0% maint · 8.0% mgmt
Financing live
Cash to close
- Down payment
- $45,000
- Closing costs
- $5,400
- Reserves months
- —
- Total cash needed
- —
Loan-product check · same deal, 3 products live
Conventional
25% down · 7.5% · 30yr
- Down + closing
- —
- Monthly P&I
- —
- Monthly cashflow
- —
- DSCR
- —
- Eligible?
- —
Personal DTI + credit; lowest rate.
DSCR
20% down · 8.5% · 30yr
- Down + closing
- —
- Monthly P&I
- —
- Monthly cashflow
- —
- DSCR
- —
- Eligible?
- —
No personal income docs; deal must DSCR.
Hard money
10% down · 12.0% · 12mo
- Down + closing
- —
- Monthly P&I
- —
- Monthly cashflow
- —
- DSCR
- —
- Eligible?
- —
Short-term bridge; refi at stabilization.
Rent comps 23 comps
| Address | Beds | Baths | Sqft | Rent | $/sqft | DOM | Units | Dist |
|---|---|---|---|---|---|---|---|---|
| 602 N Juniper Ave Kannapolis, NC | 2.0 | 1.0 | 1200 | $1,300 | $1.08 | 16d | 1 | 0.36mi |
| 500 Jackson Park Rd Unit 12 Kannapolis, NC | 2.0 | 1.5 | 925 | $1,305 | $1.41 | 16d | 1 | 0.50mi |
| 368 W 18th St Kannapolis, NC | 3.0 | 2.0 | 1399 | $1,995 | $1.43 | 6d | 1 | 0.65mi |
| 1024 E 10th St Kannapolis, NC | 3.0 | 1.5 | 1030 | $1,595 | $1.55 | 6d | 1 | 0.65mi |
| 720 Fraternity Row Kannapolis, NC | 3.0 | 3.0 | 1591 | $1,999 | $1.26 | 4d | 1 | 0.85mi |
| 103 S Ridge Ave #5 Kannapolis, NC | 3.0 | 2.5 | 1100 | $1,600 | $1.45 | 25d | 1 | 0.95mi |
| 1 Dale Earnhardt Blvd Kannapolis, NC | 3.0 | 2.0 | 1200 | $2,400 | $2.00 | 18d | 1 | 1.01mi |
| 200 S Main St Kannapolis, NC | 2.0 | 1.0–2.0 | 880 | $2,495 | $2.84 | 0d | 84 | 1.05mi |
| 1413 Arden Ave Kannapolis, NC | 3.0 | 2.5 | 1225 | $1,590 | $1.30 | 12d | 1 | 1.08mi |
| 1413 Arden Ave Kannapolis, NC | 3.0 | 2.5 | 1225 | $1,590 | $1.30 | 25d | 1 | 1.08mi |
| 1415 Arden Ave Kannapolis, NC | 3.0 | 2.5 | 1225 | $1,590 | $1.30 | 25d | 1 | 1.09mi |
| 210 S Main St Kannapolis, NC | 3.0 | 1.0–2.0 | 914 | $2,726 | $2.98 | 0d | 21 | 1.11mi |
| 1004 Valley St Kannapolis, NC | 2.0 | 2.0 | 1322 | $2,200 | $1.66 | 0d | 1 | 1.13mi |
| 310 Glenn Ave Kannapolis, NC | 3.0 | 2.5 | 1475 | $2,050 | $1.39 | 6d | 1 | 1.16mi |
| 1022 W C St Kannapolis, NC | 3.0 | 2.5 | 1407 | $2,100 | $1.49 | 25d | 1 | 1.23mi |
| 126 Glenn Ave Unit NA Kannapolis, NC | 3.0 | 3.0 | 1541 | $2,250 | $1.46 | 0d | 1 | 1.25mi |
| 333 Central Ave Kannapolis, NC | 3.0 | 1.0 | 1800 | $1,620 | $0.90 | 19d | 1 | 1.34mi |
| 1614 Barbara Ann Cir Kannapolis, NC | 3.0 | 2.0 | 1509 | $1,899 | $1.26 | 18d | 1 | 1.39mi |
| 1855 Lane St Kannapolis, NC | 3.0 | 2.0 | 1430 | $1,895 | $1.33 | 23d | 1 | 1.40mi |
| 404 S Rose Ave Kannapolis, NC | 3.0 | 2.0 | 1197 | $1,795 | $1.50 | 13d | 1 | 1.43mi |
| 528 Walter St Kannapolis, NC | 2.0 | 1.5 | 1050 | $1,350 | $1.29 | 25d | 1 | 1.44mi |
| 530 Walter St Kannapolis, NC | 2.0 | 1.5 | 1050 | $1,350 | $1.29 | 25d | 1 | 1.44mi |
| 531 Park St Kannapolis, NC | 2.0 | 1.5 | 1050 | $1,235 | $1.18 | 25d | 1 | 1.48mi |
Listing history 14 events
-
2026-06-09days on market $180,000 Active 108 DOM
-
2026-06-08days on market $180,000 Active 107 DOM
-
2026-06-07days on market $180,000 Active 106 DOM
-
2026-06-04days on market $180,000 Active 103 DOM
-
2026-06-03days on market $180,000 Active 102 DOM
-
2026-06-02days on market $180,000 Active 101 DOM
-
2026-06-01days on market $180,000 Active 100 DOM
-
2026-05-31days on market $180,000 Active 99 DOM
-
2026-03-14price $180,000
-
2026-02-15$195,000 Active
-
2023-03-24soldstatus $180,000 Closed 179-char remark
Show marketing remark (179 chars)
Excellent investment opportunity 3 bedrooms, 2 baths Ranch with spacious backyard. Nome needs TLC. Conveniently located near downtown Kannapolis, ball park, shopping, restaurants.
-
2023-03-24soldstatus $180,000
Show marketing remark (179 chars)
Excellent investment opportunity 3 bedrooms, 2 baths Ranch with spacious backyard. Nome needs TLC. Conveniently located near downtown Kannapolis, ball park, shopping, restaurants.
-
2023-02-23historical Active Under Contract 179-char remark
Show marketing remark (179 chars)
Excellent investment opportunity 3 bedrooms, 2 baths Ranch with spacious backyard. Nome needs TLC. Conveniently located near downtown Kannapolis, ball park, shopping, restaurants.
-
2022-11-07$210,000 Active 179-char remark
Show marketing remark (179 chars)
Excellent investment opportunity 3 bedrooms, 2 baths Ranch with spacious backyard. Nome needs TLC. Conveniently located near downtown Kannapolis, ball park, shopping, restaurants.
ⓘ Source: listings_history table (triggers on properties + properties_extension) + one-shot
backfill from property_details.listing_events for pre-trigger history.
Tax reassessment forecast NC · Resets to sale price
- Current annual tax
- $1,825 · $152/mo
- Projected year-2 tax
- $1,825 · $152/mo
- Expected delta
- $0/yr ($0/mo · 0.0%)
ⓘ Screening estimate from a state-policy table — verify with the county assessor before closing.
Climate risk First Street
- Flood 1/10 Low FEMA zone X (unshaded) · 0% chance over 30 yrs
- Wildfire 1/10 Low
- Heat 6/10 Major 7 d/yr ≥105°F today · 17 d/yr by 30 yrs out
- Wind 4/10 Moderate 16% chance of damaging wind over 30 yrs
- Air quality 2/10 Low 1 unhealthy d/yr today · 3 by 30 yrs out
Nearby sold comps map
Loading sold comps map…
Walkable amenities ~0.75 mi
Loading nearby amenities…
Taxation est. · year 1
- Rental income
- $21,405
- − Mortgage interest
- −$10,083
- − Property taxes
- −$1,825
- − Insurance
- −$900
- − Repairs & maintenance
- −$1,712
- − Management
- −$1,712
- − Depreciation
- −$5,236
- Taxable loss
- −$64
- Est. tax savings @ 24.0%
- +$15
- After-tax cash flow
- $2,873/yr
For passive investors: Depreciation is non-cash, so a rental often shows a tax loss while cash-flowing — sheltering income. Rental losses are passive: they offset passive income freely, and up to $25,000/yr can offset ordinary (W-2) income if you actively participate and your MAGI is under $100k (phasing out to $0 by $150k); unused losses carry forward. On sale, claimed depreciation is recaptured at up to 25%, and gains may owe capital-gains tax (a 1031 exchange can defer both). Figures are a year-1 estimate at your 24.0% rate — not tax advice; consult a CPA.
Schools (NCES district)
- District
- Kannapolis City Schools
- NCES district ID
- 3702430
- Math proficiency
- 30% ▲ 7.00%
- Reading proficiency
- 33% ▼ -2.00%
- Median HH income
- $38,534
- Composite
- 26.34/100
- National rank
- #7237
- State rank
- #141 of 178 in NC
Livability — Kannapolis
- Score
- 64/100
- State rank
- #354
- US rank
- #14030
Category grades
Schools grade is shown separately in the Schools card above.
Census & demographics
- Census place
- Kannapolis, NC
- County
- Cabarrus County · 218,793 people
- City population
- 57,170
- Metro
- Charlotte-Concord-Gastonia, NC-SC
- Population (ZIP)
- 29,075
- Household income
- $71,665
- Rent vs Own
- Severe rent burden
- 763.0
Population outlook (Rowan County) Hauer SSP2
- Today (2025)
- 140,430 people
- By 2030
- 140,193 · -0.2%
- By 2040
- 137,617 · -2.0%
- By 2050
- 131,826 · -6.1%
- By 2075
- 115,123 · -18.0%
- By 2100
- 92,774 · -33.9%
Race, ethnicity, and origin ACS 2023
- Neighborhood character
- Majority White (65%)
- Race & ethnicity
- White 65% Black 18% Hispanic / Latino 12% Two or more races 6% Asian 1%
- Hispanic origin (detail)
- Mexican 6%
- Common ancestry
- Slovak 2% Italian 1% Serbian 1%
- Foreign-born
- 8% · Canada, China
- Languages at home
- 88% English-only · Spanish 10% French/Haitian/Cajun 1% Chinese 1%
Political lean MEDSL · Rowan
- 2024 margin
- Solid R (+35.9) · D 31.6% · R 67.5%
- 2008→2024 swing
- -13.1pp toward R · 2008: -22.8pp · 2024: -35.9pp
- All cycles
- 2024: R+35.9 2020: R+35.7 2016: R+36.8 2012: R+26.0 2008: R+22.8
Not yet ingested
- Civics
- —
Market trends
- HPI YoY
- ▼ -202.75%
- Current HPI
- 282.9002
- Rent YoY
- ▲ 2.50%
- Metro
- Charlotte-Concord-Gastonia, NC-SC
- State GDP YoY
- ▲ 3.28%
- F500 in state
- 26
Industry mix (Fortune 500 HQ in NC)
| Industry | F500 HQs | Revenue |
|---|---|---|
| Financial Services | 2 | $213B |
|
||
| Retail | 2 | $95B |
|
||
| Industrial Conglomerate | 1 | $38B |
|
||
| Metals / Steel | 1 | $35B |
|
||
| Utilities | 1 | $30B |
|
||
| Industrial Machinery | 1 | $19B |
|
||
Price history
-14.3% since first listed6 events — show timeline
- 2026-03-14 Price Changed $180,000 CANOPYMLS as Distributed by MLS Grid
- 2026-02-15 Listed $195,000 CANOPYMLS as Distributed by MLS Grid
- 2023-03-24 Sold (Public Records) $180,000 Public Records
- 2023-03-24 Sold (MLS) $180,000 CANOPYMLS as Distributed by MLS Grid
- 2023-02-23 Contingent — CANOPYMLS as Distributed by MLS Grid
- 2022-11-07 Listed $210,000 CANOPYMLS as Distributed by MLS Grid
Property tax history
+6.1%/yrLatest (2025): $1,825 · +0.0% YoY. Source: county tax records.
Cash-flow waterfall
monthlySold comps — $/sqft
last 12 mo · ≤1 miLoading sold comps…