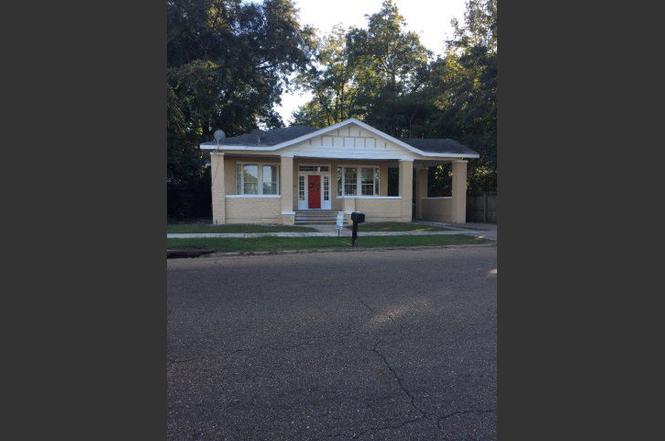
216 Court St · Brookhaven, MS
Flood risk 1/10 · Minimal
- FEMA flood zone
- X (unshaded)
- Chance of flooding over 30 yrs
- 0.0%
- Est. flood insurance / yr
- $507 – $1,088
Fire risk 4/10 · Minor
- Est. fire insurance / yr
- $1,241 – $2,305
Heat risk 8/10 · Major
- Hot days now (above 108°F)
- 7 days/yr
- Hot days in 30 yrs
- 22 days/yr
Wind risk 8/10 · Major
- Chance of severe wind over 30 yrs
- 92.0%
Air-quality risk 1/10 · Minimal
- Unhealthy air days now
- 0 days/yr
- Unhealthy air days in 30 yrs
- 0 days/yr
Risk factors via First Street. Map © Google.
Why this score? — see what drove the D grade
The composite is a weighted blend of 9 inputs, each scored 0–100. Each bar is that input's sub-score; the figure is the points it added to the 100-point composite (weight × sub-score).
- Cash flow +15.0/30.0
- ARV discount +7.5/15.0
- 1% rule +5.0/10.0
- DSCR +5.0/10.0
- Livability +3.3/5.0
- Rent growth +2.5/5.0
- Condition / age +2.5/5.0
- Schools +2.3/10.0
- Appreciation +0.0/10.0
$19,900
🖨 Deal sheet 📄 Offer letter ✓ Due diligence
Listing remarks MLS
This home recently redone inside and outside. Large room with ceiling fans. Owner will install window a/c units upon purchase. Floors are laminate wood finish throughout. Roof is approximately 10 years old.
Key facts
- 0.23 acre lot
- Garage
Neighborhood map
What this means for you Summary
Snapshot
- This is a 3-bed/1.0-bath single-family listed at $20k.
Deal economics
- At list price, monthly cash flow is $909 ($11k/yr) — positive.
- The deal already cash-flows at list — no discount required.
- Meets the 1% rule at list price ($1k rent vs $20k).
- Cap rate 61.1% vs local median 5.0% in Brookhaven — top-decile yield for the area; either an underpriced asset or a hidden risk that comps aren't pricing in. Stress-test before assuming the spread holds.
Location & tenants
- Location reads 66/100 on livability (#96 in MS) — a middle-class / working-renter tenant base. Strengths: cost of living A+, crime B+; Watch: schools C-, amenities F, commute F.
- Brookhaven School District (town): math 29% / reading 28% proficiency, ranked #73 of 130 in MS (top 56%) — low school quality limits family demand, transient renter base, plan for 1-2y turnover; 66% free/reduced lunch — lower-income household profile, screen leases tightly.
- Market conditions: 172 active listings in the ZIP; 1 comparable units currently listed for rent nearby; 10 units permitted in Lincoln County in 2024 (0 in 5+ unit buildings).
Forward outlook
- Local home prices are declining (-3.0%/yr); year-one equity from $138 of loan paydown is wiped out by about $597 of value loss. Plan a longer hold.
- Lincoln County population projected at -12% by 2050 — secular population decline; favor cash flow + early exit over multi-decade hold.
- At projected returns (-3.0% appreciation + 3.0% rent growth), your $6k cash investment doubles in ~1 year — after that, you're playing with house money.
Negotiation context
- Only 0 days on market — expect competitive offers; lowballing is unlikely to land.
- 2 sale attempts since 10y ago; this cycle's ask has dropped $52k (72%) from the opening price — seller is motivated, your offer sets the floor, not the list.
Risks & watch-outs
- Climate carrying-cost: severe wind risk, 92% chance of damaging wind over 30y; extreme-heat days projected 7→22/yr by 2055 (HVAC capex compounding) — expect insurance premiums to compound above CPI over the hold.
Questions for the listing agent
- Is there a deadline driving the sale (1031 exchange, divorce, estate, relocation)? That informs how much negotiation room exists.
- The area grade is low — what's the realistic commute time and amenity access for the typical tenant pool here? Any planned neighborhood developments (good or bad) we should know about?
- What's the average days-on-market for RENTAL listings here right now (not sales)? A rising rental-DOM trend means longer vacancies and softer asking-rent achievability than the comps imply.
- What's the recent tenant-quality profile in this submarket — average credit score on applications, eviction rate, late-payment / NSF rate, and stable-employment percentage? A property-management company in the area should have these aggregated.
- How much new for-sale + rental construction is in the pipeline within 1–3 miles? Heavy new supply typically softens prices + rents 12–24 months out; constrained supply supports both.
Investment metrics
- 1% rule
- 6.66% ✓
- Cap rate
- 61.12%
- Cash-on-cash
- 195.81%
- DSCR
- 9.71
- GRM
- 1.3
CMA / ARV
- ARV (on-the-fly)
- $174,800
- Comps found
- 12
Show comp detail 12 sales within ~0.75 mi
| Address | Dist | Beds/Ba | Sqft | Sold | Price | $/sf | Match |
|---|---|---|---|---|---|---|---|
| 316 N Church St | 0.37mi | 3/2.5 | 1,824 (-4%) | 3mo | $166,900 | $92 | 68 |
| 219 N Church St | 0.38mi | 4/2.0 (+1) | 1,760 (-7%) | 2mo | $105,000 | $60 | 60 |
| 535 W Monticello St | 0.64mi | 3/2.0 | 1,832 (-4%) | 0mo | $60,000 | $33 | 60 |
| 538 W Monticello St | 0.65mi | 3/2.0 | 1,802 (-5%) | 4mo | $59,900 | $33 | 54 |
| 156 W Enterprise St | 0.53mi | 3/2.0 | 2,100 (+10%) | 3mo | $99,500 | $47 | 52 |
| 318 Cassedy St | 0.61mi | 3/2.0 | 1,963 (+3%) | 12mo | $259,000 | $132 | 52 |
| 342 W Congress | 0.48mi | 2/0.5 (-1) | 1,668 (-12%) | 3mo | $95,000 | $57 | 48 |
| 314 W Congress St | 0.41mi | 3/2.0 | 1,656 (-13%) | 11mo | $44,900 | $27 | 47 |
| 507 W Chickasaw St | 0.63mi | 3/2.0 | 2,039 (+7%) | 10mo | $242,500 | $119 | 46 |
| 402 Storm Ave | 0.66mi | 3/2.0 | 2,077 (+9%) | 8mo | $247,000 | $119 | 43 |
| 513 W Chippewa St | 0.71mi | 3/2.0 | 1,632 (-14%) | 4mo | $238,000 | $146 | 36 |
| 329 W Chippewa St | 0.57mi | 4/3.0 (+1) | 2,163 (+14%) | 9mo | $290,000 | $134 | 30 |
Match score weights: distance 35% · size 25% · config 20% · recency 20%. Top-matched comps best support the ARV.
Projected returns pro-forma
-3.0% appreciation · 3.0% rent growth · sell at horizon
- IRR
- —
- Equity multiple
- 10.82×
- Total profit
- $54,704
- Equity at exit
- $2,967
- IRR
- —
- Equity multiple
- 22.95×
- Total profit
- $122,284
- Equity at exit
- $1,721
Cash invested: $5,572 (down + closing). Projections, not guarantees.
Landlord ↔ Tenant lean methodology
- Overall (STATE)
- 90 Strongly Landlord-Friendly
- State Mississippi
- 90 Strongly Landlord-Friendly · R+11
- County
- — inherits STATE
- City
- — inherits STATE
ZIP-level market 39601
- Home prices YoY
- -26.6%
- Active inventory
- 172
- Price-to-rent
- 1.3×
Monthly cashflow live
- Estimated rent
- $1,325 medium interval (Pro) →
- Mortgage (P&I)
- −$104
- Tax est. 1.5%
- −$25 /mo · $298/yr
- Insurance
- −$8
- HOA
- −$0
- Vacancy / Maint / Mgmt
- −$278
- Net cashflow
- $909
Break-even live
UW: 25.0% down · 7.5% · 30yr · 1.5% tax · 5.0% vac · 8.0% maint · 8.0% mgmt
Financing live
Cash to close
- Down payment
- $4,975
- Closing costs
- $597
- Reserves months
- —
- Total cash needed
- —
Loan-product check · same deal, 3 products live
Conventional
25% down · 7.5% · 30yr
- Down + closing
- —
- Monthly P&I
- —
- Monthly cashflow
- —
- DSCR
- —
- Eligible?
- —
Personal DTI + credit; lowest rate.
DSCR
20% down · 8.5% · 30yr
- Down + closing
- —
- Monthly P&I
- —
- Monthly cashflow
- —
- DSCR
- —
- Eligible?
- —
No personal income docs; deal must DSCR.
Hard money
10% down · 12.0% · 12mo
- Down + closing
- —
- Monthly P&I
- —
- Monthly cashflow
- —
- DSCR
- —
- Eligible?
- —
Short-term bridge; refi at stabilization.
Rent comps 1 comps
| Address | Beds | Baths | Sqft | Rent | $/sqft | DOM | Units | Dist |
|---|---|---|---|---|---|---|---|---|
| 1081 S Church St Brookhaven, MS | 2.0 | 2.0 | 1694 | $1,325 | $0.78 | 43d | 1 | 1.01mi |
Listing history 6 events
-
2016-10-28soldstatus
-
2016-10-27soldstatus 210-char remark
Show marketing remark (210 chars)
This home recently redone inside and outside. Large room with ceiling fans. Owner will install window a/c units upon purchase. Floors are laminate wood finish throughout. Roof is approximately 10 years old.
-
2016-10-12$72,000 210-char remark
Show marketing remark (210 chars)
This home recently redone inside and outside. Large room with ceiling fans. Owner will install window a/c units upon purchase. Floors are laminate wood finish throughout. Roof is approximately 10 years old.
-
2016-04-26soldstatus
-
2016-04-01historical
-
2016-02-26$19,900
ⓘ Source: listings_history table (triggers on properties + properties_extension) + one-shot
backfill from property_details.listing_events for pre-trigger history.
Climate risk First Street
- Flood 1/10 Low FEMA zone X (unshaded) · 0% chance over 30 yrs
- Wildfire 4/10 Moderate
- Heat 8/10 Severe 7 d/yr ≥108°F today · 22 d/yr by 30 yrs out
- Wind 8/10 Severe 92% chance of damaging wind over 30 yrs
- Air quality 1/10 Low 0 unhealthy d/yr today · 0 by 30 yrs out
Nearby sold comps map
Loading sold comps map…
Walkable amenities ~0.75 mi
Loading nearby amenities…
Taxation est. · year 1
- Rental income
- $15,900
- − Mortgage interest
- −$1,115
- − Property taxes
- −$298
- − Insurance
- −$100
- − Repairs & maintenance
- −$1,272
- − Management
- −$1,272
- − Depreciation
- −$579
- Taxable income
- $11,264
- Est. tax owed @ 24.0%
- −$2,703
- After-tax cash flow
- $8,207/yr
For passive investors: Depreciation is non-cash, so a rental often shows a tax loss while cash-flowing — sheltering income. Rental losses are passive: they offset passive income freely, and up to $25,000/yr can offset ordinary (W-2) income if you actively participate and your MAGI is under $100k (phasing out to $0 by $150k); unused losses carry forward. On sale, claimed depreciation is recaptured at up to 25%, and gains may owe capital-gains tax (a 1031 exchange can defer both). Figures are a year-1 estimate at your 24.0% rate — not tax advice; consult a CPA.
Schools (NCES district)
- District
- Brookhaven School District
- NCES district ID
- 2800840
- Math proficiency
- 29% ▼ -3.00%
- Reading proficiency
- 28% ▼ -6.00%
- Median HH income
- $34,498
- Composite
- 23.49/100
- National rank
- #7874
- State rank
- #73 of 130 in MS
Livability — Brookhaven
- Score
- 66/100
- State rank
- #96
- US rank
- #12022
Category grades
Schools grade is shown separately in the Schools card above.
Census & demographics
- Census place
- Brookhaven, MS
- City population
- 23,748
- Population (ZIP)
- 23,748
Population outlook (Lincoln County) Hauer SSP2
- Today (2025)
- 34,188 people
- By 2030
- 33,627 · -1.6%
- By 2040
- 32,089 · -6.1%
- By 2050
- 29,981 · -12.3%
- By 2075
- 23,581 · -31.0%
- By 2100
- 16,413 · -52.0%
Race, ethnicity, and origin ACS 2023
- Neighborhood character
- Majority White (62%)
- Race & ethnicity
- White 62% Black 36% Hispanic / Latino 2%
- Common ancestry
- Serbian 3% Slovak 2% Lithuanian 2%
- Foreign-born
- 1%
- Languages at home
- 99% English-only · Other Indo-European 1%
Political lean MEDSL · Lincoln
- 2024 margin
- Solid R (+45.4) · D 27.0% · R 72.3%
- 2008→2024 swing
- -13.2pp toward R · 2008: -32.2pp · 2024: -45.4pp
- All cycles
- 2024: R+45.4 2020: R+39.0 2016: R+40.1 2012: R+31.1 2008: R+32.2
Not yet ingested
- Civics
- —
Market trends
- HPI YoY
- ▼ -57.93%
- Current HPI
- 159.7072
- Rent YoY
- —
- Metro
- —
- State GDP YoY
- —
- F500 in state
- 0
Price history
+261.8% since first listed6 events — show timeline
- 2016-10-28 Sold (Public Records) — Public Records
- 2016-10-27 Sold (MLS) — MLSU
- 2016-10-12 Listed $72,000 MLSU
- 2016-04-26 Sold (Public Records) — Public Records
- 2016-04-01 Listing Removed — MLSU
- 2016-02-26 Listed $19,900 MLSU
Property tax history
+6.7%/yrLatest (2024): $2,219 · +14.4% YoY. Source: county tax records.
Cash-flow waterfall
monthlySold comps — $/sqft
last 12 mo · ≤1 miLoading sold comps…