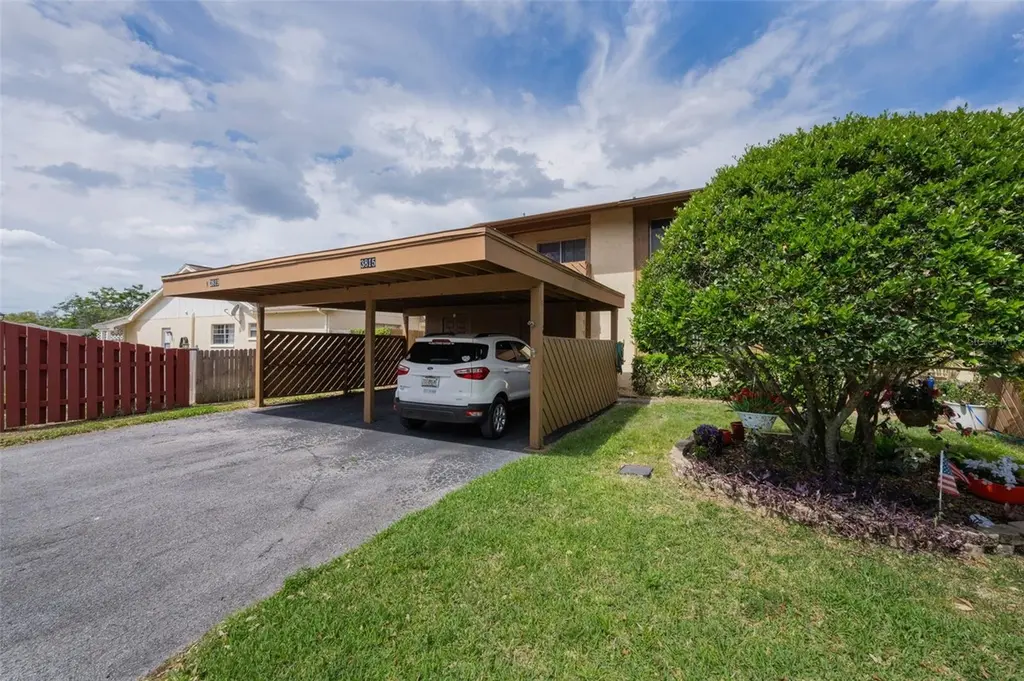
3815 Penrick Dr #0 · Beacon Square, FL
Flood risk 6/10 · Moderate
- FEMA flood zone
- X (shaded)
- Chance of flooding over 30 yrs
- 0.74%
- Est. flood insurance / yr
- $507 – $1,088
Fire risk 3/10 · Minor
- Est. fire insurance / yr
- $947 – $1,759
Heat risk 10/10 · Severe
- Hot days now (above 109°F)
- 7 days/yr
- Hot days in 30 yrs
- 29 days/yr
Wind risk 10/10 · Severe
- Chance of severe wind over 30 yrs
- 99.0%
Air-quality risk 2/10 · Minimal
- Unhealthy air days now
- 1 days/yr
- Unhealthy air days in 30 yrs
- 1 days/yr
Risk factors via First Street. Map © Google.
Why this score? — see what drove the C+ grade
The composite is a weighted blend of 9 inputs, each scored 0–100. Each bar is that input's sub-score; the figure is the points it added to the 100-point composite (weight × sub-score).
- Cash flow +25.5/30.0
- 1% rule +10.0/10.0
- DSCR +8.4/10.0
- ARV discount +7.5/15.0
- Schools +4.3/10.0
- Livability +3.3/5.0
- Rent growth +2.7/5.0
- Condition / age +2.5/5.0
- Appreciation +0.0/10.0
$90,000
🖨 Deal sheet (PDF) 📄 Offer letter ✓ Due diligence
Listing remarks
Welcome to easy, low-maintenance living in this beautifully designed first-floor condo located in a desirable 55+ community. Offering 1,144 square feet of comfortable living space, this well-appointed home features 2 spacious bedrooms and 2 full bathrooms, perfectly suited for both everyday living and hosting guests. Step inside to find a bright and inviting layout with generous living and dining areas, ideal for relaxing or entertaining. The primary suite provides a private retreat with ample closet space and an en-suite bath, while the second bedroom offers flexibility for guests, a home office, or hobbies. Enjoy the enclosed Florida room and oversized end-unit. Sit out front on your fenc
Key facts
- Fenced in porch
- First floor condo
- Oversized end unit
Tags
Property features AI
Finance
- Other: Condo land included; Unfurnished; Association amenities include Cable TV
- Financial info: Total annual HOA fees $6,720; Lease restrictions apply
- HOA & community: Monthly HOA fee of $560 (includes pool, internet, structure and grounds maintenance, pest control, recreational facilities, sewer, trash and water); Association: Quality Property Management (approval required); Community features: Clubhouse, Pool, Recreation facilities, Shuffleboard court, Spa/Hot Tub; Senior community; Pets allowed (max 100 lbs)
Exterior
- Parking: Carport (1 space)
- Utilities: Public water; Public sewer; Electricity connected; Water connected; Sewer connected
- Home design: Condominium; One story; East-facing; Living area approximately 1,144 sq ft
- Construction: Block construction; Shingle roof; Slab foundation; Built as part of building number 3815
- Exterior features: Landscaped grounds; Paved road access
Interior
- Kitchen: Dishwasher; Range; Range hood; Refrigerator
- Bedrooms: 2 bedrooms
- Flooring: Carpet; Tile
- Bathrooms: 2 full bathrooms
- Heating & cooling: Central heating; Central air conditioning
- Interior features: Ceiling fans; Living room/dining room combo; Sliding doors
- Laundry & utility: Inside laundry room
Neighborhood map
What this means for you Summary
Snapshot
- This is a 2-bed/2.0-bath condo listed at $90k.
Deal economics
- At list price, monthly cash flow is $210 ($3k/yr) — positive.
- The deal already cash-flows at list — no discount required.
- Meets the 1% rule at list price ($2k rent vs $90k).
- Recommended offer: $87k (3.0% below list) — sets the bar for market timing.
- Cap rate 9.1% vs local median 2.7% in Beacon Square — top-decile yield for the area; either an underpriced asset or a hidden risk that comps aren't pricing in. Stress-test before assuming the spread holds.
Location & tenants
- Location reads 66/100 on livability (#600 in FL) — a middle-class / working-renter tenant base. Strengths: cost of living A+, housing A+, health & safety B; Watch: employment D, schools F, amenities F.
- Pasco (suburban): math 50% / reading 52% proficiency, ranked #32 of 73 in FL (top 44%) — acceptable for families but not a draw, mixed tenant base, ~2y average lease.
- Market conditions: Rents flat; 635 active listings in the ZIP; 40 comparable units currently listed for rent nearby; rentals at typical pace (median 18d on market — plan ~3-4 weeks tenant-placement turnaround); 6,765 units permitted in Pasco County in 2024 (1,250 in 5+ unit buildings).
- This rent runs 35% of the median local income ($57k/yr) — at the standard rent-burdened threshold; future hikes will face affordability resistance.
Forward outlook
- Local home prices are declining (-3.0%/yr); year-one equity from $622 of loan paydown is wiped out by about $3k of value loss. Plan a longer hold.
- Pasco County population projected at +29% by 2050 — long-run rental-demand tailwind backs the buy-and-hold thesis.
Negotiation context
- It's been on market 56 days — a 3% lower offer ($87k) is reasonable based on typical stale-listing flexibility.
- Current owner paid $50k; list at $90k implies a 80% gain — meaningful room to come down on a strong offer.
Risks & watch-outs
- Watch-outs: HOA is 34% of rent.
- Climate carrying-cost: major flood risk; severe wind risk, 99% chance of damaging wind over 30y; extreme-heat days projected 7→29/yr by 2055 (HVAC capex compounding) — expect insurance premiums to compound above CPI over the hold.
Questions for the listing agent
- It's been on market 56 days. Have you received any prior offers? Is the seller open to a 3% concession, seller financing, or rate buy-down credit?
- Built in 1979 — when were the roof, HVAC, electrical panel, plumbing, and water heater last replaced?
- What does the HOA fee cover, when was the last increase, and are there any pending special assessments or reserve-fund shortfalls?
- Any open or pending special assessments — roof, HVAC, plumbing, elevator, façade? What's the per-unit balance and payoff schedule, and is the seller paying it off at close or rolling it to the buyer?
- Is there a deadline driving the sale (1031 exchange, divorce, estate, relocation)? That informs how much negotiation room exists.
- Schools are F-rated, which usually means shorter tenancies and higher turnover. Who's the typical renter profile here, and what's been the actual vacancy rate?
- What's the average days-on-market for RENTAL listings here right now (not sales)? A rising rental-DOM trend means longer vacancies and softer asking-rent achievability than the comps imply.
- What's the recent tenant-quality profile in this submarket — average credit score on applications, eviction rate, late-payment / NSF rate, and stable-employment percentage? A property-management company in the area should have these aggregated.
- How much new apartment / multifamily construction is in the pipeline within 1–3 miles? Heavy new supply (>2% of stock underway) typically softens rents 12–24 months out; light construction supports rent growth.
Investment metrics
- 1% rule
- 1.83% ✓
- Cap rate
- 9.09%
- Cash-on-cash
- 9.99%
- DSCR
- 1.44
- GRM
- 4.5
CMA / ARV
No comps found within radius.
Projected returns pro-forma
-3.0% appreciation · 0.72% rent growth · sell at horizon
- IRR
- -5.1%
- Equity multiple
- 0.82×
- Total profit
- $-4,614
- Equity at exit
- $13,419
- IRR
- -0.0%
- Equity multiple
- 1.00×
- Total profit
- $-55
- Equity at exit
- $7,782
Cash invested: $25,200 (down + closing). Projections, not guarantees.
Landlord ↔ Tenant lean methodology
- Overall (STATE)
- 87 Strongly Landlord-Friendly
- State Florida
- 87 Strongly Landlord-Friendly · R+3
- County
- — inherits STATE
- City
- — inherits STATE
ZIP-level market 34652
- Home prices YoY
- -26.1%
- Rents YoY
- 0.7%
- Active inventory
- 635
- Price-to-rent
- 4.5×
Monthly cashflow live
- Estimated rent
- $1,651 high interval (Pro) →
- Mortgage (P&I)
- −$472
- Tax from tax record
- −$25 /mo · $305/yr
- Insurance
- −$38
- HOA
- −$560
- Vacancy / Maint / Mgmt
- −$347
- Net cashflow
- $210
Break-even live
Sensitivity live
| Price | -10% $261 | -5% $235 | +0% $210 | +5% $184 | +10% $159 |
|---|---|---|---|---|---|
| Rent | -10% $79 | -5% $145 | +0% $210 | +5% $275 | +10% $340 |
| Rate | -1.0pp $255 | -0.5pp $233 | base $210 | +0.5pp $186 | +1.0pp $163 |
UW: 25.0% down · 7.5% · 30yr · 1.5% tax · 5.0% vac · 8.0% maint · 8.0% mgmt
Financing live
Cash to close
- Down payment
- $22,500
- Closing costs
- $2,700
- Reserves months
- —
- Total cash needed
- —
Loan-product check · same deal, 3 products live
Conventional
25% down · 7.5% · 30yr
- Down + closing
- —
- Monthly P&I
- —
- Monthly cashflow
- —
- DSCR
- —
- Eligible?
- —
Personal DTI + credit; lowest rate.
DSCR
20% down · 8.5% · 30yr
- Down + closing
- —
- Monthly P&I
- —
- Monthly cashflow
- —
- DSCR
- —
- Eligible?
- —
No personal income docs; deal must DSCR.
Hard money
10% down · 12.0% · 12mo
- Down + closing
- —
- Monthly P&I
- —
- Monthly cashflow
- —
- DSCR
- —
- Eligible?
- —
Short-term bridge; refi at stabilization.
Rent comps 40 comps
| Address | Beds | Baths | Sqft | Rent | $/sqft | DOM | Units | Dist |
|---|---|---|---|---|---|---|---|---|
| 3847 Lighthouse Way New Port Richey, FL | 2.0 | 2.0 | 1144 | $1,595 | $1.39 | 22d | 1 | 0.09mi |
| 4301 Straits Ln New Port Richey, FL | 3.0 | 1.5 | 1284 | $1,790 | $1.39 | 24d | 1 | 0.17mi |
| 4133 Grayton Dr New Port Richey, FL | 2.0 | 1.5 | 1068 | $1,727 | $1.62 | 5d | 1 | 0.25mi |
| 4031 Davit Dr New Port Richey, FL | 2.0 | 2.0 | 1144 | $1,600 | $1.40 | 18d | 1 | 0.26mi |
| 4022 Davit Dr New Port Richey, FL | 2.0 | 2.0 | 1144 | $1,600 | $1.40 | 18d | 1 | 0.28mi |
| 3439 Clydesdale Dr Holiday, FL | 2.0 | 1.0 | 968 | $1,395 | $1.44 | 5d | 1 | 0.41mi |
| 4221 Touchton Pl New Port Richey, FL | 2.0 | 2.0 | 888 | $1,300 | $1.46 | 24d | 1 | 0.44mi |
| 3301 Rosefield Dr Holiday, FL | 3.0 | 2.0 | 1340 | $2,100 | $1.57 | 18d | 1 | 0.52mi |
| 3433 Monticello St Holiday, FL | 3.0 | 1.5 | 960 | $1,650 | $1.72 | 24d | 1 | 0.53mi |
| 4211 Hampton Dr New Port Richey, FL | 2.0 | 2.0 | 1050 | $1,795 | $1.71 | 5d | 1 | 0.59mi |
| 4124 Flamingo Dr New Port Richey, FL | 3.0 | 1.0 | 744 | $1,500 | $2.02 | 15d | 1 | 0.61mi |
| 4124 Flamingo Dr New Port Richey, FL | 3.0 | 1.0 | 744 | $1,500 | $2.02 | 4d | 1 | 0.61mi |
| 3511 Cambridge St New Port Richey, FL | 2.0 | 2.0 | 936 | $2,100 | $2.24 | 5d | 1 | 0.61mi |
| 4408 Rustic Dr New Port Richey, FL | 2.0 | 1.0 | 1101 | $1,500 | $1.36 | 24d | 1 | 0.61mi |
| 4411 Rustic Dr Unit 1 New Port Richey, FL | 2.0 | 2.0 | 1050 | $1,450 | $1.38 | 13d | 1 | 0.62mi |
| 3516 Sheryl Hill Dr Holiday, FL | 2.0 | 2.0 | 848 | $1,595 | $1.88 | 24d | 1 | 0.66mi |
| 5020 Vickers Dr New Port Richey, FL | 2.0 | 1.0 | 863 | $1,550 | $1.80 | 5d | 1 | 0.77mi |
| 3612 Springfield Dr Holiday, FL | 2.0 | 1.5 | 1040 | $1,450 | $1.39 | 18d | 1 | 0.78mi |
| 3445 Wiltshire Dr Holiday, FL | 2.0 | 1.5 | 992 | $1,450 | $1.46 | 22d | 1 | 0.81mi |
| 4540 Irene Loop New Port Richey, FL | 2.0 | 1.0 | 768 | $1,550 | $2.02 | 24d | 1 | 0.89mi |
| 4117 Highland Loop New Port Richey, FL | 3.0 | 2.0 | 1384 | $1,599 | $1.16 | 13d | 1 | 0.89mi |
| 3252 Peterborough St Holiday, FL | 3.0 | 2.0 | 1290 | $1,631 | $1.26 | 5d | 1 | 0.93mi |
| 4348 Plaza Dr Holiday, FL | 1.0–2.0 | 1.0–2.0 | 860 | $1,499 | $1.74 | 3d | 9 | 0.95mi |
| 4616 Irene Loop New Port Richey, FL | 2.0 | 1.0 | 898 | $1,600 | $1.78 | 20d | 1 | 0.96mi |
| 4721 Naftis Ln New Port Richey, FL | 3.0 | 2.0 | 1104 | $1,700 | $1.54 | 13d | 1 | 0.96mi |
| 4282 Rudder Way New Port Richey, FL | 3.0 | 2.0 | 1454 | $2,000 | $1.38 | 24d | 1 | 0.97mi |
| 4282 Rudder Way New Port Richey, FL | 3.0 | 2.0 | 1310 | $2,000 | $1.53 | 4d | 1 | 0.97mi |
| 4205 Jordana Way Holiday, FL | 1.0–3.0 | 1.0–2.0 | 1027 | $1,404 | $1.37 | 3d | 13 | 1.02mi |
| 3431 Overland Dr Holiday, FL | 3.0 | 2.0 | 1236 | $1,850 | $1.50 | 24d | 1 | 1.02mi |
| 5232 Sparrow Dr Holiday, FL | 2.0 | 1.0 | 976 | $1,975 | $2.02 | 24d | 1 | 1.04mi |
| 5319 Drift Tide Dr New Port Richey, FL | 2.0 | 1.5 | 1142 | $1,500 | $1.31 | 10d | 1 | 1.06mi |
| 4554 Nimmer Dr New Port Richey, FL | 3.0 | 2.0 | 1180 | $1,600 | $1.36 | 15d | 1 | 1.08mi |
| 4548 Belfast Dr New Port Richey, FL | 3.0 | 1.0 | 1075 | $1,575 | $1.47 | 18d | 1 | 1.11mi |
| 4852 Pompano Dr New Port Richey, FL | 2.0 | 2.0 | 1104 | $2,900 | $2.63 | 24d | 1 | 1.12mi |
| 3528 Rock Royal Dr Holiday, FL | 2.0 | 1.0 | 1052 | $1,900 | $1.81 | 24d | 1 | 1.15mi |
| 4518 Audrey Ln Unit 4551 New Port Richey, FL | 2.0 | 1.0 | 750 | $1,295 | $1.73 | 22d | 1 | 1.16mi |
| 4723 Aegean Ave Holiday, FL | 2.0 | 1.0 | 1000 | $1,636 | $1.64 | 5d | 1 | 1.17mi |
| 4529 Audrey Ln New Port Richey, FL | 2.0 | 1.0 | 750 | $1,295 | $1.73 | 22d | 1 | 1.18mi |
| 4551 Audrey Ln NEW PRT RCHY, FL | 2.0 | 1.0 | 750 | $1,295 | $1.73 | 22d | 1 | 1.19mi |
| 4540 Audrey Ln New Port Richey, FL | 2.0 | 1.0 | 750 | $1,150 | $1.53 | 24d | 1 | 1.19mi |
HOA detail condo
- Monthly dues
- $560 · $6,720/yr
- Assessments
- None detected in remarks — confirm with the listing agent.
Listing history 17 events
-
2026-06-18days on market $90,000 Active 56 DOM
-
2026-06-17pricedays on market $90,000 Active 55 DOM
-
2026-06-16days on market $99,000 Active 54 DOM
-
2026-06-15days on market $99,000 Active 53 DOM
-
2026-06-13days on market $99,000 Active 51 DOM
-
2026-06-09days on market $99,000 Active 47 DOM
-
2026-06-08days on market $99,000 Active 46 DOM
-
2026-06-07days on market $99,000 Active 45 DOM
-
2026-06-04days on market $99,000 Active 42 DOM
-
2026-06-03days on market $99,000 Active 41 DOM
-
2026-06-02days on market $99,000 Active 40 DOM
-
2026-06-01days on market $99,000 Active 39 DOM
-
2026-05-31days on market $99,000 Active 38 DOM
-
2026-05-18price $99,000
-
2026-05-06price $105,000
-
2026-04-23$109,900 Active
-
2002-06-12soldstatus $50,000
ⓘ Source: listings_history table (triggers on properties + properties_extension) + one-shot
backfill from property_details.listing_events for pre-trigger history.
Tax reassessment forecast FL · Resets to sale price
- Current annual tax
- $305 · $25/mo
- Projected year-2 tax
- $747 · $62/mo
- Expected delta
- +$442/yr (+$37/mo · 144.9%)
ⓘ Screening estimate from a state-policy table — verify with the county assessor before closing.
Climate risk First Street
- Flood 6/10 Major FEMA zone X (shaded) · 74% chance over 30 yrs
- Wildfire 3/10 Moderate
- Heat 10/10 Extreme 7 d/yr ≥109°F today · 29 d/yr by 30 yrs out
- Wind 10/10 Extreme 99% chance of damaging wind over 30 yrs
- Air quality 2/10 Low 1 unhealthy d/yr today · 1 by 30 yrs out
Nearby sold comps map
Loading sold comps map…
Walkable amenities ~0.75 mi
Loading nearby amenities…
Taxation est. · year 1
- Rental income
- $19,817
- − Mortgage interest
- −$5,041
- − Property taxes
- −$305
- − Insurance
- −$450
- − Repairs & maintenance
- −$1,585
- − Management
- −$1,585
- − HOA
- −$6,720
- − Depreciation
- −$2,618
- Taxable income
- $1,512
- Est. tax owed @ 24.0%
- −$363
- After-tax cash flow
- $2,154/yr
For passive investors: Depreciation is non-cash, so a rental often shows a tax loss while cash-flowing — sheltering income. Rental losses are passive: they offset passive income freely, and up to $25,000/yr can offset ordinary (W-2) income if you actively participate and your MAGI is under $100k (phasing out to $0 by $150k); unused losses carry forward. On sale, claimed depreciation is recaptured at up to 25%, and gains may owe capital-gains tax (a 1031 exchange can defer both). Figures are a year-1 estimate at your 24.0% rate — not tax advice; consult a CPA.
Schools (NCES district)
- District
- Pasco
- NCES district ID
- 1201530
- Math proficiency
- 50% ▼ -10.00%
- Reading proficiency
- 52% ▼ -5.00%
- Median HH income
- $45,039
- Composite
- 43.14/100
- National rank
- #3074
- State rank
- #32 of 73 in FL
Livability — Beacon Square
- Score
- 66/100
- State rank
- #600
- US rank
- #11494
Category grades
Schools grade is shown separately in the Schools card above.
Census & demographics
- Census place
- Beacon Square, FL
- County
- Pasco County · 524,098 people
- City population
- 137,708
- Metro
- Tampa-St. Petersburg-Clearwater, FL
- Population (ZIP)
- 27,444
- Household income
- $56,931
- Rent vs Own
- Severe rent burden
- 1190.0
Population outlook (Pasco County) Hauer SSP2
- Today (2025)
- 570,045 people
- By 2030
- 605,844 · +6.3%
- By 2040
- 674,806 · +18.4%
- By 2050
- 736,022 · +29.1%
- By 2075
- 862,900 · +51.4%
- By 2100
- 906,364 · +59.0%
Race, ethnicity, and origin ACS 2023
- Neighborhood character
- Predominantly White (78%)
- Race & ethnicity
- White 78% Hispanic / Latino 13% Two or more races 9% Black 4%
- Hispanic origin (detail)
- Mexican 3% Puerto Rican 4% Cuban 4%
- Common ancestry
- Romanian 4% Lithuanian 3% Slovak 2%
- Foreign-born
- 9% · Canada
- Languages at home
- 87% English-only · Spanish 9% Other Indo-European 1% Russian/Polish/Slavic 1%
Political lean MEDSL · Pasco
- 2024 margin
- Strong R (+25.2) · D 36.9% · R 62.1% · Other 1.0%
- 2008→2024 swing
- -21.6pp toward R · 2008: -3.6pp · 2024: -25.2pp
- All cycles
- 2024: R+25.2 2020: R+20.1 2016: R+21.6 2012: R+6.7 2008: R+3.6
Not yet ingested
- Civics
- —
Market trends
- HPI YoY
- ▼ -109.49%
- Current HPI
- 310.8347
- Rent YoY
- ▲ 0.72%
- Metro
- Tampa-St. Petersburg-Clearwater, FL
- State GDP YoY
- ▲ 3.28%
- F500 in state
- 36
Industry mix (Fortune 500 HQ in FL)
| Industry | F500 HQs | Revenue |
|---|---|---|
| Industrial Technology | 2 | $29B |
|
||
| Insurance | 2 | $17B |
|
||
| Retail | 1 | $60B |
|
||
| Technology Distribution | 1 | $58B |
|
||
| Homebuilding | 1 | $35B |
|
||
| Technology Manufacturing | 1 | $35B |
|
||
Price history
+98.0% since first listed4 events — show timeline
- 2026-05-18 Price Changed $99,000 Stellar MLS as Distributed by MLS Grid
- 2026-05-06 Price Changed $105,000 Stellar MLS as Distributed by MLS Grid
- 2026-04-23 Listed $109,900 Stellar MLS as Distributed by MLS Grid
- 2002-06-12 Sold (Public Records) $50,000 Public Records
Property tax history
+5.3%/yrLatest (2025): $305 · +7.9% YoY. Source: county tax records.
Cash-flow waterfall
monthlySold comps — $/sqft
last 12 mo · ≤1 miLoading sold comps…