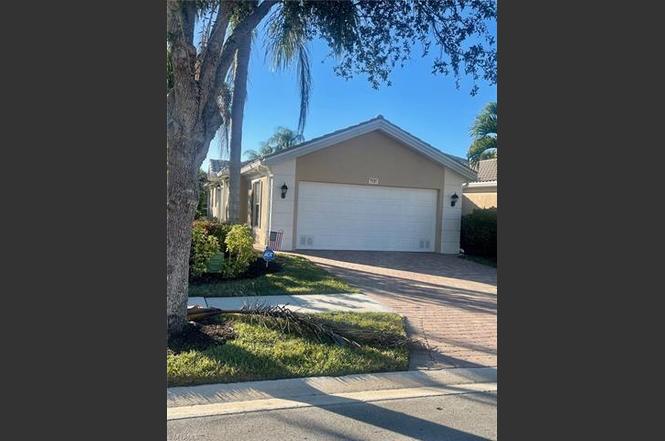
7131 Marconi Ct · Verona Walk, FL
Flood risk 5/10 · Moderate
- FEMA flood zone
- AH
- Chance of flooding over 30 yrs
- 0.24%
- Est. flood insurance / yr
- $1,142 – $2,507
Fire risk 4/10 · Minor
- Est. fire insurance / yr
- $947 – $1,759
Heat risk 10/10 · Severe
- Hot days now (above 108°F)
- 7 days/yr
- Hot days in 30 yrs
- 29 days/yr
Wind risk 10/10 · Severe
- Chance of severe wind over 30 yrs
- 99.0%
Air-quality risk 2/10 · Minimal
- Unhealthy air days now
- 2 days/yr
- Unhealthy air days in 30 yrs
- 2 days/yr
Risk factors via First Street. Map © Google.
Why this score? — see what drove the C- grade
The composite is a weighted blend of 9 inputs, each scored 0–100. Each bar is that input's sub-score; the figure is the points it added to the 100-point composite (weight × sub-score).
- Cash flow +15.7/30.0
- ARV discount +7.5/15.0
- 1% rule +5.1/10.0
- Schools +5.0/10.0
- DSCR +4.8/10.0
- Appreciation +4.3/10.0
- Rent growth +3.3/5.0
- Livability +3.1/5.0
- Condition / age +2.5/5.0
$480,000
🖨 Deal sheet 📄 Offer letter ✓ Due diligence
Listing remarks
This DiVosta Original build has solid poured concrete walls with a privacy wall on the lanai. Stepping outdoors from a bank of sliding glass doors is a covered lanai with attached screen enclosure. The lanai is secured with electric roll-down shutters providing maximum hurricane protection. Here you can enjoy your own heated rectangular pool that has been recently relined in 2024. This 2 bedroom, two bath attached Capri Villa in the desirable gated community of Veronawalk is move in ready. The bedrooms and living room feature new wood flooring, offering both durability and style. Fresh paint throughout the interior and exterior create a bright and inviting atmosphere. Pocket doors from the
Key facts
- Screen enclosure
- Privacy wall
- Covered lanai
Tags
Property features AI
Finance
- Financial info: Total annual recurring HOA fees listed; One-time fees listed
- HOA & community: Mandatory HOA (professional management); Quarterly HOA fee; HOA covers cable, lawn/land maintenance, recreation facilities, security; Community amenities include clubhouse, community pool, exercise room, library, basketball, bike and jog paths; Gated community
Exterior
- Parking: Attached 2-car garage; Automatic garage door
- Security: Gated community with guard at gate
- Utilities: Central water; Central sewer; Cable available
- Home design: Attached villa (1 story/ranch); Rear exposure faces west; Part of the VERONA WALK community
- Construction: Poured concrete construction; Tile roof; Built in 2004; Concrete pool construction
- Exterior features: Patio; Screened, heated in-ground pool (electric); Sliding windows; Electric storm shutters; Stucco exterior; Lake view / waterfront on a lake; Reclaimed irrigation
Interior
- Kitchen: Kitchen island; Pantry; Dishwasher; Disposal; Microwave; Range; Self-cleaning oven; Refrigerator
- Bedrooms: 2 bedrooms plus den
- Flooring: Tile; Wood
- Bathrooms: 2 full bathrooms; Master bathroom with dual sinks and shower (no tub)
- Heating & cooling: Central electric heat; Central electric air conditioning; Ceiling fans
- Interior features: Built-in cabinets; Custom mirrors; Pantry; Smoke detectors; Vaulted ceiling; Walk-in closet; Formal dining; Den/study; Screened lanai/porch; Split bedroom floor plan; 3 ceiling fans; Unfurnished
- Laundry & utility: Washer/dryer hookup; Dryer; Central vacuum
Neighborhood map
What this means for you Summary
Snapshot
- This is a 2-bed/2.0-bath single-family listed at $480k.
Deal economics
- At list price, monthly cash flow is $61 ($735/yr) — positive.
- The deal already cash-flows at list — no discount required.
- Meets the 1% rule at list price ($5k rent vs $480k).
- Recommended offer: $466k (3.0% below list) — sets the bar for market timing.
Location & tenants
- Location reads 62/100 on livability (#746 in FL) — a middle-class / working-renter tenant base. Strengths: crime A+, employment A, housing B+; Watch: health & safety D, schools F, amenities F.
- Collier (suburban): math 60% / reading 56% proficiency, ranked #16 of 73 in FL (top 22%) — acceptable for families but not a draw, mixed tenant base, ~2y average lease.
- Market conditions: Rents rising (+3.2%/yr); 900 active listings in the ZIP; 40 comparable units currently listed for rent nearby; rentals at typical pace (median 24d on market — plan ~3-4 weeks tenant-placement turnaround); solid renter incomes; 3,520 units permitted in Collier County in 2024 (959 in 5+ unit buildings).
- At $4,839/mo this rent would consume 65% of the median local household income ($89k/yr) (locally 550% of renters already pay >50% of income on rent) — very limited rent-growth headroom before tenants either downsize or default.
Forward outlook
- Local home prices are declining (-1.5%/yr); year-one equity from $3k of loan paydown is wiped out by about $7k of value loss. Plan a longer hold.
- Collier County population projected at +30% by 2050 — long-run rental-demand tailwind backs the buy-and-hold thesis.
Negotiation context
- It's been on market 56 days — a 3% lower offer ($466k) is reasonable based on typical stale-listing flexibility.
Risks & watch-outs
- Watch-outs: flood insurance adds $152/mo.
- Climate carrying-cost: in FEMA flood zone AH (mandatory federal flood insurance); severe wind risk, 99% chance of damaging wind over 30y; extreme-heat days projected 7→29/yr by 2055 (HVAC capex compounding) — expect insurance premiums to compound above CPI over the hold.
Questions for the listing agent
- It's been on market 56 days. Have you received any prior offers? Is the seller open to a 3% concession, seller financing, or rate buy-down credit?
- What's the actual annual flood-insurance premium (NFIP or private), and is the property in a SFHA with mandatory coverage?
- What does the HOA fee cover, when was the last increase, and are there any pending special assessments or reserve-fund shortfalls?
- Is there a deadline driving the sale (1031 exchange, divorce, estate, relocation)? That informs how much negotiation room exists.
- Schools are F-rated, which usually means shorter tenancies and higher turnover. Who's the typical renter profile here, and what's been the actual vacancy rate?
- What's the average days-on-market for RENTAL listings here right now (not sales)? A rising rental-DOM trend means longer vacancies and softer asking-rent achievability than the comps imply.
- What's the recent tenant-quality profile in this submarket — average credit score on applications, eviction rate, late-payment / NSF rate, and stable-employment percentage? A property-management company in the area should have these aggregated.
- How much new for-sale + rental construction is in the pipeline within 1–3 miles? Heavy new supply typically softens prices + rents 12–24 months out; constrained supply supports both.
Investment metrics
- 1% rule
- 1.01% ✓
- Cap rate
- 6.83%
- Cash-on-cash
- 1.90%
- DSCR
- 1.08
- GRM
- 8.3
CMA / ARV
No comps found within radius.
Projected returns pro-forma
-1.48% appreciation · 3.21% rent growth · sell at horizon
- IRR
- -7.3%
- Equity multiple
- 0.69×
- Total profit
- $-41,192
- Equity at exit
- $104,886
- IRR
- 0.3%
- Equity multiple
- 1.03×
- Total profit
- $3,471
- Equity at exit
- $101,035
Cash invested: $134,400 (down + closing). Projections, not guarantees.
Landlord ↔ Tenant lean methodology
- Overall (STATE)
- 87 Strongly Landlord-Friendly
- State Florida
- 87 Strongly Landlord-Friendly · R+3
- County
- — inherits STATE
- City
- — inherits STATE
ZIP-level market 34114
- Home prices YoY
- -0.6%
- Rents YoY
- 3.2%
- Active inventory
- 900
- Price-to-rent
- 8.3×
Monthly cashflow live
- Estimated rent
- $4,839 high interval (Pro) →
- Mortgage (P&I)
- −$2,517
- Tax from tax record
- −$432 /mo · $5,188/yr
- Insurance
- −$200
- Flood insurance flood zone
- −$152 /mo · $1,824/yr
- HOA
- −$460
- Vacancy / Maint / Mgmt
- −$1,016
- Net cashflow
- $61
Break-even live
UW: 25.0% down · 7.5% · 30yr · 1.5% tax · 5.0% vac · 8.0% maint · 8.0% mgmt
Financing live
Cash to close
- Down payment
- $120,000
- Closing costs
- $14,400
- Reserves months
- —
- Total cash needed
- —
Loan-product check · same deal, 3 products live
Conventional
25% down · 7.5% · 30yr
- Down + closing
- —
- Monthly P&I
- —
- Monthly cashflow
- —
- DSCR
- —
- Eligible?
- —
Personal DTI + credit; lowest rate.
DSCR
20% down · 8.5% · 30yr
- Down + closing
- —
- Monthly P&I
- —
- Monthly cashflow
- —
- DSCR
- —
- Eligible?
- —
No personal income docs; deal must DSCR.
Hard money
10% down · 12.0% · 12mo
- Down + closing
- —
- Monthly P&I
- —
- Monthly cashflow
- —
- DSCR
- —
- Eligible?
- —
Short-term bridge; refi at stabilization.
Rent comps 40 comps
| Address | Beds | Baths | Sqft | Rent | $/sqft | DOM | Units | Dist |
|---|---|---|---|---|---|---|---|---|
| 7114 Marconi Ct Naples, FL | 2.0 | 2.0 | 1554 | $2,800 | $1.80 | 23d | 1 | 0.08mi |
| 7864 Ionio Ct Naples, FL | 2.0 | 2.0 | 1540 | $4,500 | $2.92 | 13d | 1 | 0.18mi |
| 7840 Ionio Ct Naples, FL | 2.0 | 2.0 | 1540 | $2,700 | $1.75 | 23d | 1 | 0.21mi |
| 8109 Chianti Ln Naples, FL | 3.0 | 3.0 | 1860 | $5,500 | $2.96 | 23d | 1 | 0.26mi |
| 7390 Emilia Ln Naples, FL | 2.0 | 2.0 | 1710 | $2,100 | $1.23 | 23d | 1 | 0.27mi |
| 7278 Salerno Ct Unit 1049689P Naples, FL | 3.0 | 2.0 | 1539 | $6,683 | $4.34 | 13d | 1 | 0.28mi |
| 7294 Salerno Ct Naples, FL | 3.0 | 2.0 | 1542 | $4,250 | $2.76 | 23d | 1 | 0.30mi |
| 8047 Sorrento Ln Naples, FL | 3.0 | 3.0 | 1890 | $2,750 | $1.46 | 23d | 1 | 0.31mi |
| 7310 Salerno Ct Naples, FL | 3.0 | 2.0 | 1540 | $5,000 | $3.25 | 23d | 1 | 0.32mi |
| 7450 Emilia Ln Naples, FL | 2.0 | 2.0 | 1554 | $5,500 | $3.54 | 23d | 1 | 0.33mi |
| 8081 Players Cove Dr #101 Naples, FL | 2.0 | 2.5 | 2091 | $9,500 | $4.54 | 23d | 1 | 0.39mi |
| 8200 Saratoga Dr #401 Naples, FL | 2.0 | 2.0 | 1880 | $8,500 | $4.52 | 23d | 1 | 0.39mi |
| 8693 Querce Ct Naples, FL | 2.0 | 2.0 | 1415 | $5,000 | $3.53 | 23d | 1 | 0.45mi |
| 8073 Panther Trl #1404 Naples, FL | 2.0 | 2.0 | 1450 | $5,500 | $3.79 | 23d | 1 | 0.47mi |
| 8177 Saratoga Dr #1001 Naples, FL | 2.0 | 2.0 | 1880 | $8,000 | $4.26 | 23d | 1 | 0.47mi |
| 8177 Saratoga Dr #1002 Naples, FL | 2.0 | 2.0 | 1880 | $9,000 | $4.79 | 23d | 1 | 0.47mi |
| 7832 Hawthorne Dr #1901 Naples, FL | 2.0 | 2.0 | 1880 | $8,325 | $4.43 | 23d | 1 | 0.49mi |
| 8060 Players Cove Dr #101 Naples, FL | 2.0 | 2.5 | 2091 | $4,800 | $2.30 | 23d | 1 | 0.49mi |
| 7837 Hawthorne Dr #1102 Naples, FL | 2.0 | 2.0 | 1880 | $8,000 | $4.26 | 23d | 1 | 0.50mi |
| 7539 Novara Ct Naples, FL | 2.0 | 2.0 | 1680 | $3,000 | $1.79 | 23d | 1 | 0.51mi |
| 8055 Tiger Cv Unit 6-606 Naples, FL | 2.0 | 2.0 | 1439 | $1,800 | $1.25 | 23d | 1 | 0.52mi |
| 8138 Saratoga Dr #2201 Naples, FL | 2.0 | 2.0 | 1880 | $8,000 | $4.26 | 23d | 1 | 0.53mi |
| 8065 Tiger Cv Naples, FL | 2.0 | 2.0 | 1203 | $2,495 | $2.07 | 23d | 1 | 0.55mi |
| 8065 Tiger Cv #1604 Naples, FL | 2.0 | 2.0 | 1203 | $2,495 | $2.07 | 21d | 1 | 0.55mi |
| 8949 Malibu St #304 Naples, FL | 3.0 | 2.0 | 1771 | $6,500 | $3.67 | 23d | 1 | 0.57mi |
| 317 Spiaggio Ct Naples, FL | 3.0 | 2.0 | 2034 | $4,200 | $2.06 | 23d | 1 | 0.58mi |
| 8051 Players Cove Dr #102 Naples, FL | 3.0 | 2.5 | 2091 | $8,000 | $3.83 | 23d | 1 | 0.58mi |
| 8539 Alessandria Ct Naples, FL | 3.0 | 2.0 | 2000 | $3,500 | $1.75 | 21d | 1 | 0.60mi |
| 8085 Celeste Dr #812 Naples, FL | 2.0 | 2.0 | 1480 | $6,000 | $4.05 | 13d | 1 | 0.62mi |
| 7872 Umberto Ct Naples, FL | 2.0 | 2.0 | 1540 | $2,975 | $1.93 | 23d | 1 | 0.67mi |
| 8992 Cambria Cir Unit 1546062P Naples, FL | 3.0 | 2.0 | 2002 | $3,097 | $1.55 | 13d | 1 | 0.68mi |
| 8664 Genova Ct Naples, FL | 3.0 | 2.0 | 1554 | $3,200 | $2.06 | 23d | 1 | 0.69mi |
| 8989 Cambria Cir #1807 Naples, FL | 3.0 | 2.5 | 2008 | $7,000 | $3.49 | 13d | 1 | 0.71mi |
| 8125 Celeste Dr #5216 Naples, FL | 3.0 | 2.0 | 1640 | $4,500 | $2.74 | 23d | 1 | 0.72mi |
| 8125 Celeste Dr #5113 Naples, FL | 3.0 | 2.0 | 1635 | $7,000 | $4.28 | 23d | 1 | 0.72mi |
| 8023 Players Cove Dr Unit 6-101 Naples, FL | 2.0 | 2.5 | 2091 | $10,000 | $4.78 | 23d | 1 | 0.74mi |
| 8986 Cambria Cir Unit 22 Naples, FL | 2.0 | 2.0 | 1404 | $6,000 | $4.27 | 23d | 1 | 0.78mi |
| 8986 Cambria Cir #2204 Naples, FL | 3.0 | 2.0 | 1771 | $7,500 | $4.23 | 23d | 1 | 0.78mi |
| 379 Grace Bay Ln Naples, FL | 3.0 | 2.0 | 1816 | $8,000 | $4.41 | 21d | 1 | 0.79mi |
| 8419 Benelli Ct Naples, FL | 3.0 | 2.0 | 1900 | $3,300 | $1.74 | 23d | 1 | 0.80mi |
HOA detail
- Monthly dues
- $460 · $5,520/yr
- Likely covers
- electricpoolsecurity
Listing history 6 events
-
2026-06-18days on market $480,000 Active 56 DOM
-
2026-06-17days on market $480,000 Active 55 DOM
-
2026-06-16status $480,000 Active 54 DOM
-
2026-04-22status Pending
-
2026-03-10price $480,000
-
2026-02-27$515,000 Active
ⓘ Source: listings_history table (triggers on properties + properties_extension) + one-shot
backfill from property_details.listing_events for pre-trigger history.
Tax reassessment forecast FL · Resets to sale price
- Current annual tax
- $5,188 · $432/mo
- Projected year-2 tax
- $5,188 · $432/mo
- Expected delta
- $0/yr ($0/mo · 0.0%)
ⓘ Screening estimate from a state-policy table — verify with the county assessor before closing.
Climate risk First Street
- Flood 5/10 Major FEMA zone AH · 24% chance over 30 yrs
- Wildfire 4/10 Moderate
- Heat 10/10 Extreme 7 d/yr ≥108°F today · 29 d/yr by 30 yrs out
- Wind 10/10 Extreme 99% chance of damaging wind over 30 yrs
- Air quality 2/10 Low 2 unhealthy d/yr today · 2 by 30 yrs out
Nearby sold comps map
Loading sold comps map…
Walkable amenities ~0.75 mi
Loading nearby amenities…
Taxation est. · year 1
- Rental income
- $58,068
- − Mortgage interest
- −$26,887
- − Property taxes
- −$5,188
- − Insurance
- −$4,224
- − Repairs & maintenance
- −$4,645
- − Management
- −$4,645
- − HOA
- −$5,520
- − Depreciation
- −$13,964
- Taxable loss
- −$7,007
- Est. tax savings @ 24.0%
- +$1,682
- After-tax cash flow
- $2,416/yr
For passive investors: Depreciation is non-cash, so a rental often shows a tax loss while cash-flowing — sheltering income. Rental losses are passive: they offset passive income freely, and up to $25,000/yr can offset ordinary (W-2) income if you actively participate and your MAGI is under $100k (phasing out to $0 by $150k); unused losses carry forward. On sale, claimed depreciation is recaptured at up to 25%, and gains may owe capital-gains tax (a 1031 exchange can defer both). Figures are a year-1 estimate at your 24.0% rate — not tax advice; consult a CPA.
Schools (NCES district)
- District
- Collier
- NCES district ID
- 1200330
- Math proficiency
- 60% ▼ -4.00%
- Reading proficiency
- 56% ▼ -2.00%
- Median HH income
- $58,275
- Composite
- 50.23/100
- National rank
- #1892
- State rank
- #16 of 73 in FL
Livability — Verona Walk
- Score
- 62/100
- State rank
- #746
- US rank
- #16132
Category grades
Schools grade is shown separately in the Schools card above.
Census & demographics
- Census place
- Verona Walk, FL
- County
- Collier County · 396,295 people
- Metro
- Naples-Marco Island, FL
- Population (ZIP)
- 23,559
- Household income
- $89,334
- Rent vs Own
- Severe rent burden
- 550.0
Population outlook (Collier County) Hauer SSP2
- Today (2025)
- 420,858 people
- By 2030
- 450,054 · +6.9%
- By 2040
- 502,232 · +19.3%
- By 2050
- 544,932 · +29.5%
- By 2075
- 627,203 · +49.0%
- By 2100
- 659,015 · +56.6%
Race, ethnicity, and origin ACS 2023
- Neighborhood character
- Predominantly White (72%)
- Race & ethnicity
- White 72% Hispanic / Latino 17% Two or more races 13% Black 7%
- Hispanic origin (detail)
- Mexican 7% Puerto Rican 1% Cuban 3%
- Common ancestry
- Hispanic 5% Romanian 4% Lithuanian 1%
- Foreign-born
- 21% · Canada, Jamaica
- Languages at home
- 75% English-only · Spanish 15% French/Haitian/Cajun 5% Other Indo-European 4%
Political lean MEDSL · Collier
- 2024 margin
- Solid R (+33.1) · D 33.1% · R 66.2%
- 2008→2024 swing
- -10.6pp toward R · 2008: -22.5pp · 2024: -33.1pp
- All cycles
- 2024: R+33.1 2020: R+24.7 2016: R+26.0 2012: R+30.1 2008: R+22.5
Not yet ingested
- Civics
- —
Market trends
- HPI YoY
- ▼ -1.48%
- Current HPI
- 266.5545
- Rent YoY
- ▲ 3.21%
- Metro
- Naples-Marco Island, FL
- State GDP YoY
- ▲ 3.28%
- F500 in state
- 36
Industry mix (Fortune 500 HQ in FL)
| Industry | F500 HQs | Revenue |
|---|---|---|
| Industrial Technology | 2 | $29B |
|
||
| Insurance | 2 | $17B |
|
||
| Retail | 1 | $60B |
|
||
| Technology Distribution | 1 | $58B |
|
||
| Homebuilding | 1 | $35B |
|
||
| Technology Manufacturing | 1 | $35B |
|
||
Price history
-6.8% since first listed3 events — show timeline
- 2026-04-22 Pending — NAPLESMLS
- 2026-03-10 Price Changed $480,000 NAPLESMLS
- 2026-02-27 Listed $515,000 NAPLESMLS
Property tax history
+6.2%/yrLatest (2025): $5,188 · +7.4% YoY. Source: county tax records.
Cash-flow waterfall
monthlySold comps — $/sqft
last 12 mo · ≤1 miLoading sold comps…