6840 Beach Resort Dr #4 · Lely Resort, FL
Flood risk 8/10 · Major
- FEMA flood zone
- AE
- Chance of flooding over 30 yrs
- 0.96%
- Est. flood insurance / yr
- $1,737 – $8,500
Fire risk 4/10 · Minor
- Est. fire insurance / yr
- $947 – $1,759
Heat risk 10/10 · Severe
- Hot days now (above 108°F)
- 7 days/yr
- Hot days in 30 yrs
- 28 days/yr
Wind risk 10/10 · Severe
- Chance of severe wind over 30 yrs
- 99.0%
Air-quality risk 2/10 · Minimal
- Unhealthy air days now
- 2 days/yr
- Unhealthy air days in 30 yrs
- 2 days/yr
Risk factors via First Street. Map © Google.
Why this score? — see what drove the B- grade
The composite is a weighted blend of 9 inputs, each scored 0–100. Each bar is that input's sub-score; the figure is the points it added to the 100-point composite (weight × sub-score).
- Cash flow +25.1/30.0
- 1% rule +8.4/10.0
- DSCR +8.2/10.0
- ARV discount +7.5/15.0
- Schools +5.0/10.0
- Appreciation +4.3/10.0
- Rent growth +3.3/5.0
- Livability +3.1/5.0
- Condition / age +2.5/5.0
$339,900
🖨 Deal sheet 📄 Offer letter ✓ Due diligence
Listing remarks MLS
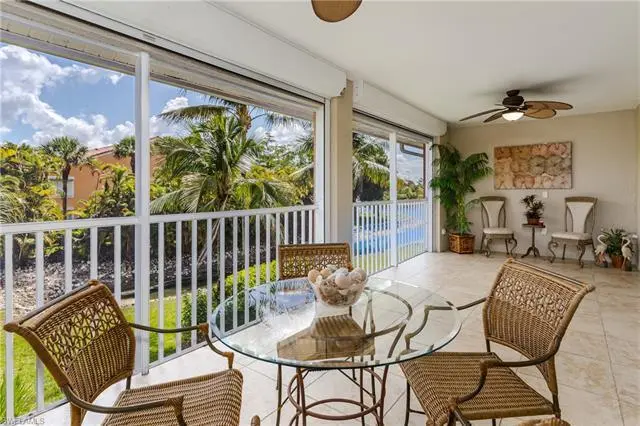
Wonderful second floor unit with lake view offering vaulted ceilings and tile throughout living area. Visit the lazy river pool for a relaxing day in the sun.
Key facts
- Pickleball
- Screened lanai
- Storm shutters
Tags
Property features AI
Finance
- Other: Property is part of a multi-unit complex (425 units total, 16 in this building); This listing is one of 2 units per floor in the building; Possession at closing; Restrictions: limited number of vehicles, no commercial vehicles, no RVs
- Financial info: Condo fee: $1,975 quarterly; Total annual recurring fees reported: $7,900; One-time fees reported: $200
- HOA & community: Quarterly condo fee; Condo management; Community maintenance covers cable, insurance, irrigation water, lawn/land maintenance, exterior and interior pest control, reserves, sewer, street lights and street maintenance, water; Community amenities include clubhouse, community pool, tennis, pickleball, bocce, shuffleboard and internet access; Gated community; Total annual recurring fees listed as quarterly equivalent
Exterior
- Parking: Common parking; Detached 1-car garage
- Security: Gated community; Electric storm shutters
- Utilities: Central water; Central sewer; Cable available
- Home design: Residential property in a low-rise building (1–3 stories); Built in 2002; Concrete block construction; Tile roof; Rear exposure faces northeast; Located in Falling Waters Beach Resort (gated community)
- Construction: Concrete block construction; Stucco exterior; Tile roof; Built in 2002
- Exterior features: Outdoor kitchen; Sliding windows; Electric storm shutters; Stucco finish; Lakefront with water feature view; Irrigation from lake/canal; Private road access; Zero lot line
Interior
- Kitchen: Dishwasher; Microwave; Range; Refrigerator; Outdoor kitchen (exterior amenity)
- Bedrooms: 2 bedrooms (split bedroom floor plan)
- Flooring: Tile flooring
- Bathrooms: 2 full bathrooms; Primary bath with dual sinks and shower (no tub)
- Heating & cooling: Central electric heating; Central electric cooling
- Interior features: Fire sprinkler system; Laundry tub; Vaulted ceilings; Walk-in closet; Screened lanai/porch; Dining area in living room; Eat-in kitchen; Partially furnished; 5 ceiling fans
- Laundry & utility: Laundry in residence; Laundry tub
Neighborhood map
What this means for you Summary
Snapshot
- This is a 2-bed/2.0-bath condo listed at $340k.
Deal economics
- At list price, monthly cash flow is $325 ($4k/yr) — positive.
- The deal already cash-flows at list — no discount required.
- Meets the 1% rule at list price ($5k rent vs $340k).
- Recommended offer: $330k (3.0% below list) — sets the bar for market timing.
Location & tenants
- Location reads 61/100 on livability (#786 in FL) — a middle-class / working-renter tenant base. Strengths: crime A+, employment A-; Watch: health & safety D, amenities F, commute F.
- Collier (suburban): math 60% / reading 56% proficiency, ranked #16 of 73 in FL (top 22%) — acceptable for families but not a draw, mixed tenant base, ~2y average lease.
- Zoned schools: Lely Elementary School (math 45% / reading 46%, grade D-, #1,247 of 2,144 statewide, top 59%, 499 students, 62% FRL); Lely High School (math 40% / reading 39%, grade F, #304 of 667 statewide, top 47%, 1,504 students, 54% FRL) — zoned schools at 58% FRL track the district average.
- Zoned-school proficiency averages 42% at this address vs 58% district-wide (-16 pts) — the specific schools serving this property underperform the Collier average; the district grade overstates school quality for this exact location.
- Market conditions: Rents rising (+3.2%/yr); 900 active listings in the ZIP; 40 comparable units currently listed for rent nearby; rentals at typical pace (median 23d on market — plan ~3-4 weeks tenant-placement turnaround); solid renter incomes; 3,520 units permitted in Collier County in 2024 (959 in 5+ unit buildings).
- At $4,571/mo this rent would consume 61% of the median local household income ($89k/yr) (locally 550% of renters already pay >50% of income on rent) — very limited rent-growth headroom before tenants either downsize or default.
Forward outlook
- Local home prices are declining (-1.5%/yr); year-one equity from $2k of loan paydown is wiped out by about $5k of value loss. Plan a longer hold.
- Collier County population projected at +30% by 2050 — long-run rental-demand tailwind backs the buy-and-hold thesis.
Negotiation context
- It's been on market 31 days — a 3% lower offer ($330k) is reasonable based on typical stale-listing flexibility.
- 2 sale attempts since 17y ago with the ask held roughly flat each time — persistent listings suggest the price (not the market) is what's stuck; bring a comps-based counter.
- Current owner paid $185k; list at $340k implies a 84% gain — meaningful room to come down on a strong offer.
Risks & watch-outs
- Watch-outs: flood insurance adds $427/mo.
- Climate carrying-cost: in FEMA flood zone AE (mandatory federal flood insurance); severe wind risk, 99% chance of damaging wind over 30y; extreme-heat days projected 7→28/yr by 2055 (HVAC capex compounding) — expect insurance premiums to compound above CPI over the hold.
Questions for the listing agent
- It's been on market 31 days. Have you received any prior offers? Is the seller open to a 3% concession, seller financing, or rate buy-down credit?
- What's the actual annual flood-insurance premium (NFIP or private), and is the property in a SFHA with mandatory coverage?
- What does the HOA fee cover, when was the last increase, and are there any pending special assessments or reserve-fund shortfalls?
- Any open or pending special assessments — roof, HVAC, plumbing, elevator, façade? What's the per-unit balance and payoff schedule, and is the seller paying it off at close or rolling it to the buyer?
- Is there a deadline driving the sale (1031 exchange, divorce, estate, relocation)? That informs how much negotiation room exists.
- Schools are F-rated, which usually means shorter tenancies and higher turnover. Who's the typical renter profile here, and what's been the actual vacancy rate?
- What's the average days-on-market for RENTAL listings here right now (not sales)? A rising rental-DOM trend means longer vacancies and softer asking-rent achievability than the comps imply.
- What's the recent tenant-quality profile in this submarket — average credit score on applications, eviction rate, late-payment / NSF rate, and stable-employment percentage? A property-management company in the area should have these aggregated.
- How much new apartment / multifamily construction is in the pipeline within 1–3 miles? Heavy new supply (>2% of stock underway) typically softens rents 12–24 months out; light construction supports rent growth.
Investment metrics
- 1% rule
- 1.34% ✓
- Cap rate
- 8.95%
- Cash-on-cash
- 9.48%
- DSCR
- 1.42
- GRM
- 6.2
CMA / ARV
No comps found within radius.
Projected returns pro-forma
-1.48% appreciation · 3.21% rent growth · sell at horizon
- IRR
- -2.6%
- Equity multiple
- 0.89×
- Total profit
- $-10,593
- Equity at exit
- $74,273
- IRR
- 5.1%
- Equity multiple
- 1.47×
- Total profit
- $44,348
- Equity at exit
- $71,545
Cash invested: $95,172 (down + closing). Projections, not guarantees.
Landlord ↔ Tenant lean methodology
- Overall (STATE)
- 87 Strongly Landlord-Friendly
- State Florida
- 87 Strongly Landlord-Friendly · R+3
- County
- — inherits STATE
- City
- — inherits STATE
ZIP-level market 34114
- Home prices YoY
- -0.6%
- Rents YoY
- 3.2%
- Active inventory
- 900
- Price-to-rent
- 6.2×
Monthly cashflow live
- Estimated rent
- $4,571 high interval (Pro) →
- Mortgage (P&I)
- −$1,782
- Tax from tax record
- −$277 /mo · $3,329/yr
- Insurance
- −$142
- Flood insurance flood zone
- −$427 /mo · $5,118/yr
- HOA
- −$658
- Vacancy / Maint / Mgmt
- −$960
- Net cashflow
- $325
Break-even live
UW: 25.0% down · 7.5% · 30yr · 1.5% tax · 5.0% vac · 8.0% maint · 8.0% mgmt
Financing live
Cash to close
- Down payment
- $84,975
- Closing costs
- $10,197
- Reserves months
- —
- Total cash needed
- —
Loan-product check · same deal, 3 products live
Conventional
25% down · 7.5% · 30yr
- Down + closing
- —
- Monthly P&I
- —
- Monthly cashflow
- —
- DSCR
- —
- Eligible?
- —
Personal DTI + credit; lowest rate.
DSCR
20% down · 8.5% · 30yr
- Down + closing
- —
- Monthly P&I
- —
- Monthly cashflow
- —
- DSCR
- —
- Eligible?
- —
No personal income docs; deal must DSCR.
Hard money
10% down · 12.0% · 12mo
- Down + closing
- —
- Monthly P&I
- —
- Monthly cashflow
- —
- DSCR
- —
- Eligible?
- —
Short-term bridge; refi at stabilization.
Rent comps 40 comps
| Address | Beds | Baths | Sqft | Rent | $/sqft | DOM | Units | Dist |
|---|---|---|---|---|---|---|---|---|
| 6590 Beach Resort Dr Unit 305 Naples, FL | 2.0 | 2.0 | 1351 | $4,500 | $3.33 | 13d | 1 | 0.13mi |
| 6650 Beach Resort Dr Unit 908 Naples, FL | 2.0 | 2.0 | 1351 | $4,600 | $3.40 | 13d | 1 | 0.33mi |
| 6750 Beach Resort Dr #7 Naples, FL | 2.0 | 2.0 | 1351 | $3,900 | $2.89 | 23d | 1 | 0.38mi |
| 6750 Beach Resort Dr Naples, FL | 2.0 | 2.0 | 1351 | $3,200 | $2.37 | 13d | 2 | 0.38mi |
| 9175 Celeste Dr Unit 105 Naples, FL | 2.0 | 2.0 | 1000 | $2,000 | $2.00 | 23d | 1 | 0.38mi |
| 9187 Celeste Dr Unit 1073494P Naples, FL | 2.0 | 2.0 | 1399 | $2,979 | $2.13 | 13d | 1 | 0.39mi |
| 9165 Celeste Dr Unit 3-303 Naples, FL | 2.0 | 2.0 | 1000 | $6,500 | $6.50 | 23d | 1 | 0.44mi |
| 9159 Delano St #9905 Naples, FL | 3.0 | 2.0 | 1770 | $4,995 | $2.82 | 23d | 1 | 0.48mi |
| 6680 Beach Resort Dr Unit 1214 Naples, FL | 2.0 | 2.0 | 1351 | $4,500 | $3.33 | 13d | 1 | 0.48mi |
| 9155 Delano St Unit 1545913P Naples, FL | 3.0 | 2.0 | 1797 | $3,871 | $2.15 | 13d | 1 | 0.49mi |
| 9151 Delano St #9702 Naples, FL | 3.0 | 2.5 | 1733 | $2,650 | $1.53 | 13d | 1 | 0.51mi |
| 22 Cypress View Dr Unit B22 Naples, FL | 2.0 | 2.0 | 1534 | $7,000 | $4.56 | 23d | 1 | 0.54mi |
| 9118 Chula Vista St #12002 Naples, FL | 2.0 | 2.5 | 1531 | $4,200 | $2.74 | 23d | 1 | 0.61mi |
| 9111 Capistrano St S #8303 Naples, FL | 2.0 | 2.5 | 1432 | $7,500 | $5.24 | 23d | 1 | 0.65mi |
| 9115 Capistrano St S #8207 Naples, FL | 2.0 | 2.5 | 1494 | $6,000 | $4.02 | 23d | 1 | 0.65mi |
| 9102 Chula Vista St #11302 Naples, FL | 2.0 | 2.5 | 1531 | $2,695 | $1.76 | 21d | 1 | 0.68mi |
| 9109 Yuba Ln Unit 80 Naples, FL | 3.0 | 2.5 | 1729 | $3,900 | $2.26 | 23d | 1 | 0.69mi |
| 7052 Live Oak Dr Naples, FL | 2.0 | 2.0 | 1685 | $9,000 | $5.34 | 23d | 1 | 0.69mi |
| 9092 Chula Vista St #11003 Naples, FL | 2.0 | 2.0 | 1404 | $6,850 | $4.88 | 23d | 1 | 0.71mi |
| 9088 Chula Vista St Unit 108-3 Naples, FL | 2.0 | 2.0 | 1404 | $5,700 | $4.06 | 23d | 1 | 0.73mi |
| 9102 Capistrano St S Unit 72-3 Naples, FL | 2.0 | 2.5 | 1520 | $6,500 | $4.28 | 23d | 1 | 0.73mi |
| 8540 Mystic Greens Way #305 Naples, FL | 2.0 | 2.0 | 1710 | $4,995 | $2.92 | 13d | 1 | 0.74mi |
| 9081 Albion Ln S #6505 Naples, FL | 2.0 | 2.0 | 1225 | $7,500 | $6.12 | 23d | 1 | 0.78mi |
| 9072 Rialto St #6302 Naples, FL | 3.0 | 2.0 | 1771 | $8,250 | $4.66 | 21d | 1 | 0.80mi |
| 9076 Rialto St Unit 62 Naples, FL | 3.0 | 2.5 | 1624 | $7,500 | $4.62 | 23d | 1 | 0.81mi |
| 9175 Michael Cir #4 Naples, FL | 3.0 | 2.0 | 1639 | $3,195 | $1.95 | 13d | 1 | 0.81mi |
| 9073 Rialto St #6002 Naples, FL | 3.0 | 2.0 | 1771 | $7,500 | $4.23 | 23d | 1 | 0.84mi |
| 9022 Michael Cir Unit 2-205 Naples, FL | 2.0 | 2.0 | 1450 | $3,500 | $2.41 | 23d | 1 | 0.84mi |
| 9071 Albion Ln N #5706 Naples, FL | 2.0 | 2.5 | 1441 | $2,200 | $1.53 | 23d | 1 | 0.84mi |
| 9066 Albion Ln N #5106 Naples, FL | 3.0 | 2.5 | 1715 | $6,500 | $3.79 | 21d | 1 | 0.85mi |
| 9082 Capistrano St N Unit 48-5 Naples, FL | 2.0 | 2.0 | 1227 | $6,500 | $5.30 | 23d | 1 | 0.88mi |
| 8965 Malibu Ln #802 Naples, FL | 3.0 | 2.0 | 1771 | $6,595 | $3.72 | 23d | 1 | 0.88mi |
| 8519 Chase Preserve Dr Naples, FL | 2.0 | 2.0 | 1827 | $9,000 | $4.93 | 23d | 1 | 0.97mi |
| 9054 Capistrano St N #4003 Naples, FL | 2.0 | 2.0 | 1385 | $2,495 | $1.80 | 23d | 1 | 0.97mi |
| 9054 Capistrano St N #4002 Naples, FL | 3.0 | 2.0 | 1674 | $6,000 | $3.58 | 23d | 1 | 0.97mi |
| 1747 Beverly Dr Naples, FL | 2.0 | 2.0 | 1080 | $2,300 | $2.13 | 23d | 1 | 0.99mi |
| 274 Riverwood Rd Unit 1546056P Naples, FL | 2.0 | 2.0 | 1496 | $4,451 | $2.98 | 13d | 1 | 1.00mi |
| 8175 Celeste Dr Naples, FL | 2.0 | 2.0 | 1460 | $2,395 | $1.64 | 23d | 1 | 1.05mi |
| 8175 Celeste Dr #1230 Naples, FL | 2.0 | 2.0 | 1476 | $2,775 | $1.88 | 23d | 1 | 1.05mi |
| 8175 Celeste Dr #1229 Naples, FL | 3.0 | 2.0 | 1640 | $2,975 | $1.81 | 23d | 1 | 1.05mi |
HOA detail condo
- Monthly dues
- $658 · $7,896/yr
- Likely covers
- pool
- Assessments
- None detected in remarks — confirm with the listing agent.
Listing history 13 events
-
2026-06-18days on market $339,900 Active 31 DOM
-
2026-06-17days on market $339,900 Active 30 DOM
-
2026-06-16days on market $339,900 Active 29 DOM
-
2026-06-15days on market $339,900 Active 28 DOM
-
2026-06-14days on market $339,900 Active 26 DOM
-
2026-06-10days on market $339,900 Active 23 DOM
-
2026-06-09days on market $339,900 Active 22 DOM
-
2026-06-08days on market $339,900 Active 21 DOM
-
2026-06-07pricedays on market $339,900 Active 20 DOM
-
2026-06-03days on market $349,900 Active 16 DOM
-
2026-06-02days on market $349,900 Active 15 DOM
-
2026-06-01remarks 683-char remark
-
2026-06-01$349,900 Active 14 DOM
ⓘ Source: listings_history table (triggers on properties + properties_extension) + one-shot
backfill from property_details.listing_events for pre-trigger history.
Tax reassessment forecast FL · Resets to sale price
- Current annual tax
- $3,329 · $277/mo
- Projected year-2 tax
- $3,329 · $277/mo
- Expected delta
- $0/yr ($0/mo · 0.0%)
ⓘ Screening estimate from a state-policy table — verify with the county assessor before closing.
Climate risk First Street
- Flood 8/10 Severe FEMA zone AE · 96% chance over 30 yrs
- Wildfire 4/10 Moderate
- Heat 10/10 Extreme 7 d/yr ≥108°F today · 28 d/yr by 30 yrs out
- Wind 10/10 Extreme 99% chance of damaging wind over 30 yrs
- Air quality 2/10 Low 2 unhealthy d/yr today · 2 by 30 yrs out
Nearby sold comps map
Loading sold comps map…
Walkable amenities ~0.75 mi
Loading nearby amenities…
Taxation est. · year 1
- Rental income
- $54,851
- − Mortgage interest
- −$19,040
- − Property taxes
- −$3,329
- − Insurance
- −$6,818
- − Repairs & maintenance
- −$4,388
- − Management
- −$4,388
- − HOA
- −$7,896
- − Depreciation
- −$9,888
- Taxable loss
- −$896
- Est. tax savings @ 24.0%
- +$215
- After-tax cash flow
- $4,114/yr
For passive investors: Depreciation is non-cash, so a rental often shows a tax loss while cash-flowing — sheltering income. Rental losses are passive: they offset passive income freely, and up to $25,000/yr can offset ordinary (W-2) income if you actively participate and your MAGI is under $100k (phasing out to $0 by $150k); unused losses carry forward. On sale, claimed depreciation is recaptured at up to 25%, and gains may owe capital-gains tax (a 1031 exchange can defer both). Figures are a year-1 estimate at your 24.0% rate — not tax advice; consult a CPA.
Schools (NCES district)
- District
- Collier
- NCES district ID
- 1200330
- Math proficiency
- 60% ▼ -4.00%
- Reading proficiency
- 56% ▼ -2.00%
- Median HH income
- $58,275
- Composite
- 50.23/100
- National rank
- #1892
- State rank
- #16 of 73 in FL
Livability — Lely Resort
- Score
- 61/100
- State rank
- #786
- US rank
- #17981
Category grades
Schools grade is shown separately in the Schools card above.
Census & demographics
- County
- Collier County · 396,295 people
- Metro
- Naples-Marco Island, FL
- Population (ZIP)
- 23,559
- Household income
- $89,334
- Rent vs Own
- Severe rent burden
- 550.0
Population outlook (Collier County) Hauer SSP2
- Today (2025)
- 420,858 people
- By 2030
- 450,054 · +6.9%
- By 2040
- 502,232 · +19.3%
- By 2050
- 544,932 · +29.5%
- By 2075
- 627,203 · +49.0%
- By 2100
- 659,015 · +56.6%
Race, ethnicity, and origin ACS 2023
- Neighborhood character
- Predominantly White (72%)
- Race & ethnicity
- White 72% Hispanic / Latino 17% Two or more races 13% Black 7%
- Hispanic origin (detail)
- Mexican 7% Puerto Rican 1% Cuban 3%
- Common ancestry
- Hispanic 5% Romanian 4% Lithuanian 1%
- Foreign-born
- 21% · Canada, Jamaica
- Languages at home
- 75% English-only · Spanish 15% French/Haitian/Cajun 5% Other Indo-European 4%
Political lean MEDSL · Collier
- 2024 margin
- Solid R (+33.1) · D 33.1% · R 66.2%
- 2008→2024 swing
- -10.6pp toward R · 2008: -22.5pp · 2024: -33.1pp
- All cycles
- 2024: R+33.1 2020: R+24.7 2016: R+26.0 2012: R+30.1 2008: R+22.5
Not yet ingested
- Civics
- —
Market trends
- HPI YoY
- ▼ -1.48%
- Current HPI
- 266.5545
- Rent YoY
- ▲ 3.21%
- Metro
- Naples-Marco Island, FL
- State GDP YoY
- ▲ 3.28%
- F500 in state
- 36
Industry mix (Fortune 500 HQ in FL)
| Industry | F500 HQs | Revenue |
|---|---|---|
| Industrial Technology | 2 | $29B |
|
||
| Insurance | 2 | $17B |
|
||
| Retail | 1 | $60B |
|
||
| Technology Distribution | 1 | $58B |
|
||
| Homebuilding | 1 | $35B |
|
||
| Technology Manufacturing | 1 | $35B |
|
||
Price history
+62.7% since first listed6 events — show timeline
- 2026-05-18 Listed $349,900 NAPLESMLS
- 2015-04-30 Sold (Public Records) $185,000 Public Records
- 2009-03-30 Sold (Public Records) $145,000 Public Records
- 2009-03-27 Sold (MLS) $145,000 NAPLESMLS
- 2009-02-11 Listed $165,111 NAPLESMLS
- 2004-10-20 Sold (Public Records) $215,000 Public Records
Property tax history
+6.9%/yrLatest (2025): $3,329 · +5.1% YoY. Source: county tax records.
Cash-flow waterfall
monthlySold comps — $/sqft
last 12 mo · ≤1 miLoading sold comps…