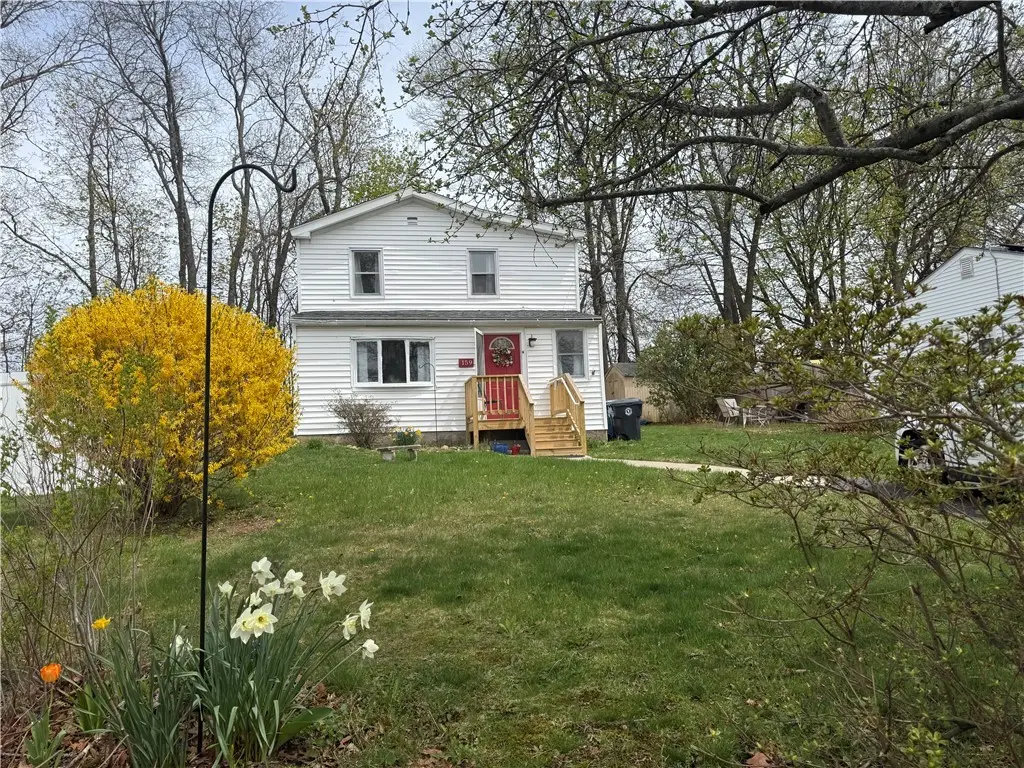
159 Iroquois Rd · Valley Falls, RI
Flood risk 1/10 · Minimal
- FEMA flood zone
- X (unshaded)
- Chance of flooding over 30 yrs
- 0.0%
- Est. flood insurance / yr
- $507 – $1,088
Fire risk 2/10 · Minimal
- Est. fire insurance / yr
- $835 – $1,551
Heat risk 5/10 · Moderate
- Hot days now (above 96°F)
- 7 days/yr
- Hot days in 30 yrs
- 15 days/yr
Wind risk 6/10 · Moderate
- Chance of severe wind over 30 yrs
- 67.0%
Air-quality risk 2/10 · Minimal
- Unhealthy air days now
- 1 days/yr
- Unhealthy air days in 30 yrs
- 2 days/yr
Risk factors via First Street. Map © Google.
Why this score? — see what drove the D grade
The composite is a weighted blend of 9 inputs, each scored 0–100. Each bar is that input's sub-score; the figure is the points it added to the 100-point composite (weight × sub-score).
- ARV discount +15.0/15.0
- Cash flow +9.3/30.0
- Schools +4.2/10.0
- Livability +3.8/5.0
- DSCR +2.6/10.0
- Condition / age +2.5/5.0
- 1% rule +2.3/10.0
- Rent growth +2.1/5.0
- Appreciation +0.0/10.0
$289,900
🖨 Deal sheet (PDF) 📄 Offer letter ✓ Due diligence
Listing remarks
Welcome to this 3 bed 1.5 bath diamond in the rough. This home needs very little to make it perfect. Located in desirable Monastery Heights situated on a nice flat lot on a quiet street. Tons of potential, close to all amenities and highways. Great opportunity at an affordable price.
Key facts
- 4,792 sq ft lot
- 2 parking spots
- Built 1920
Property features AI
Finance
- HOA & community: Community amenities nearby include golf, highway access, hospital, schools, public transportation, restaurants, shopping, and tennis courts
Exterior
- Parking: No garage; Space for 2 vehicles
- Utilities: 100 amp electric service; Connected water; Cesspool sewer
- Home design: 2-story home; Vinyl siding
- Construction: Built on concrete perimeter foundation
- Exterior features: Lot approximately 0.11 acres
Interior
- Flooring: Carpet; Laminate
- Bathrooms: 1 full bathroom; 1 half bathroom
- Heating & cooling: Hot water baseboard heating (gas)
- Interior features: Crawl space basement; Carpet and laminate flooring
- Laundry & utility: Electric water heater; Water heater
Neighborhood map
What this means for you Summary
Snapshot
- This is a 2-bed/1.0-bath single-family listed at $290k.
Deal economics
- At list price, monthly cash flow is $-213 ($-3k/yr) — negative.
- To cash-flow at today's rent, offer at most $252k (13.0% below list).
- To meet the 1% rule (rent ≥ 1% of price), the offer needs to be $212k (26.7% below list).
- Recommended offer: $212k (26.7% below list) — sets the bar for 1% rule.
- Cap rate 5.4% vs local median 3.3% in Valley Falls — top-decile yield for the area; either an underpriced asset or a hidden risk that comps aren't pricing in. Stress-test before assuming the spread holds.
Location & tenants
- Location reads 75/100 on livability (#8 in RI, #4,293 nationally) — a middle-class / working-renter tenant base. Strengths: crime A+, employment A+, housing A+; Watch: amenities F, commute F.
- Cumberland (suburban): math 40% / reading 52% proficiency, ranked #9 of 39 in RI (top 23%) — families likely to look elsewhere, expect single-tenant / working-renter base with shorter leases; only 18% free/reduced lunch — higher-income household profile.
- Zoned schools: Garvin Memorial (math 32% / reading 47%, grade F, #46 of 167 statewide, top 30%, 410 students, 20% FRL); Joseph L. Mccourt Ms (math 25% / reading 30%, grade F, #25 of 57 statewide, top 43%, 436 students, 37% FRL); Cumberland High School (math 35% / reading 58%, grade D-, #15 of 58 statewide, top 26%, 1,446 students, 17% FRL).
- Market conditions: Rents soft (-1.5%/yr); 148 active listings in the ZIP; 4 comparable units currently listed for rent nearby; rentals at typical pace (median 18d on market — plan ~3-4 weeks tenant-placement turnaround); high-income renter base; 776 units permitted in Providence County in 2024 (229 in 5+ unit buildings).
Forward outlook
- Local home prices are declining (-3.0%/yr); year-one equity from $2k of loan paydown is wiped out by about $9k of value loss. Plan a longer hold.
- Providence County population projected at +5% by 2050 — modest demand growth; plan on rents tracking national, not racing it.
Negotiation context
- It's been on market 15 days — a 2% lower offer ($286k) is reasonable based on typical stale-listing flexibility.
- 6 sale attempts since 31y ago with the ask held roughly flat each time — persistent listings suggest the price (not the market) is what's stuck; bring a comps-based counter.
- Current owner paid $70k; list at $290k implies a 314% gain — meaningful room to come down on a strong offer.
Risks & watch-outs
- Watch-outs: built in 1920 — expect roof / HVAC / electrical / plumbing capex.
- Climate carrying-cost: major wind risk, 67% chance of damaging wind over 30y; extreme-heat days projected 7→15/yr by 2055 (HVAC capex compounding) — expect insurance premiums to compound above CPI over the hold.
Questions for the listing agent
- What do current leases actually rent for vs. the listed asking? Can we see a recent rent roll and the last 12 months of T-12 income?
- Built in 1920 — when were the roof, HVAC, electrical panel, plumbing, and water heater last replaced?
- Is there a deadline driving the sale (1031 exchange, divorce, estate, relocation)? That informs how much negotiation room exists.
- Schools are D-rated, which usually means shorter tenancies and higher turnover. Who's the typical renter profile here, and what's been the actual vacancy rate?
- The area grade is low — what's the realistic commute time and amenity access for the typical tenant pool here? Any planned neighborhood developments (good or bad) we should know about?
- What's the average days-on-market for RENTAL listings here right now (not sales)? A rising rental-DOM trend means longer vacancies and softer asking-rent achievability than the comps imply.
- What's the recent tenant-quality profile in this submarket — average credit score on applications, eviction rate, late-payment / NSF rate, and stable-employment percentage? A property-management company in the area should have these aggregated.
- How much new for-sale + rental construction is in the pipeline within 1–3 miles? Heavy new supply typically softens prices + rents 12–24 months out; constrained supply supports both.
Investment metrics
- 1% rule
- 0.73% ✗
- Cap rate
- 5.41%
- Cash-on-cash
- -3.16%
- DSCR
- 0.86
- GRM
- 11.4
CMA / ARV
- ARV (on-the-fly)
- $475,254
- Comps found
- 8
Show comp detail 8 sales within ~0.75 mi
| Address | Dist | Beds/Ba | Sqft | Sold | Price | $/sf | Match |
|---|---|---|---|---|---|---|---|
| 66 Pequot Ave | 0.15mi | 2/1.0 | 1,288 (-5%) | 6mo | $420,000 | $326 | 80 |
| 7 Seneca St | 0.32mi | 3/1.0 (+1) | 1,376 (+2%) | 16mo | $425,000 | $309 | 64 |
| 144 Hines Rd | 0.41mi | 3/1.5 (+1) | 1,467 (+8%) | 9mo | $487,500 | $332 | 53 |
| 10 Delaware Ave | 0.45mi | 3/1.0 (+1) | 1,490 (+10%) | 15mo | $465,900 | $313 | 45 |
| 77 Melrose St | 0.38mi | 3/1.5 (+1) | 1,196 (-12%) | 14mo | $425,000 | $355 | 44 |
| 31 Chestnut St | 0.60mi | 2/1.0 | 1,218 (-10%) | 13mo | $445,000 | $365 | 44 |
| 66 Rabbitt Hill Rd | 0.71mi | 3/1.5 (+1) | 1,340 (-1%) | 17mo | $470,000 | $351 | 44 |
| 87 Hilltop Rd | 0.73mi | 3/1.0 (+1) | 1,260 (-7%) | 20mo | $560,000 | $444 | 33 |
Match score weights: distance 35% · size 25% · config 20% · recency 20%. Top-matched comps best support the ARV.
Projected returns pro-forma
-3.0% appreciation · 0.0% rent growth · sell at horizon
- IRR
- -24.8%
- Equity multiple
- 0.18×
- Total profit
- $-66,833
- Equity at exit
- $43,225
- IRR
- -31.9%
- Equity multiple
- -0.23×
- Total profit
- $-99,905
- Equity at exit
- $25,065
Cash invested: $81,172 (down + closing). Projections, not guarantees.
Landlord ↔ Tenant lean methodology
- Overall (STATE)
- 31 Tenant-Leaning
- State Rhode Island
- 31 Tenant-Leaning · D+8
- County
- — inherits STATE
- City
- — inherits STATE
ZIP-level market 02864
- Rents YoY
- -1.5%
- Active inventory
- 148
- Price-to-rent
- 11.4×
Monthly cashflow live
- Estimated rent
- $2,124 medium interval (Pro) →
- Mortgage (P&I)
- −$1,520
- Tax from tax record
- −$250 /mo · $3,000/yr
- Insurance
- −$121
- HOA
- −$0
- Vacancy / Maint / Mgmt
- −$446
- Net cashflow
- $-213
Break-even live
Sensitivity live
| Price | -10% $-49 | -5% $-131 | +0% $-213 | +5% $-296 | +10% $-378 |
|---|---|---|---|---|---|
| Rent | -10% $-381 | -5% $-297 | +0% $-213 | +5% $-130 | +10% $-46 |
| Rate | -1.0pp $-67 | -0.5pp $-140 | base $-213 | +0.5pp $-289 | +1.0pp $-365 |
UW: 25.0% down · 7.5% · 30yr · 1.5% tax · 5.0% vac · 8.0% maint · 8.0% mgmt
Financing live
Cash to close
- Down payment
- $72,475
- Closing costs
- $8,697
- Reserves months
- —
- Total cash needed
- —
Loan-product check · same deal, 3 products live
Conventional
25% down · 7.5% · 30yr
- Down + closing
- —
- Monthly P&I
- —
- Monthly cashflow
- —
- DSCR
- —
- Eligible?
- —
Personal DTI + credit; lowest rate.
DSCR
20% down · 8.5% · 30yr
- Down + closing
- —
- Monthly P&I
- —
- Monthly cashflow
- —
- DSCR
- —
- Eligible?
- —
No personal income docs; deal must DSCR.
Hard money
10% down · 12.0% · 12mo
- Down + closing
- —
- Monthly P&I
- —
- Monthly cashflow
- —
- DSCR
- —
- Eligible?
- —
Short-term bridge; refi at stabilization.
Rent comps 4 comps
| Address | Beds | Baths | Sqft | Rent | $/sqft | DOM | Units | Dist |
|---|---|---|---|---|---|---|---|---|
| 50 Abbott Run Valley Rd #1604 Cumberland, RI | 2.0 | 1.5 | 1785 | $2,800 | $1.57 | 17d | 1 | 1.31mi |
| 40 E Barrows St Unit 3 Cumberland, RI | 2.0 | 1.0 | 1150 | $1,750 | $1.52 | 13d | 1 | 1.40mi |
| 40 E Barrows St Unit 2 Cumberland, RI | 2.0 | 1.0 | 1150 | $1,950 | $1.70 | 16d | 1 | 1.40mi |
| 495 Broad St Unit 2 Cumberland, RI | 3.0 | 1.0 | 1000 | $1,850 | $1.85 | 45d | 1 | 1.43mi |
Listing history 17 events
-
2026-06-02statusdays on market $289,900 Pending 15 DOM
-
2026-06-01days on market $289,900 Active 14 DOM
-
2026-05-31days on market $289,900 Active 13 DOM
-
2026-04-29$289,900 Active
-
2026-04-29historical
-
2026-04-01$289,900
-
2017-07-21status Pending
-
2017-07-20historical
-
2017-07-12price $149,000
-
2017-07-12status Active
-
2017-06-05status Pending
-
2017-05-19$159,000 Active
-
2016-11-08price $239,000
-
2006-12-30historical
-
2006-06-05$249,000
-
1995-12-15soldstatus $70,000
-
1995-08-07$78,900
ⓘ Source: listings_history table (triggers on properties + properties_extension) + one-shot
backfill from property_details.listing_events for pre-trigger history.
Tax reassessment forecast RI · Partial reset (capped growth)
- Current annual tax
- $3,000 · $250/mo
- Projected year-2 tax
- $3,863 · $322/mo
- Expected delta
- +$863/yr (+$72/mo · 28.8%)
ⓘ Screening estimate from a state-policy table — verify with the county assessor before closing.
Climate risk First Street
- Flood 1/10 Low FEMA zone X (unshaded) · 0% chance over 30 yrs
- Wildfire 2/10 Low
- Heat 5/10 Major 7 d/yr ≥96°F today · 15 d/yr by 30 yrs out
- Wind 6/10 Major 67% chance of damaging wind over 30 yrs
- Air quality 2/10 Low 1 unhealthy d/yr today · 2 by 30 yrs out
Nearby sold comps map
Loading sold comps map…
Walkable amenities ~0.75 mi
Loading nearby amenities…
Taxation est. · year 1
- Rental income
- $25,482
- − Mortgage interest
- −$16,239
- − Property taxes
- −$3,000
- − Insurance
- −$1,450
- − Repairs & maintenance
- −$2,039
- − Management
- −$2,039
- − Depreciation
- −$8,433
- Taxable loss
- −$7,717
- Est. tax savings @ 24.0%
- +$1,852
- After-tax cash flow
- $-710/yr
For passive investors: Depreciation is non-cash, so a rental often shows a tax loss while cash-flowing — sheltering income. Rental losses are passive: they offset passive income freely, and up to $25,000/yr can offset ordinary (W-2) income if you actively participate and your MAGI is under $100k (phasing out to $0 by $150k); unused losses carry forward. On sale, claimed depreciation is recaptured at up to 25%, and gains may owe capital-gains tax (a 1031 exchange can defer both). Figures are a year-1 estimate at your 24.0% rate — not tax advice; consult a CPA.
Schools (NCES district)
- District
- Cumberland
- NCES district ID
- 4400270
- Math proficiency
- 40% ▼ -13.00%
- Reading proficiency
- 52% ▼ -10.00%
- Median HH income
- $75,407
- Composite
- 41.85/100
- National rank
- #3382
- State rank
- #9 of 39 in RI
Livability — Valley Falls
- Score
- 75/100
- State rank
- #8
- US rank
- #4293
Category grades
Schools grade is shown separately in the Schools card above.
Census & demographics
- Census place
- Valley Falls, RI
- County
- Providence County · 548,917 people
- Metro
- Providence-Warwick, RI-MA
- Population (ZIP)
- 36,820
- Household income
- $117,522
- Rent vs Own
- Severe rent burden
- 771.0
Population outlook (Providence County) Hauer SSP2
- Today (2025)
- 653,469 people
- By 2030
- 660,819 · +1.1%
- By 2040
- 672,747 · +3.0%
- By 2050
- 683,741 · +4.6%
- By 2075
- 720,435 · +10.2%
- By 2100
- 741,582 · +13.5%
Race, ethnicity, and origin ACS 2023
- Neighborhood character
- Predominantly White (83%)
- Race & ethnicity
- White 83% Hispanic / Latino 6% Two or more races 5% Asian 4% Black 3%
- Hispanic origin (detail)
- Puerto Rican 2%
- Common ancestry
- Lithuanian 11% Russian 10% Romanian 6%
- Foreign-born
- 11% · Canada, Jamaica, China
- Languages at home
- 83% English-only · Other Indo-European 7% Spanish 4% French/Haitian/Cajun 2%
Political lean MEDSL · Providence
- 2024 margin
- D (+14.4) · D 56.1% · R 41.7% · Other 2.2%
- 2008→2024 swing
- -20.0pp toward R · 2008: 34.4pp · 2024: 14.4pp
- All cycles
- 2024: D+14.4 2020: D+22.9 2016: D+21.2 2012: D+34.9 2008: D+34.4
Not yet ingested
- Civics
- —
Market trends
- HPI YoY
- ▼ -461.15%
- Current HPI
- 313.0341
- Rent YoY
- ▼ -1.48%
- Metro
- Providence-Warwick, RI-MA
- State GDP YoY
- ▲ 2.25%
- F500 in state
- 10
Industry mix (Fortune 500 HQ in RI)
| Industry | F500 HQs | Revenue |
|---|---|---|
| Healthcare | 1 | $373B |
|
||
| Food Distribution | 1 | $31B |
|
||
| Aerospace / Defense | 1 | $14B |
|
||
| Financial Services | 1 | $8B |
|
||
| Consumer Goods | 1 | $4B |
|
||
Price history
+267.4% since first listed14 events — show timeline
- 2026-04-29 Listing Removed — RIS
- 2026-04-29 Listed $289,900 RIS
- 2026-04-01 Listed $289,900 RIS
- 2017-07-21 Pending — RIS
- 2017-07-20 Listing Removed — RIS
- 2017-07-12 Price Changed $149,000 RIS
- 2017-07-12 Relisted — RIS
- 2017-06-05 Pending — RIS
- 2017-05-19 Listed $159,000 RIS
- 2016-11-08 Price Changed $239,000 RIS
- 2006-12-30 Listing Removed — RIS
- 2006-06-05 Listed $249,000 RIS
- 1995-12-15 Sold (MLS) $70,000 RIS
- 1995-08-07 Listed $78,900 RIS
Property tax history
+1.5%/yrLatest (2025): $3,000 · +2.7% YoY. Source: county tax records.
Cash-flow waterfall
monthlySold comps — $/sqft
last 12 mo · ≤1 miLoading sold comps…