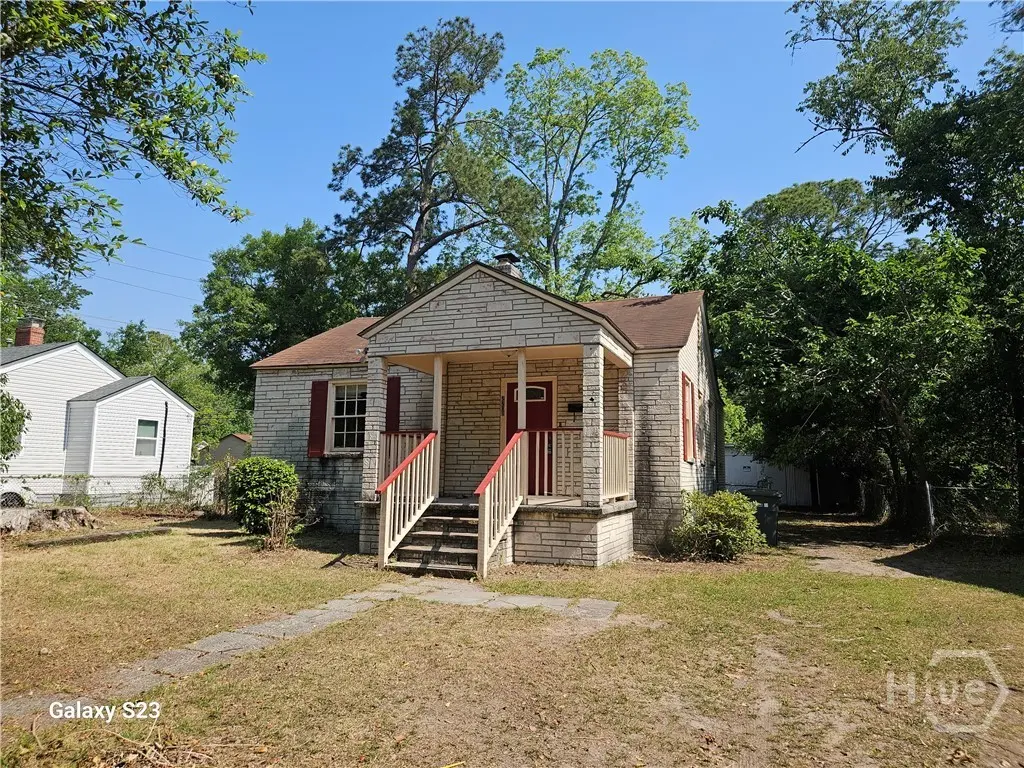
2208 Utah St · Savannah, GA
Flood risk 1/10 · Minimal
- FEMA flood zone
- X (unshaded)
- Chance of flooding over 30 yrs
- 0.0%
- Est. flood insurance / yr
- $507 – $1,088
Fire risk 3/10 · Minor
- Est. fire insurance / yr
- $963 – $1,789
Heat risk 10/10 · Severe
- Hot days now (above 107°F)
- 7 days/yr
- Hot days in 30 yrs
- 18 days/yr
Wind risk 9/10 · Severe
- Chance of severe wind over 30 yrs
- 99.0%
Air-quality risk 5/10 · Moderate
- Unhealthy air days now
- 7 days/yr
- Unhealthy air days in 30 yrs
- 8 days/yr
Risk factors via First Street. Map © Google.
Why this score? — see what drove the B+ grade
The composite is a weighted blend of 9 inputs, each scored 0–100. Each bar is that input's sub-score; the figure is the points it added to the 100-point composite (weight × sub-score).
- Cash flow +30.0/30.0
- ARV discount +15.0/15.0
- DSCR +10.0/10.0
- 1% rule +9.8/10.0
- Livability +4.3/5.0
- Rent growth +3.4/5.0
- Condition / age +2.5/5.0
- Schools +2.0/10.0
- Appreciation +0.0/10.0
$127,900
🖨 Deal sheet 📄 Offer letter ✓ Due diligence
Listing remarks
Investor special, as is condition. Foundation in need of repair, termite damage. Great potential. Part of the kitchen floor has been removed. Please use caution. Appliances not included will be removed Monday. Cash sale only.
Key facts
- 8,102 sq ft lot
- Built 1943
- Listed 30 days
Property features AI
Exterior
- Utilities: Public water; Public sewer
- Home design: Single-family residence; Single story
- Construction: Built with other construction materials
- Exterior features: Has a view; Storage structure; Workshop
Interior
- Bathrooms: 1 full bathroom
- Heating & cooling: Central electric heating; Central electric cooling
- Interior features: Electric water heater; Has central electric heating and cooling; Central Air conditioning
- Laundry & utility: Laundry area (other)
Neighborhood map
What this means for you Summary
Snapshot
- This is a 3-bed/1.0-bath single-family listed at $128k.
Deal economics
- At list price, monthly cash flow is $740 ($9k/yr) — positive.
- The deal already cash-flows at list — no discount required.
- Meets the 1% rule at list price ($2k rent vs $128k).
- Recommended offer: $126k (1.5% below list) — sets the bar for market timing.
- Cap rate 13.2% vs local median 4.0% in Savannah — top-decile yield for the area; either an underpriced asset or a hidden risk that comps aren't pricing in. Stress-test before assuming the spread holds.
Location & tenants
- Location reads 86/100 on livability (#1 in GA, #397 nationally) — a professional / high-income tenant draw. Strengths: crime A+, amenities A+, commute A+; Watch: employment D, schools F.
- Savannah-Chatham County (urban): math 20% / reading 26% proficiency, ranked #134 of 174 in GA (top 77%) — low school quality limits family demand, transient renter base, plan for 1-2y turnover.
- Market conditions: Rents rising (+3.6%/yr); 226 active listings in the ZIP; 26 comparable units currently listed for rent nearby; rentals lingering (median 44d on market — plan ~5-8 weeks vacancy on turnover, expect pricing pressure); 62% of comp listings sitting > 30 days — soft ceiling on asking rent; 2,694 units permitted in Chatham County in 2024 (973 in 5+ unit buildings).
- This rent runs 42% of the median local income ($53k/yr) — at the standard rent-burdened threshold; future hikes will face affordability resistance.
Forward outlook
- Local home prices are declining (-3.0%/yr); year-one equity from $884 of loan paydown is wiped out by about $4k of value loss. Plan a longer hold.
- Chatham County population projected at +33% by 2050 — long-run rental-demand tailwind backs the buy-and-hold thesis.
- At projected returns (-3.0% appreciation + 3.6% rent growth), your $36k cash investment doubles in ~5 years — after that, you're playing with house money.
Negotiation context
- It's been on market 30 days — a 2% lower offer ($126k) is reasonable based on typical stale-listing flexibility.
Risks & watch-outs
- Watch-outs: built in 1943 — expect roof / HVAC / electrical / plumbing capex.
- Climate carrying-cost: severe wind risk, 99% chance of damaging wind over 30y; extreme-heat days projected 7→18/yr by 2055 (HVAC capex compounding) — expect insurance premiums to compound above CPI over the hold.
Questions for the listing agent
- Built in 1943 — when were the roof, HVAC, electrical panel, plumbing, and water heater last replaced?
- Is there a deadline driving the sale (1031 exchange, divorce, estate, relocation)? That informs how much negotiation room exists.
- Schools are F-rated, which usually means shorter tenancies and higher turnover. Who's the typical renter profile here, and what's been the actual vacancy rate?
- What's the average days-on-market for RENTAL listings here right now (not sales)? A rising rental-DOM trend means longer vacancies and softer asking-rent achievability than the comps imply.
- What's the recent tenant-quality profile in this submarket — average credit score on applications, eviction rate, late-payment / NSF rate, and stable-employment percentage? A property-management company in the area should have these aggregated.
- How much new for-sale + rental construction is in the pipeline within 1–3 miles? Heavy new supply typically softens prices + rents 12–24 months out; constrained supply supports both.
Investment metrics
- 1% rule
- 1.48% ✓
- Cap rate
- 13.24%
- Cash-on-cash
- 24.81%
- DSCR
- 2.10
- GRM
- 5.6
CMA / ARV
- ARV (median comp)
- $239,630
- List price
- $127,900
- Delta
- -46.63%
- Verdict
- UNDERPRICED
- Comps
- 20 within 1.0 mi
Show comp detail 12 sales within ~0.75 mi
| Address | Dist | Beds/Ba | Sqft | Sold | Price | $/sf | Match |
|---|---|---|---|---|---|---|---|
| 2208 Utah St | 0.00mi | 3/1.0 | 1,073 (0%) | 1mo | $119,000 | $111 | 100 |
| 202 Forrest Ave | 0.50mi | 3/1.0 | 1,085 (+1%) | 5mo | $260,000 | $240 | 71 |
| 2217 Beech St | 0.21mi | 2/1.0 (-1) | 959 (-11%) | 3mo | $165,000 | $172 | 65 |
| 328 Riverview Dr | 0.55mi | 3/1.0 | 1,021 (-5%) | 3mo | $219,900 | $215 | 64 |
| 2130 Hanson St | 0.56mi | 3/1.0 | 1,140 (+6%) | 1mo | $253,000 | $222 | 63 |
| 2230 Iowa St | 0.34mi | 3/1.0 | 944 (-12%) | 5mo | $235,000 | $249 | 60 |
| 2106 Auburn St | 0.41mi | 3/1.0 | 1,216 (+13%) | 4mo | $155,000 | $127 | 56 |
| 2231 E Gwinnett St | 0.65mi | 3/2.0 | 996 (-7%) | 3mo | $238,256 | $239 | 52 |
| 2232 E Gwinnett St | 0.62mi | 3/2.0 | 1,212 (+13%) | 2mo | $262,000 | $216 | 44 |
| 329 Manor Dr | 0.57mi | 3/1.0 | 912 (-15%) | 6mo | $172,000 | $189 | 44 |
| 2238 Alaska St | 0.73mi | 2/1.0 (-1) | 1,185 (+10%) | 1mo | $145,000 | $122 | 43 |
| 2018 Bolling St | 0.72mi | 2/1.0 (-1) | 914 (-15%) | 6mo | $120,000 | $131 | 32 |
Match score weights: distance 35% · size 25% · config 20% · recency 20%. Top-matched comps best support the ARV.
Projected returns pro-forma
-3.0% appreciation · 3.62% rent growth · sell at horizon
- IRR
- 18.8%
- Equity multiple
- 1.77×
- Total profit
- $27,566
- Equity at exit
- $19,070
- IRR
- 27.6%
- Equity multiple
- 3.50×
- Total profit
- $89,437
- Equity at exit
- $11,058
Cash invested: $35,812 (down + closing). Projections, not guarantees.
Landlord ↔ Tenant lean methodology
- Overall (STATE)
- 90 Strongly Landlord-Friendly
- State Georgia
- 90 Strongly Landlord-Friendly · R+3
- County
- — inherits STATE
- City
- — inherits STATE
ZIP-level market 31404
- Rents YoY
- 3.6%
- Active inventory
- 226
- Price-to-rent
- 5.6×
Monthly cashflow live
- Estimated rent
- $1,888 high interval (Pro) →
- Mortgage (P&I)
- −$671
- Tax from tax record
- −$27 /mo · $321/yr
- Insurance
- −$53
- HOA
- −$0
- Vacancy / Maint / Mgmt
- −$396
- Net cashflow
- $740
Break-even live
UW: 25.0% down · 7.5% · 30yr · 1.5% tax · 5.0% vac · 8.0% maint · 8.0% mgmt
Financing live
Cash to close
- Down payment
- $31,975
- Closing costs
- $3,837
- Reserves months
- —
- Total cash needed
- —
Loan-product check · same deal, 3 products live
Conventional
25% down · 7.5% · 30yr
- Down + closing
- —
- Monthly P&I
- —
- Monthly cashflow
- —
- DSCR
- —
- Eligible?
- —
Personal DTI + credit; lowest rate.
DSCR
20% down · 8.5% · 30yr
- Down + closing
- —
- Monthly P&I
- —
- Monthly cashflow
- —
- DSCR
- —
- Eligible?
- —
No personal income docs; deal must DSCR.
Hard money
10% down · 12.0% · 12mo
- Down + closing
- —
- Monthly P&I
- —
- Monthly cashflow
- —
- DSCR
- —
- Eligible?
- —
Short-term bridge; refi at stabilization.
Rent comps 26 comps
| Address | Beds | Baths | Sqft | Rent | $/sqft | DOM | Units | Dist |
|---|---|---|---|---|---|---|---|---|
| 2211 Beech St Savannah, GA | 2.0 | 1.0 | 800 | $1,595 | $1.99 | 44d | 1 | 0.23mi |
| 2217 Beech St Savannah, GA | 2.0 | 1.0 | 959 | $1,850 | $1.93 | 23d | 1 | 0.24mi |
| 2800 Capital St Savannah, GA | 1.0–3.0 | 1.0 | 980 | $1,650 | $1.68 | 44d | 1 | 0.27mi |
| 2010 E President St Savannah, GA | 2.0 | 1.0–2.0 | 944 | $1,950 | $2.07 | 14d | 27 | 0.37mi |
| 2102 Auburn St Savannah, GA | 3.0 | 1.0 | 828 | $1,795 | $2.17 | 44d | 1 | 0.39mi |
| 101 Forrest Ave Savannah, GA | 3.0 | 1.0 | 1367 | $1,895 | $1.39 | 44d | 1 | 0.44mi |
| 2137 Bolling St Savannah, GA | 3.0 | 1.0 | 1204 | $1,575 | $1.31 | 23d | 1 | 0.68mi |
| 2201 Mississippi Ave Savannah, GA | 2.0 | 1.0 | 1005 | $1,595 | $1.59 | 44d | 1 | 0.80mi |
| 1110 New Jersey Ave Savannah, GA | 2.0 | 1.0 | 714 | $1,500 | $2.10 | 44d | 1 | 0.83mi |
| 2503 Mississippi Ave Savannah, GA | 3.0 | 1.5 | 1373 | $1,800 | $1.31 | 44d | 1 | 0.83mi |
| 2141 New York Ave Unit A Savannah, GA | 2.0 | 1.0 | 765 | $1,750 | $2.29 | 44d | 1 | 0.95mi |
| 1612 Skidaway Rd Savannah, GA | 2.0 | 1.0 | 1453 | $1,800 | $1.24 | 44d | 1 | 0.97mi |
| 1655 McKinnon Dr Savannah, GA | 4.0 | 2.0 | 1292 | $1,795 | $1.39 | 23d | 1 | 1.05mi |
| 1810 E 32nd St Savannah, GA | 3.0 | 1.5 | 1218 | $3,000 | $2.46 | 23d | 1 | 1.11mi |
| 37 Altman Cir Savannah, GA | 2.0 | 2.0 | 879 | $1,750 | $1.99 | 44d | 1 | 1.16mi |
| 1518 E Park Ave Savannah, GA | 2.0–3.0 | 1.0–2.5 | 1261 | $1,703 | $1.35 | 14d | 6 | 1.19mi |
| 16 Helmken St Savannah, GA | 3.0 | 1.0 | 924 | $1,850 | $2.00 | 14d | 1 | 1.19mi |
| 2149 Vermont Ave Savannah, GA | 3.0 | 2.0 | 1213 | $1,955 | $1.61 | 44d | 1 | 1.19mi |
| 2010 Vermont Ave Savannah, GA | 2.0 | 1.0 | 892 | $1,690 | $1.89 | 44d | 1 | 1.20mi |
| 1704 E 31st St Savannah, GA | 3.0 | 2.0 | 1137 | $2,350 | $2.07 | 44d | 1 | 1.22mi |
| 2201 E 37th St Savannah, GA | 3.0 | 1.5 | 1424 | $1,800 | $1.26 | 23d | 1 | 1.36mi |
| 1502 E 31st St Savannah, GA | 3.0 | 2.0 | 1212 | $1,700 | $1.40 | 14d | 1 | 1.38mi |
| 1403 E Anderson St Savannah, GA | 3.0 | 2.0 | 1300 | $2,400 | $1.85 | 44d | 1 | 1.44mi |
| 1203 E Bolton St Savannah, GA | 2.0 | 2.5 | 1200 | $2,000 | $1.67 | 23d | 1 | 1.45mi |
| 375 Laurel Oak Ln Thunderbolt, GA | 3.0 | 2.5 | 1200 | $1,800 | $1.50 | 44d | 1 | 1.47mi |
| 1315 E Anderson St Unit 1315 Savannah, GA | 2.0 | 2.0 | 859 | $1,500 | $1.75 | 44d | 1 | 1.49mi |
Listing history 4 events
-
2026-05-15price $127,900 225-char remark
-
2026-05-11price $132,900 225-char remark
-
2026-04-24$139,900 Active 225-char remark
-
2002-09-27soldstatus $42,800
ⓘ Source: listings_history table (triggers on properties + properties_extension) + one-shot
backfill from property_details.listing_events for pre-trigger history.
Tax reassessment forecast GA · Resets to sale price
- Current annual tax
- $321 · $27/mo
- Projected year-2 tax
- $1,177 · $98/mo
- Expected delta
- +$856/yr (+$71/mo · 267.0%)
ⓘ Screening estimate from a state-policy table — verify with the county assessor before closing.
Climate risk First Street
- Flood 1/10 Low FEMA zone X (unshaded) · 0% chance over 30 yrs
- Wildfire 3/10 Moderate
- Heat 10/10 Extreme 7 d/yr ≥107°F today · 18 d/yr by 30 yrs out
- Wind 9/10 Extreme 99% chance of damaging wind over 30 yrs
- Air quality 5/10 Major 7 unhealthy d/yr today · 8 by 30 yrs out
Nearby sold comps map
Loading sold comps map…
Walkable amenities ~0.75 mi
Loading nearby amenities…
Taxation est. · year 1
- Rental income
- $22,651
- − Mortgage interest
- −$7,164
- − Property taxes
- −$321
- − Insurance
- −$640
- − Repairs & maintenance
- −$1,812
- − Management
- −$1,812
- − Depreciation
- −$3,721
- Taxable income
- $7,182
- Est. tax owed @ 24.0%
- −$1,724
- After-tax cash flow
- $7,162/yr
For passive investors: Depreciation is non-cash, so a rental often shows a tax loss while cash-flowing — sheltering income. Rental losses are passive: they offset passive income freely, and up to $25,000/yr can offset ordinary (W-2) income if you actively participate and your MAGI is under $100k (phasing out to $0 by $150k); unused losses carry forward. On sale, claimed depreciation is recaptured at up to 25%, and gains may owe capital-gains tax (a 1031 exchange can defer both). Figures are a year-1 estimate at your 24.0% rate — not tax advice; consult a CPA.
Schools (NCES district)
- District
- Savannah-Chatham County
- NCES district ID
- 1301020
- Math proficiency
- 20% ▼ -11.00%
- Reading proficiency
- 26% ▼ -5.00%
- Median HH income
- $47,443
- Composite
- 20.14/100
- National rank
- #8639
- State rank
- #134 of 174 in GA
Livability — Savannah
- Score
- 86/100
- State rank
- #1
- US rank
- #397
Category grades
Schools grade is shown separately in the Schools card above.
Census & demographics
- Census place
- Savannah, GA
- County
- Chatham County · 271,602 people
- City population
- 216,564
- Metro
- Savannah, GA
- Population (ZIP)
- 30,062
- Household income
- $53,303
- Rent vs Own
- Severe rent burden
- 1649.0
Population outlook (Chatham County) Hauer SSP2
- Today (2025)
- 332,584 people
- By 2030
- 355,508 · +6.9%
- By 2040
- 400,030 · +20.3%
- By 2050
- 443,019 · +33.2%
- By 2075
- 534,579 · +60.7%
- By 2100
- 583,863 · +75.6%
Race, ethnicity, and origin ACS 2023
- Neighborhood character
- Majority Black (60%)
- Race & ethnicity
- Black 60% White 33% Two or more races 4% Hispanic / Latino 3% Asian 1%
- Common ancestry
- Romanian 2% Lithuanian 1% Slovak 1%
- Foreign-born
- 4% · Canada, Vietnam
- Languages at home
- 93% English-only · Spanish 3% Other Asian/Pacific 1% French/Haitian/Cajun 1%
Political lean MEDSL · Chatham
- 2024 margin
- D (+18.0) · D 58.6% · R 40.6%
- 2008→2024 swing
- +3.6pp toward D · 2008: 14.4pp · 2024: 18.0pp
- All cycles
- 2024: D+18.0 2020: D+18.8 2016: D+14.5 2012: D+12.0 2008: D+14.4
Not yet ingested
- Civics
- —
Market trends
- HPI YoY
- ▼ -187.86%
- Current HPI
- 310.0764
- Rent YoY
- ▲ 3.62%
- Metro
- Savannah, GA
- State GDP YoY
- ▲ 2.66%
- F500 in state
- 28
Industry mix (Fortune 500 HQ in GA)
| Industry | F500 HQs | Revenue |
|---|---|---|
| Paper / Packaging | 2 | $29B |
|
||
| Retail | 1 | $160B |
|
||
| Transportation / Logistics | 1 | $91B |
|
||
| Airlines | 1 | $62B |
|
||
| Consumer Goods | 1 | $47B |
|
||
| Utilities | 1 | $25B |
|
||
Price history
+178.0% since first listed6 events — show timeline
- 2026-06-03 Sold (MLS) $119,000 Hive MLS
- 2026-05-24 Pending — Hive MLS
- 2026-05-15 Price Changed $127,900 Hive MLS
- 2026-05-11 Price Changed $132,900 Hive MLS
- 2026-04-24 Listed $139,900 Hive MLS
- 2002-09-27 Sold (Public Records) $42,800 Public Records
Property tax history
-0.1%/yrLatest (2025): $321 · -1.3% YoY. Source: county tax records.
Cash-flow waterfall
monthlySold comps — $/sqft
last 12 mo · ≤1 miLoading sold comps…