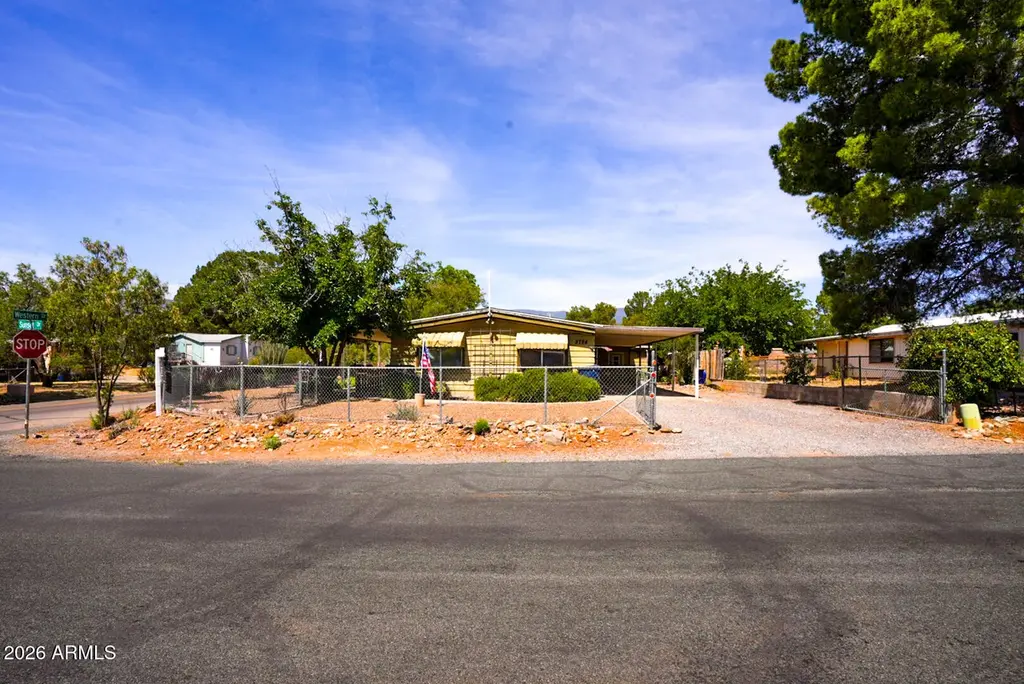
2724 S Sunset Dr · Verde Village, AZ
Flood risk 1/10 · Minimal
- FEMA flood zone
- X (unshaded)
- Chance of flooding over 30 yrs
- 0.0%
- Est. flood insurance / yr
- $507 – $1,088
Fire risk 5/10 · Moderate
- Est. fire insurance / yr
- $610 – $1,132
Heat risk 6/10 · Moderate
- Hot days now (above 102°F)
- 5 days/yr
- Hot days in 30 yrs
- 11 days/yr
Wind risk 1/10 · Minimal
- Chance of severe wind over 30 yrs
- —
Air-quality risk 1/10 · Minimal
- Unhealthy air days now
- 0 days/yr
- Unhealthy air days in 30 yrs
- 0 days/yr
Risk factors via First Street. Map © Google.
Why this score? — see what drove the D+ grade
The composite is a weighted blend of 9 inputs, each scored 0–100. Each bar is that input's sub-score; the figure is the points it added to the 100-point composite (weight × sub-score).
- Cash flow +16.3/30.0
- ARV discount +14.8/15.0
- DSCR +5.0/10.0
- Livability +3.3/5.0
- 1% rule +3.1/10.0
- Condition / age +2.5/5.0
- Rent growth +2.4/5.0
- Schools +1.9/10.0
- Appreciation +0.0/10.0
$244,900
🖨 Deal sheet (PDF) 📄 Offer letter ✓ Due diligence
Listing remarks MLS
Cb#9840-neat As A Pin. Built In China Hutch, Pantry, Lg M/Closet Garden Tub In Mb, New Washer/Dryer, Appliances Included. Fruit Trees, Grass Yard, Roses. Storage Buildings - 2- 11.5x14 12x20 Workshop, 50x13.5 Carport, 2 Covered Awnings, Ground Set
Key facts
- 8,762 sq ft lot
- 3 parking spots
- Community pool
Property features AI
Finance
- HOA & community: No association fees; Community pool; Biking/walking path
Exterior
- Parking: 2 open parking spaces; 1 covered space; 1 carport space
- Utilities: City water; Septic tank sewer; 220 volts available in kitchen
- Home design: Manufactured/mobile housing; Fee simple ownership; Mountain view
- Construction: Vinyl siding; Wood frame construction; Composition and rolled/hot mop roofing
- Exterior features: Shed(s); Storage; RV hookup; Chain link fencing; Corner lot; Gravel/stone front and back; Asphalt road access
Interior
- Kitchen: Refrigerator; Dishwasher; Disposal; Built-in electric oven; 220 volts in kitchen; Walk-in pantry; Laminate countertops
- Bedrooms: 3 possible bedrooms
- Flooring: Laminate
- Bathrooms: 2 full bathrooms
- Heating & cooling: Heat pump heating; Electric heating; Central air conditioning; Ceiling fans
- Interior features: Eat-in kitchen; Breakfast bar; Full bath in primary bedroom; Separate shower and tub; Dual-pane windows; Storage; Laminate counters
- Laundry & utility: Includes standard utility features
Neighborhood map
What this means for you Summary
Snapshot
- This is a 3-bed/2.0-bath manufactured listed at $245k.
Deal economics
- At list price, monthly cash flow is $134 ($2k/yr) — positive.
- The deal already cash-flows at list — no discount required.
- To meet the 1% rule (rent ≥ 1% of price), the offer needs to be $198k (19.0% below list).
- Recommended offer: $198k (19.0% below list) — sets the bar for 1% rule.
- Cap rate 7.0% vs local median 3.2% in Verde Village — top-decile yield for the area; either an underpriced asset or a hidden risk that comps aren't pricing in. Stress-test before assuming the spread holds.
Location & tenants
- Location reads 66/100 on livability (#74 in AZ) — a middle-class / working-renter tenant base. Strengths: housing A+, health & safety A+, cost of living B+; Watch: employment D+, amenities F, commute F.
- Cottonwood-Oak Creek Elementary District (4487) (town): math 17% / reading 28% proficiency, ranked #174 of 249 in AZ (top 70%) — low school quality limits family demand, transient renter base, plan for 1-2y turnover.
- Zoned schools: Cottonwood Community School (math 8% / reading 13%, grade F, #993 of 1,109 statewide, top 91%, 500 students, 75% FRL); Mingus Union High School (math 22% / reading 27%, grade F, #154 of 381 statewide, top 53%, 1,226 students, 46% FRL).
- Market conditions: Rents soft (-0.2%/yr); 269 active listings in the ZIP; 2 comparable units currently listed for rent nearby; 2,062 units permitted in Yavapai County in 2024 (98 in 5+ unit buildings).
- This rent runs 41% of the median local income ($57k/yr) — at the standard rent-burdened threshold; future hikes will face affordability resistance.
Forward outlook
- Local home prices are declining (-3.0%/yr); year-one equity from $2k of loan paydown is wiped out by about $7k of value loss. Plan a longer hold.
- Yavapai County population projected at +10% by 2050 — modest demand growth; plan on rents tracking national, not racing it.
Negotiation context
- Only 2 days on market — expect competitive offers; lowballing is unlikely to land.
- 3 sale attempts since 23y ago with the ask held roughly flat each time — persistent listings suggest the price (not the market) is what's stuck; bring a comps-based counter.
- Current owner paid $90k; list at $245k implies a 174% gain — meaningful room to come down on a strong offer.
Risks & watch-outs
- Climate carrying-cost: moderate wildfire risk; extreme-heat days projected 5→11/yr by 2055 (HVAC capex compounding) — expect insurance premiums to compound above CPI over the hold.
Questions for the listing agent
- Is there a deadline driving the sale (1031 exchange, divorce, estate, relocation)? That informs how much negotiation room exists.
- The area grade is low — what's the realistic commute time and amenity access for the typical tenant pool here? Any planned neighborhood developments (good or bad) we should know about?
- What's the average days-on-market for RENTAL listings here right now (not sales)? A rising rental-DOM trend means longer vacancies and softer asking-rent achievability than the comps imply.
- What's the recent tenant-quality profile in this submarket — average credit score on applications, eviction rate, late-payment / NSF rate, and stable-employment percentage? A property-management company in the area should have these aggregated.
- How much new for-sale + rental construction is in the pipeline within 1–3 miles? Heavy new supply typically softens prices + rents 12–24 months out; constrained supply supports both.
Investment metrics
- 1% rule
- 0.81% ✗
- Cap rate
- 6.95%
- Cash-on-cash
- 2.35%
- DSCR
- 1.10
- GRM
- 10.3
CMA / ARV
- ARV (on-the-fly)
- $292,320
- Comps found
- 12
Show comp detail 12 sales within ~0.75 mi
| Address | Dist | Beds/Ba | Sqft | Sold | Price | $/sf | Match |
|---|---|---|---|---|---|---|---|
| 3458 E Vaquero Ln | 0.12mi | 3/2.0 | 1,418 (-2%) | 18mo | $125,000 | $88 | 77 |
| 2645 Pipe Creek Dr | 0.12mi | 2/2.0 (-1) | 1,403 (-3%) | 12mo | $285,000 | $203 | 75 |
| 2610 S Pipe Creek Dr | 0.20mi | 3/2.0 | 1,512 (+5%) | 13mo | $262,500 | $174 | 71 |
| 3624 E Maricopa Dr | 0.21mi | 2/2.0 (-1) | 1,345 (-7%) | 9mo | $220,000 | $164 | 66 |
| 2743 S Yuma Cir | 0.32mi | 3/2.0 | 1,317 (-8%) | 6mo | $308,000 | $234 | 66 |
| 3941 E Vaquero Ln | 0.41mi | 3/2.0 | 1,600 (+11%) | 8mo | $335,000 | $209 | 55 |
| 3538 E Granite Dr | 0.43mi | 4/2.0 (+1) | 1,344 (-7%) | 12mo | $125,000 | $93 | 54 |
| 2330 Eagle View Dr | 0.54mi | 3/2.0 | 1,296 (-10%) | 8mo | $303,500 | $234 | 51 |
| 3899 E Mission Ln | 0.44mi | 2/2.0 (-1) | 1,236 (-14%) | 0mo | $260,000 | $210 | 51 |
| 3289 E Colorado Dr | 0.40mi | 2/1.5 (-1) | 1,604 (+11%) | 5mo | $230,000 | $143 | 51 |
| 2376 Warriors Run #3 | 0.44mi | 3/2.0 | 1,248 (-13%) | 15mo | $313,000 | $251 | 45 |
| 3461 E Tower Dr | 0.64mi | 3/2.0 | 1,229 (-15%) | 3mo | $240,000 | $195 | 43 |
Match score weights: distance 35% · size 25% · config 20% · recency 20%. Top-matched comps best support the ARV.
Projected returns pro-forma
-3.0% appreciation · 0.0% rent growth · sell at horizon
- IRR
- -15.6%
- Equity multiple
- 0.46×
- Total profit
- $-37,069
- Equity at exit
- $36,515
- IRR
- -12.4%
- Equity multiple
- 0.35×
- Total profit
- $-44,250
- Equity at exit
- $21,174
Cash invested: $68,572 (down + closing). Projections, not guarantees.
Landlord ↔ Tenant lean methodology
- Overall (STATE)
- 87 Strongly Landlord-Friendly
- State Arizona
- 87 Strongly Landlord-Friendly · R+3
- County
- — inherits STATE
- City
- — inherits STATE
ZIP-level market 86326
- Home prices YoY
- -32.2%
- Rents YoY
- -0.2%
- Active inventory
- 269
- Price-to-rent
- 10.3×
Monthly cashflow live
- Estimated rent
- $1,983 medium interval (Pro) →
- Mortgage (P&I)
- −$1,284
- Tax from tax record
- −$46 /mo · $555/yr
- Insurance
- −$102
- HOA
- −$0
- Vacancy / Maint / Mgmt
- −$417
- Net cashflow
- $134
Break-even live
Sensitivity live
| Price | -10% $273 | -5% $204 | +0% $134 | +5% $65 | +10% $-4 |
|---|---|---|---|---|---|
| Rent | -10% $-22 | -5% $56 | +0% $134 | +5% $213 | +10% $291 |
| Rate | -1.0pp $258 | -0.5pp $197 | base $134 | +0.5pp $71 | +1.0pp $6 |
UW: 25.0% down · 7.5% · 30yr · 1.5% tax · 5.0% vac · 8.0% maint · 8.0% mgmt
Financing live
Cash to close
- Down payment
- $61,225
- Closing costs
- $7,347
- Reserves months
- —
- Total cash needed
- —
Loan-product check · same deal, 3 products live
Conventional
25% down · 7.5% · 30yr
- Down + closing
- —
- Monthly P&I
- —
- Monthly cashflow
- —
- DSCR
- —
- Eligible?
- —
Personal DTI + credit; lowest rate.
DSCR
20% down · 8.5% · 30yr
- Down + closing
- —
- Monthly P&I
- —
- Monthly cashflow
- —
- DSCR
- —
- Eligible?
- —
No personal income docs; deal must DSCR.
Hard money
10% down · 12.0% · 12mo
- Down + closing
- —
- Monthly P&I
- —
- Monthly cashflow
- —
- DSCR
- —
- Eligible?
- —
Short-term bridge; refi at stabilization.
Rent comps 2 comps
| Address | Beds | Baths | Sqft | Rent | $/sqft | DOM | Units | Dist |
|---|---|---|---|---|---|---|---|---|
| 3460 E Colorado Dr Cottonwood, AZ | 3.0 | 1.0 | 1180 | $1,600 | $1.36 | 15d | 1 | 0.48mi |
| 4613 E Bay Cir Cottonwood, AZ | 3.0 | 2.0 | 1500 | $1,995 | $1.33 | 45d | 1 | 0.88mi |
Listing history 6 events
-
2026-05-21$244,900 Active
-
2026-05-06historical
-
2026-04-20$244,900 Active
-
2003-05-01soldstatus $89,500 247-char remark
Show marketing remark (247 chars)
Cb#9840-neat As A Pin. Built In China Hutch, Pantry, Lg M/Closet Garden Tub In Mb, New Washer/Dryer, Appliances Included. Fruit Trees, Grass Yard, Roses. Storage Buildings - 2- 11.5x14 12x20 Workshop, 50x13.5 Carport, 2 Covered Awnings, Ground Set
-
2003-04-29soldstatus $89,500
-
2003-02-10$94,900 247-char remark
Show marketing remark (247 chars)
Cb#9840-neat As A Pin. Built In China Hutch, Pantry, Lg M/Closet Garden Tub In Mb, New Washer/Dryer, Appliances Included. Fruit Trees, Grass Yard, Roses. Storage Buildings - 2- 11.5x14 12x20 Workshop, 50x13.5 Carport, 2 Covered Awnings, Ground Set
ⓘ Source: listings_history table (triggers on properties + properties_extension) + one-shot
backfill from property_details.listing_events for pre-trigger history.
Tax reassessment forecast AZ · Resets to sale price
- Current annual tax
- $555 · $46/mo
- Projected year-2 tax
- $1,616 · $135/mo
- Expected delta
- +$1,061/yr (+$88/mo · 191.3%)
ⓘ Screening estimate from a state-policy table — verify with the county assessor before closing.
Climate risk First Street
- Flood 1/10 Low FEMA zone X (unshaded) · 0% chance over 30 yrs
- Wildfire 5/10 Major
- Heat 6/10 Major 5 d/yr ≥102°F today · 11 d/yr by 30 yrs out
- Wind 1/10 Low
- Air quality 1/10 Low 0 unhealthy d/yr today · 0 by 30 yrs out
Nearby sold comps map
Loading sold comps map…
Walkable amenities ~0.75 mi
Loading nearby amenities…
Taxation est. · year 1
- Rental income
- $23,802
- − Mortgage interest
- −$13,718
- − Property taxes
- −$555
- − Insurance
- −$1,224
- − Repairs & maintenance
- −$1,904
- − Management
- −$1,904
- − Depreciation
- −$7,124
- Taxable loss
- −$2,629
- Est. tax savings @ 24.0%
- +$631
- After-tax cash flow
- $2,243/yr
For passive investors: Depreciation is non-cash, so a rental often shows a tax loss while cash-flowing — sheltering income. Rental losses are passive: they offset passive income freely, and up to $25,000/yr can offset ordinary (W-2) income if you actively participate and your MAGI is under $100k (phasing out to $0 by $150k); unused losses carry forward. On sale, claimed depreciation is recaptured at up to 25%, and gains may owe capital-gains tax (a 1031 exchange can defer both). Figures are a year-1 estimate at your 24.0% rate — not tax advice; consult a CPA.
Schools (NCES district)
- District
- Cottonwood-Oak Creek Elementary District (4487)
- NCES district ID
- 0402370
- Math proficiency
- 17% ▼ -10.00%
- Reading proficiency
- 28% ▼ -7.00%
- Median HH income
- $41,740
- Composite
- 19.16/100
- National rank
- #8822
- State rank
- #174 of 249 in AZ
Livability — Verde Village
- Score
- 66/100
- State rank
- #74
- US rank
- #11711
Category grades
Schools grade is shown separately in the Schools card above.
Census & demographics
- Census place
- Verde Village, AZ
- County
- Yavapai County · 190,406 people
- City population
- 24,852
- Metro
- Prescott Valley-Prescott, AZ
- Population (ZIP)
- 24,852
- Household income
- $57,378
- Rent vs Own
- Severe rent burden
- 894.0
Population outlook (Yavapai County) Hauer SSP2
- Today (2025)
- 241,389 people
- By 2030
- 249,523 · +3.4%
- By 2040
- 259,966 · +7.7%
- By 2050
- 264,736 · +9.7%
- By 2075
- 269,334 · +11.6%
- By 2100
- 256,505 · +6.3%
Race, ethnicity, and origin ACS 2023
- Neighborhood character
- Predominantly White (73%)
- Race & ethnicity
- White 73% Hispanic / Latino 20% Two or more races 14% Native American 1%
- Hispanic origin (detail)
- Mexican 17%
- Common ancestry
- Italian 3% Romanian 3% Lithuanian 2%
- Foreign-born
- 12% · Canada
- Languages at home
- 84% English-only · Spanish 14% German/W. Germanic 1%
Political lean MEDSL · Yavapai
- 2024 margin
- Solid R (+33.9) · D 32.6% · R 66.5%
- 2008→2024 swing
- -9.5pp toward R · 2008: -24.4pp · 2024: -33.9pp
- All cycles
- 2024: R+33.9 2020: R+29.3 2016: R+31.4 2012: R+30.7 2008: R+24.4
Not yet ingested
- Civics
- —
Market trends
- HPI YoY
- ▼ -165.27%
- Current HPI
- 347.5058
- Rent YoY
- ▼ -0.22%
- Metro
- Prescott Valley-Prescott, AZ
- State GDP YoY
- ▲ 4.54%
- F500 in state
- 20
Industry mix (Fortune 500 HQ in AZ)
| Industry | F500 HQs | Revenue |
|---|---|---|
| Technology | 2 | $13B |
|
||
| Mining / Metals | 1 | $23B |
|
||
| Environmental Services | 1 | $16B |
|
||
| Metals / Steel | 1 | $14B |
|
||
| Technology Distribution | 1 | $9B |
|
||
| Homebuilding | 1 | $8B |
|
||
Price history
+158.1% since first listed6 events — show timeline
- 2026-05-21 Listed $244,900 ARMLS
- 2026-05-06 Listing Removed — ARMLS
- 2026-04-20 Listed $244,900 ARMLS
- 2003-05-01 Sold (MLS) $89,500 ARMLS
- 2003-04-29 Sold (Public Records) $89,500 Public Records
- 2003-02-10 Listed $94,900 ARMLS
Property tax history
+2.9%/yrLatest (2025): $555 · +4.5% YoY. Source: county tax records.
Cash-flow waterfall
monthlySold comps — $/sqft
last 12 mo · ≤1 miLoading sold comps…