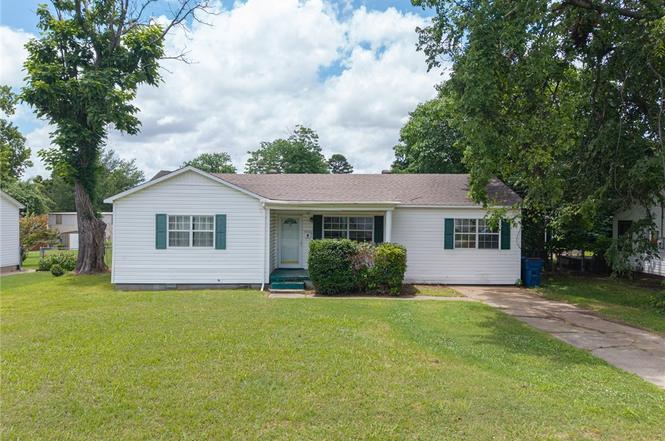
4116 S 18th St · Fort Smith, AR
Flood risk 1/10 · Minimal
- FEMA flood zone
- X (unshaded)
- Chance of flooding over 30 yrs
- 0.0%
- Est. flood insurance / yr
- $507 – $1,088
Fire risk 2/10 · Minimal
- Est. fire insurance / yr
- $1,499 – $2,785
Heat risk 7/10 · Major
- Hot days now (above 111°F)
- 7 days/yr
- Hot days in 30 yrs
- 20 days/yr
Wind risk 2/10 · Minimal
- Chance of severe wind over 30 yrs
- 3.0%
Air-quality risk 2/10 · Minimal
- Unhealthy air days now
- 0 days/yr
- Unhealthy air days in 30 yrs
- 1 days/yr
Risk factors via First Street. Map © Google.
Why this score? — see what drove the D grade
The composite is a weighted blend of 9 inputs, each scored 0–100. Each bar is that input's sub-score; the figure is the points it added to the 100-point composite (weight × sub-score).
- Cash flow +13.5/30.0
- ARV discount +11.8/15.0
- DSCR +4.1/10.0
- Rent growth +3.6/5.0
- Livability +3.2/5.0
- Schools +3.1/10.0
- 1% rule +2.9/10.0
- Condition / age +2.5/5.0
- Appreciation +0.0/10.0
$129,900
🖨 Deal sheet (PDF) 📄 Offer letter ✓ Due diligence
Listing remarks MLS
Wonderful starter home or investment. Newer roof, maintenance free sidings, larger rooms, fenced back yard, and move-in condition, all this $93,500.00
Key facts
- Updated tile
- Bonus room
- Natural light
Tags
Property features AI
Exterior
- Parking: Concrete parking
- Utilities: Public water; Electricity available; Natural gas available
- Home design: Single-family house; One story
- Construction: Aluminum siding; Vinyl siding; Shingle roof
- Exterior features: Patio; Porch; Back yard fencing; Storage structure; City lot; Level lot; Publicly maintained road
Interior
- Kitchen: Oven; Dishwasher; Gas water heater
- Flooring: Ceramic tile; Wood
- Bathrooms: 1 full bathroom
- Heating & cooling: Central heating (electric); Electric cooling; Ceiling fan cooling
- Interior features: Built-in features; Ceiling fans; Blinds on windows
- Laundry & utility: Washer hookup; Electric dryer hookup; Washer; Dryer
Neighborhood map
What this means for you Summary
Snapshot
- This is a 3-bed/1.0-bath single-family listed at $130k.
Deal economics
- At list price, monthly cash flow is $5 ($57/yr) — positive.
- The deal already cash-flows at list — no discount required.
- To meet the 1% rule (rent ≥ 1% of price), the offer needs to be $103k (21.0% below list).
- Recommended offer: $103k (21.0% below list) — sets the bar for 1% rule.
- Cap rate 6.3% vs local median 4.3% in Fort Smith — top-decile yield for the area; either an underpriced asset or a hidden risk that comps aren't pricing in. Stress-test before assuming the spread holds.
Location & tenants
- Location reads 65/100 on livability (#151 in AR) — a middle-class / working-renter tenant base. Strengths: cost of living A+, housing A+, health & safety A+; Watch: crime F, amenities F, commute F.
- Fort Smith School District (urban): math 35% / reading 39% proficiency, ranked #106 of 238 in AR (top 44%) — families likely to look elsewhere, expect single-tenant / working-renter base with shorter leases; 64% free/reduced lunch — lower-income household profile, screen leases tightly.
- Zoned schools: Raymond F. Orr Elem. School (math 36% / reading 33%, grade F, #254 of 454 statewide, top 59%, 306 students, 77% FRL); Ramsey Junior High School (math 37% / reading 47%, grade D-, #78 of 201 statewide, top 40%, 832 students, 67% FRL); Southside High School (math 36% / reading 53%, grade F, #31 of 292 statewide, top 12%, 1,956 students, 47% FRL) — zoned schools at 64% FRL track the district average.
- Market conditions: Rents rising fast (+4.4%/yr); 174 active listings in the ZIP; 14 comparable units currently listed for rent nearby; rentals at typical pace (median 22d on market — plan ~3-4 weeks tenant-placement turnaround); lower-income renter base — watch delinquency; 388 units permitted in Sebastian County in 2024 (16 in 5+ unit buildings).
Forward outlook
- Local home prices are declining (-3.0%/yr); year-one equity from $898 of loan paydown is wiped out by about $4k of value loss. Plan a longer hold.
- Sebastian County population projected at +7% by 2050 — modest demand growth; plan on rents tracking national, not racing it.
Negotiation context
- Only 4 days on market — expect competitive offers; lowballing is unlikely to land.
- 2 sale attempts since 5y ago with the ask held roughly flat each time — persistent listings suggest the price (not the market) is what's stuck; bring a comps-based counter.
- Current owner paid $86k; list at $130k implies a 50% gain — meaningful room to come down on a strong offer.
Risks & watch-outs
- Watch-outs: built in 1950 — expect roof / HVAC / electrical / plumbing capex.
- Climate carrying-cost: extreme-heat days projected 7→20/yr by 2055 (HVAC capex compounding) — expect insurance premiums to compound above CPI over the hold.
Questions for the listing agent
- Built in 1950 — when were the roof, HVAC, electrical panel, plumbing, and water heater last replaced?
- Is there a deadline driving the sale (1031 exchange, divorce, estate, relocation)? That informs how much negotiation room exists.
- Schools are D-rated, which usually means shorter tenancies and higher turnover. Who's the typical renter profile here, and what's been the actual vacancy rate?
- Crime grade is F in this area — have there been break-ins, vandalism, or insurance claims at this property in the last 3 years? What carrier currently insures it and at what premium?
- The area grade is low — what's the realistic commute time and amenity access for the typical tenant pool here? Any planned neighborhood developments (good or bad) we should know about?
- What's the average days-on-market for RENTAL listings here right now (not sales)? A rising rental-DOM trend means longer vacancies and softer asking-rent achievability than the comps imply.
- What's the recent tenant-quality profile in this submarket — average credit score on applications, eviction rate, late-payment / NSF rate, and stable-employment percentage? A property-management company in the area should have these aggregated.
- How much new for-sale + rental construction is in the pipeline within 1–3 miles? Heavy new supply typically softens prices + rents 12–24 months out; constrained supply supports both.
Investment metrics
- 1% rule
- 0.79% ✗
- Cap rate
- 6.34%
- Cash-on-cash
- 0.16%
- DSCR
- 1.01
- GRM
- 10.6
CMA / ARV
- ARV (on-the-fly)
- $143,640
- Comps found
- 12
Show comp detail 12 sales within ~0.75 mi
| Address | Dist | Beds/Ba | Sqft | Sold | Price | $/sf | Match |
|---|---|---|---|---|---|---|---|
| 1511 Houston St | 0.39mi | 3/2.0 | 1,282 (+2%) | 3mo | $195,000 | $152 | 72 |
| 4423 S 21st St | 0.29mi | 3/2.0 | 1,200 (-5%) | 3mo | $83,000 | $69 | 72 |
| 4721 Jenny Lind Rd | 0.41mi | 3/1.0 | 1,195 (-5%) | 5mo | $140,000 | $117 | 68 |
| 1605 S Independence St | 0.32mi | 3/1.5 | 1,118 (-11%) | 1mo | $163,400 | $146 | 64 |
| 4808 S 16th Ter | 0.41mi | 3/2.0 | 1,170 (-7%) | 2mo | $149,500 | $128 | 64 |
| 1821 Vicksburg St | 0.73mi | 3/1.5 | 1,274 (+1%) | 1mo | $145,000 | $114 | 61 |
| 4407 S 27th St | 0.65mi | 3/1.0 | 1,320 (+5%) | 2mo | $145,000 | $110 | 60 |
| 1923 Utica St | 0.62mi | 3/1.5 | 1,200 (-5%) | 2mo | $145,500 | $121 | 59 |
| 4607 S 22nd St | 0.39mi | 3/1.5 | 1,421 (+13%) | 1mo | $150,000 | $106 | 57 |
| 1924 Utica Pl | 0.70mi | 3/1.5 | 1,360 (+8%) | 3mo | $126,500 | $93 | 49 |
| 3220 S 16th St | 0.67mi | 3/2.0 | 1,104 (-12%) | 0mo | $67,250 | $61 | 44 |
| 4810 27th St | 0.73mi | 3/1.0 | 1,404 (+11%) | 4mo | $71,000 | $51 | 43 |
Match score weights: distance 35% · size 25% · config 20% · recency 20%. Top-matched comps best support the ARV.
Projected returns pro-forma
-3.0% appreciation · 4.37% rent growth · sell at horizon
- IRR
- -14.7%
- Equity multiple
- 0.47×
- Total profit
- $-19,354
- Equity at exit
- $19,369
- IRR
- -4.2%
- Equity multiple
- 0.71×
- Total profit
- $-10,582
- Equity at exit
- $11,231
Cash invested: $36,372 (down + closing). Projections, not guarantees.
Landlord ↔ Tenant lean methodology
- Overall (STATE)
- 92 Strongly Landlord-Friendly
- State Arkansas
- 92 Strongly Landlord-Friendly · R+14
- County
- — inherits STATE
- City
- — inherits STATE
ZIP-level market 72901
- Rents YoY
- 4.4%
- Active inventory
- 174
- Price-to-rent
- 10.6×
Monthly cashflow live
- Estimated rent
- $1,026 high interval (Pro) →
- Mortgage (P&I)
- −$681
- Tax from tax record
- −$70 /mo · $844/yr
- Insurance
- −$54
- HOA
- −$0
- Vacancy / Maint / Mgmt
- −$215
- Net cashflow
- $5
Break-even live
Sensitivity live
| Price | -10% $78 | -5% $42 | +0% $5 | +5% $-32 | +10% $-69 |
|---|---|---|---|---|---|
| Rent | -10% $-76 | -5% $-36 | +0% $5 | +5% $45 | +10% $86 |
| Rate | -1.0pp $70 | -0.5pp $38 | base $5 | +0.5pp $-29 | +1.0pp $-63 |
UW: 25.0% down · 7.5% · 30yr · 1.5% tax · 5.0% vac · 8.0% maint · 8.0% mgmt
Financing live
Cash to close
- Down payment
- $32,475
- Closing costs
- $3,897
- Reserves months
- —
- Total cash needed
- —
Loan-product check · same deal, 3 products live
Conventional
25% down · 7.5% · 30yr
- Down + closing
- —
- Monthly P&I
- —
- Monthly cashflow
- —
- DSCR
- —
- Eligible?
- —
Personal DTI + credit; lowest rate.
DSCR
20% down · 8.5% · 30yr
- Down + closing
- —
- Monthly P&I
- —
- Monthly cashflow
- —
- DSCR
- —
- Eligible?
- —
No personal income docs; deal must DSCR.
Hard money
10% down · 12.0% · 12mo
- Down + closing
- —
- Monthly P&I
- —
- Monthly cashflow
- —
- DSCR
- —
- Eligible?
- —
Short-term bridge; refi at stabilization.
Rent comps 14 comps
| Address | Beds | Baths | Sqft | Rent | $/sqft | DOM | Units | Dist |
|---|---|---|---|---|---|---|---|---|
| 1813 Osage St Unit A Fort Smith, AR | 2.0 | 2.0 | 978 | $975 | $1.00 | 21d | 1 | 0.23mi |
| 1624 Fresno St Fort Smith, AR | 1.0–2.0 | 1.0 | 785 | $895 | $1.14 | 14d | 3 | 0.45mi |
| 2212 Savannah St Fort Smith, AR | 2.0 | 1.5 | 916 | $1,095 | $1.20 | 21d | 1 | 0.67mi |
| 5019 S 28th St Fort Smith, AR | 2.0 | 1.0 | 1020 | $2,175 | $2.13 | 21d | 1 | 0.97mi |
| 5124 S 29th St Unit B Fort Smith, AR | 2.0 | 2.0 | 900 | $895 | $0.99 | 21d | 1 | 1.06mi |
| 2851 Xavier St Fort Smith, AR | 2.0 | 2.0 | 986 | $925 | $0.94 | 14d | 2 | 1.15mi |
| 1439 Brazil Ave Fort Smith, AR | 3.0 | 2.0 | 1050 | $900 | $0.86 | 21d | 1 | 1.19mi |
| 2307 S 23rd St Fort Smith, AR | 3.0 | 2.5 | 1356 | $1,595 | $1.18 | 21d | 1 | 1.26mi |
| 5024 S 34th St Unit 5024A Fort Smith, AR | 2.0 | 2.0 | 986 | $925 | $0.94 | 14d | 1 | 1.26mi |
| 5024 S 34th St Unit 5028A Fort Smith, AR | 2.0 | 2.0 | 986 | $925 | $0.94 | 21d | 1 | 1.26mi |
| 2200 S 17th St Unit D Fort Smith, AR | 3.0 | 2.0 | 1123 | $975 | $0.87 | 21d | 1 | 1.28mi |
| 2800 Wharton Cir Unit 2323 Fort Smith, AR | 2.0 | 2.0 | 1240 | $925 | $0.75 | 14d | 1 | 1.29mi |
| 1915 S U St Unit A Fort Smith, AR | 2.0 | 2.0 | 900 | $975 | $1.08 | 21d | 1 | 1.32mi |
| 3700 Dallas St Fort Smith, AR | 3.0 | 2.0 | 1544 | $1,795 | $1.16 | 21d | 1 | 1.45mi |
Listing history 6 events
-
2026-06-19status $129,900 Pending 4 DOM
-
2026-06-18days on market $129,900 Active 4 DOM
-
2026-06-17days on market $129,900 Active 3 DOM
-
2026-06-16days on market $129,900 Active 2 DOM
-
2026-06-15remarks 687-char remark
-
2026-06-15$129,900 Active 1 DOM
ⓘ Source: listings_history table (triggers on properties + properties_extension) + one-shot
backfill from property_details.listing_events for pre-trigger history.
Tax reassessment forecast AR · Resets to sale price
- Current annual tax
- $844 · $70/mo
- Projected year-2 tax
- $844 · $70/mo
- Expected delta
- $0/yr ($0/mo · 0.0%)
ⓘ Screening estimate from a state-policy table — verify with the county assessor before closing.
Climate risk First Street
- Flood 1/10 Low FEMA zone X (unshaded) · 0% chance over 30 yrs
- Wildfire 2/10 Low
- Heat 7/10 Severe 7 d/yr ≥111°F today · 20 d/yr by 30 yrs out
- Wind 2/10 Low 3% chance of damaging wind over 30 yrs
- Air quality 2/10 Low 0 unhealthy d/yr today · 1 by 30 yrs out
Nearby sold comps map
Loading sold comps map…
Walkable amenities ~0.75 mi
Loading nearby amenities…
Taxation est. · year 1
- Rental income
- $12,310
- − Mortgage interest
- −$7,276
- − Property taxes
- −$844
- − Insurance
- −$650
- − Repairs & maintenance
- −$985
- − Management
- −$985
- − Depreciation
- −$3,779
- Taxable loss
- −$2,208
- Est. tax savings @ 24.0%
- +$530
- After-tax cash flow
- $587/yr
For passive investors: Depreciation is non-cash, so a rental often shows a tax loss while cash-flowing — sheltering income. Rental losses are passive: they offset passive income freely, and up to $25,000/yr can offset ordinary (W-2) income if you actively participate and your MAGI is under $100k (phasing out to $0 by $150k); unused losses carry forward. On sale, claimed depreciation is recaptured at up to 25%, and gains may owe capital-gains tax (a 1031 exchange can defer both). Figures are a year-1 estimate at your 24.0% rate — not tax advice; consult a CPA.
Schools (NCES district)
- District
- Fort Smith School District
- NCES district ID
- 0506330
- Math proficiency
- 35% ▼ -11.00%
- Reading proficiency
- 39% ▼ -7.00%
- Median HH income
- $36,066
- Composite
- 30.66/100
- National rank
- #6183
- State rank
- #106 of 238 in AR
Livability — Fort Smith
- Score
- 65/100
- State rank
- #151
- US rank
- #13185
Category grades
Schools grade is shown separately in the Schools card above.
Census & demographics
- Census place
- Fort Smith, AR
- County
- Sebastian County · 99,312 people
- City population
- 94,356
- Metro
- Fort Smith, AR-OK
- Population (ZIP)
- 19,819
- Household income
- $42,851
- Rent vs Own
- Severe rent burden
- 1117.0
Population outlook (Sebastian County) Hauer SSP2
- Today (2025)
- 133,992 people
- By 2030
- 136,620 · +2.0%
- By 2040
- 140,832 · +5.1%
- By 2050
- 143,301 · +6.9%
- By 2075
- 147,964 · +10.4%
- By 2100
- 145,848 · +8.8%
Race, ethnicity, and origin ACS 2023
- Neighborhood character
- Diverse neighborhood (Simpson 0.60)
- Race & ethnicity
- White 60% Hispanic / Latino 17% Two or more races 12% Black 10% Asian 2%
- Hispanic origin (detail)
- Mexican 11% Puerto Rican 1%
- Common ancestry
- Slovak 2% Lithuanian 2% Italian 1%
- Foreign-born
- 9% · Canada, Vietnam, Guatemala
- Languages at home
- 83% English-only · Spanish 14% Other Asian/Pacific 1% Vietnamese 1%
Political lean MEDSL · Sebastian
- 2024 margin
- Solid R (+37.5) · D 30.0% · R 67.6% · Other 2.4%
- 2008→2024 swing
- -2.9pp toward R · 2008: -34.6pp · 2024: -37.5pp
- All cycles
- 2024: R+37.5 2020: R+35.5 2016: R+38.1 2012: R+37.1 2008: R+34.6
Not yet ingested
- Civics
- —
Market trends
- HPI YoY
- ▼ -173.82%
- Current HPI
- 172.3777
- Rent YoY
- ▲ 4.37%
- Metro
- Fort Smith, AR-OK
- State GDP YoY
- ▲ 3.80%
- F500 in state
- 10
Industry mix (Fortune 500 HQ in AR)
| Industry | F500 HQs | Revenue |
|---|---|---|
| Retail | 1 | $681B |
|
||
| Food / Agriculture | 1 | $53B |
|
||
| Retail / Energy | 1 | $22B |
|
||
| Transportation / Logistics | 1 | $12B |
|
||
| Energy | 1 | $4B |
|
||
Price history
+38.9% since first listed4 events — show timeline
- 2026-06-14 Listed $129,900 WRVBOR
- 2021-04-12 Sold (Public Records) $86,500 Public Records
- 2021-04-09 Sold (MLS) $86,500 WRVBOR
- 2021-02-23 Listed $93,500 WRVBOR
Property tax history
+2.0%/yrLatest (2025): $844 · +8.9% YoY. Source: county tax records.
Cash-flow waterfall
monthlySold comps — $/sqft
last 12 mo · ≤1 miLoading sold comps…