1709 Dan St · Houston, TX
Flood risk 7/10 · Major
- FEMA flood zone
- X (unshaded)
- Chance of flooding over 30 yrs
- 0.99%
- Est. flood insurance / yr
- $507 – $1,088
Fire risk 1/10 · Minimal
- Est. fire insurance / yr
- $1,222 – $2,270
Heat risk 9/10 · Severe
- Hot days now (above 109°F)
- 7 days/yr
- Hot days in 30 yrs
- 24 days/yr
Wind risk 9/10 · Severe
- Chance of severe wind over 30 yrs
- 99.0%
Air-quality risk 3/10 · Minor
- Unhealthy air days now
- 2 days/yr
- Unhealthy air days in 30 yrs
- 3 days/yr
Risk factors via First Street. Map © Google.
Why this score? — see what drove the B grade
The composite is a weighted blend of 9 inputs, each scored 0–100. Each bar is that input's sub-score; the figure is the points it added to the 100-point composite (weight × sub-score).
- Cash flow +19.9/30.0
- ARV discount +15.0/15.0
- Appreciation +10.0/10.0
- 1% rule +6.6/10.0
- DSCR +6.3/10.0
- Livability +3.7/5.0
- Rent growth +3.6/5.0
- Schools +2.7/10.0
- Condition / age +2.5/5.0
$174,900
🖨 Deal sheet 📄 Offer letter ✓ Due diligence
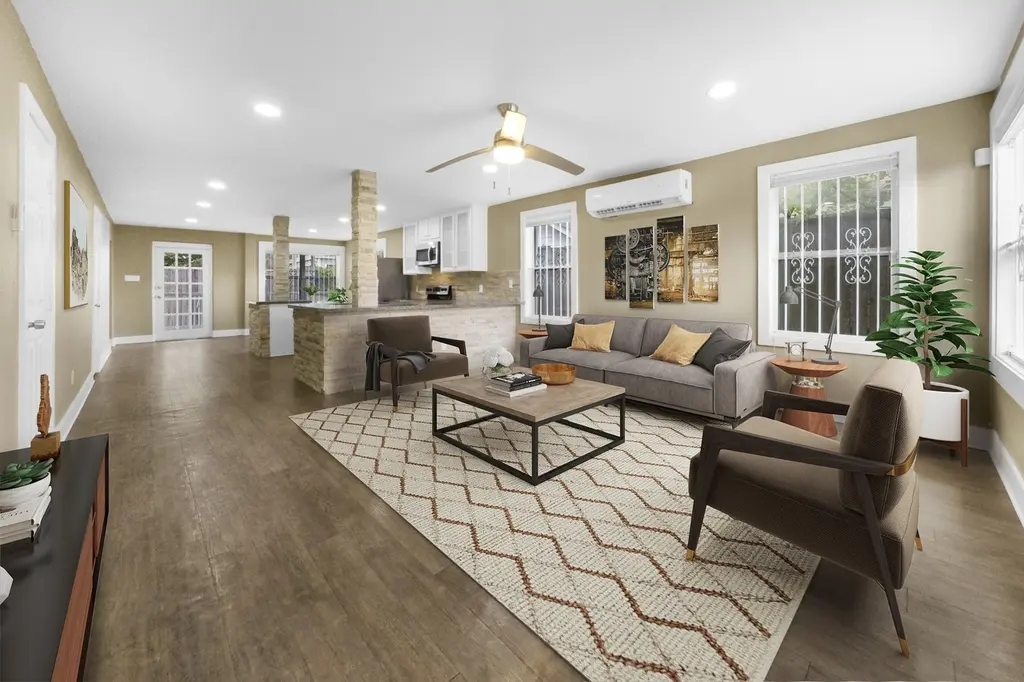
Listing remarks
This one-of-a-kind metal container home sits just minutes from downtown Houston and offers an affordable alternative to older homes in the area. With two bedrooms and two full baths, it’s an open layout with wood-look flooring throughout, granite countertops, and covered porches in the front and back—perfect for taking in some fresh air. Built in 2013 with energy efficiency in mind, the home features spray foam insulation in the ceilings, batt insulation in the walls, low-E double-pane windows, and 3 mini-split A/C system that keeps the house cool while keeping bills low. There’s a full in-house laundry setup, storage space throughout, and an automatic driveway gate that a
Key facts
- 3,079 sq ft lot
- Parking
- Built 2013
Property features AI
Finance
- Financial info: Full ownership
- HOA & community: Curbs in community
Exterior
- Parking: Driveway; Electric gate
- Security: Owned security system; Smoke detectors
- Utilities: Public water; Public sewer
- Home design: Residential property; Faces east; Built in 2013; Pillar/post/pier foundation
- Construction: Aluminum siding; Wood siding; Composition roof; Metal roof
- Exterior features: Covered patio; Deck; Porch; Patio; Fully fenced backyard; Back yard fencing; Subdivision setting; Asphalt road access
Interior
- Kitchen: Dishwasher; Electric oven; Electric range; Disposal; Microwave; Refrigerator; Tankless water heater
- Bedrooms: 2 possible bedrooms; Primary bedroom on first floor (13 x 12); Additional bedroom on first floor (10 x 12)
- Flooring: Plank flooring; Vinyl flooring
- Bathrooms: 2 full bathrooms; Primary bathroom on first floor
- Heating & cooling: Central heating (electric, zoned); Central air (electric)
- Interior features: Breakfast bar; Double vanity; Granite counters; Kitchen island; Kitchen/family room combo; Pantry; Tub/shower; Window treatments; Ceiling fans; Programmable thermostat; Low emissivity windows; Window coverings; No fireplaces; 8 total rooms
- Laundry & utility: Washer hookup; Electric dryer hookup; Utility room on first floor
Neighborhood map
What this means for you Summary
Snapshot
- This is a 2-bed/2.0-bath single-family listed at $175k.
Deal economics
- At list price, monthly cash flow is $144 ($2k/yr) — positive.
- The deal already cash-flows at list — no discount required.
- Meets the 1% rule at list price ($2k rent vs $175k).
- Recommended offer: $170k (3.0% below list) — sets the bar for market timing.
Location & tenants
- Location reads 74/100 on livability (#184 in TX, #4,771 nationally) — a middle-class / working-renter tenant base. Strengths: amenities A+, cost of living A+, housing A+; Watch: crime F.
- Houston ISD (urban): math 27% / reading 35% proficiency, ranked #593 of 826 in TX (top 72%) — families likely to look elsewhere, expect single-tenant / working-renter base with shorter leases; 71% free/reduced lunch — lower-income household profile, screen leases tightly.
- Zoned schools: Fleming Middle (math 10% / reading 15%, grade F, #1,616 of 1,662 statewide, top 97%, 384 students, 97% FRL); Wheatley H S (math 17% / reading 19%, grade F, #1,445 of 1,632 statewide, top 89%, 643 students, 95% FRL) — zoned schools average 96% FRL vs 71% district-wide (25 pts higher); higher-poverty schools than district average — tighter screening recommended.
- Zoned-school proficiency averages 15% at this address vs 31% district-wide (-16 pts) — the specific schools serving this property underperform the Houston ISD average; the district grade overstates school quality for this exact location.
- Market conditions: Rents rising fast (+4.3%/yr); 337 active listings in the ZIP; 13 comparable units currently listed for rent nearby; rentals at typical pace (median 21d on market — plan ~3-4 weeks tenant-placement turnaround); 46% of comp listings sitting > 30 days — soft ceiling on asking rent; 29,883 units permitted in Harris County in 2024 (8,621 in 5+ unit buildings).
Forward outlook
- In year one you build about $19k of equity ($1k loan paydown + $17k appreciation (10.0% local appreciation)).
- Harris County population projected at +47% by 2050 — long-run rental-demand tailwind backs the buy-and-hold thesis.
- At projected returns (10.0% appreciation + 4.3% rent growth), your $49k cash investment doubles in ~3 years — after that, you're playing with house money.
- By year 2, paydown + projected appreciation supports a ~$30k cash-out refi (75% LTV) — recoverable capital for the next deal without selling this one.
Negotiation context
- It's been on market 50 days — a 3% lower offer ($170k) is reasonable based on typical stale-listing flexibility.
- 21 sale attempts since 22y ago with the ask held roughly flat each time — persistent listings suggest the price (not the market) is what's stuck; bring a comps-based counter.
Risks & watch-outs
- Watch-outs: property tax is 2.7% of price; flood insurance adds $66/mo.
- Climate carrying-cost: major flood risk; severe wind risk, 99% chance of damaging wind over 30y; extreme-heat days projected 7→24/yr by 2055 (HVAC capex compounding) — expect insurance premiums to compound above CPI over the hold.
Questions for the listing agent
- It's been on market 50 days. Have you received any prior offers? Is the seller open to a 3% concession, seller financing, or rate buy-down credit?
- Property tax is high relative to price — has the assessment been appealed recently, and will the sale trigger a re-assessment?
- What's the actual annual flood-insurance premium (NFIP or private), and is the property in a SFHA with mandatory coverage?
- Is there a deadline driving the sale (1031 exchange, divorce, estate, relocation)? That informs how much negotiation room exists.
- Schools are D-rated, which usually means shorter tenancies and higher turnover. Who's the typical renter profile here, and what's been the actual vacancy rate?
- Crime grade is F in this area — have there been break-ins, vandalism, or insurance claims at this property in the last 3 years? What carrier currently insures it and at what premium?
- What's the average days-on-market for RENTAL listings here right now (not sales)? A rising rental-DOM trend means longer vacancies and softer asking-rent achievability than the comps imply.
- What's the recent tenant-quality profile in this submarket — average credit score on applications, eviction rate, late-payment / NSF rate, and stable-employment percentage? A property-management company in the area should have these aggregated.
- How much new for-sale + rental construction is in the pipeline within 1–3 miles? Heavy new supply typically softens prices + rents 12–24 months out; constrained supply supports both.
Investment metrics
- 1% rule
- 1.16% ✓
- Cap rate
- 7.73%
- Cash-on-cash
- 5.14%
- DSCR
- 1.23
- GRM
- 7.2
CMA / ARV
- ARV (median comp)
- $209,693
- List price
- $174,900
- Delta
- -16.59%
- Verdict
- UNDERPRICED
- Comps
- 20 within 1.0 mi
Show comp detail 12 sales within ~0.75 mi
| Address | Dist | Beds/Ba | Sqft | Sold | Price | $/sf | Match |
|---|---|---|---|---|---|---|---|
| 5001 Farmer St | 0.32mi | 2/2.0 | 1,360 (+6%) | 2mo | $299,000 | $220 | 74 |
| 2004 Worms St | 0.42mi | 2/2.0 | 1,344 (+5%) | 1mo | $259,000 | $193 | 71 |
| 4803 Farmer St | 0.24mi | 2/1.0 | 1,200 (-6%) | 7mo | $140,000 | $117 | 68 |
| 1413 Featherstone St | 0.25mi | 3/2.5 (+1) | 1,344 (+5%) | 11mo | $184,000 | $137 | 64 |
| 1811 Pannell St Unit C | 0.46mi | 2/2.0 | 1,381 (+8%) | 7mo | $275,000 | $199 | 60 |
| 4703 Nichols St | 0.32mi | 3/1.0 (+1) | 1,248 (-2%) | 16mo | $135,000 | $108 | 58 |
| 4714 Buck St | 0.53mi | 3/2.0 (+1) | 1,345 (+5%) | 7mo | $289,900 | $216 | 56 |
| 5214 Hershe St | 0.45mi | 3/1.0 (+1) | 1,207 (-6%) | 7mo | $164,000 | $136 | 54 |
| 2405 Pannell St | 0.67mi | 3/1.5 (+1) | 1,230 (-4%) | 3mo | $99,500 | $81 | 53 |
| 4214 Quitman St | 0.47mi | 3/2.0 (+1) | 1,128 (-12%) | 0mo | $174,999 | $155 | 53 |
| 4705 Coke St | 0.64mi | 3/2.0 (+1) | 1,212 (-5%) | 9mo | $245,000 | $202 | 49 |
| 1915 Pannell St | 0.47mi | 3/2.0 (+1) | 1,100 (-14%) | 14mo | $239,900 | $218 | 38 |
Match score weights: distance 35% · size 25% · config 20% · recency 20%. Top-matched comps best support the ARV.
Projected returns pro-forma
10.0% appreciation · 4.27% rent growth · sell at horizon
- IRR
- 27.4%
- Equity multiple
- 3.19×
- Total profit
- $107,197
- Equity at exit
- $157,564
- IRR
- 24.4%
- Equity multiple
- 7.42×
- Total profit
- $314,450
- Equity at exit
- $339,792
Cash invested: $48,972 (down + closing). Projections, not guarantees.
Landlord ↔ Tenant lean methodology
- Overall (STATE)
- 87 Strongly Landlord-Friendly
- State Texas
- 87 Strongly Landlord-Friendly · R+5
- County
- — inherits STATE
- City
- — inherits STATE
ZIP-level market 77020
- Home prices YoY
- 29.1%
- Rents YoY
- 4.3%
- Active inventory
- 337
- Price-to-rent
- 7.2×
Monthly cashflow live
- Estimated rent
- $2,024 high interval (Pro) →
- Mortgage (P&I)
- −$917
- Tax from tax record
- −$399 /mo · $4,790/yr
- Insurance
- −$73
- Flood insurance flood zone
- −$66 /mo · $798/yr
- HOA
- −$0
- Vacancy / Maint / Mgmt
- −$425
- Net cashflow
- $144
Break-even live
UW: 25.0% down · 7.5% · 30yr · 1.5% tax · 5.0% vac · 8.0% maint · 8.0% mgmt
Financing live
Cash to close
- Down payment
- $43,725
- Closing costs
- $5,247
- Reserves months
- —
- Total cash needed
- —
Loan-product check · same deal, 3 products live
Conventional
25% down · 7.5% · 30yr
- Down + closing
- —
- Monthly P&I
- —
- Monthly cashflow
- —
- DSCR
- —
- Eligible?
- —
Personal DTI + credit; lowest rate.
DSCR
20% down · 8.5% · 30yr
- Down + closing
- —
- Monthly P&I
- —
- Monthly cashflow
- —
- DSCR
- —
- Eligible?
- —
No personal income docs; deal must DSCR.
Hard money
10% down · 12.0% · 12mo
- Down + closing
- —
- Monthly P&I
- —
- Monthly cashflow
- —
- DSCR
- —
- Eligible?
- —
Short-term bridge; refi at stabilization.
Rent comps 13 comps
| Address | Beds | Baths | Sqft | Rent | $/sqft | DOM | Units | Dist |
|---|---|---|---|---|---|---|---|---|
| 4712 Rawley St Unit a Houston, TX | 3.0 | 2.0 | 1501 | $2,070 | $1.38 | 21d | 1 | 0.21mi |
| 4712 Rawley St Unit B Houston, TX | 3.0 | 2.5 | 1501 | $2,045 | $1.36 | 21d | 1 | 0.21mi |
| 3730 Lyons Ave Unit 216 Houston, TX | 3.0 | 2.0 | 1107 | $1,300 | $1.17 | 44d | 1 | 0.44mi |
| 1513 Cage St Houston, TX | 3.0 | 2.0 | 1467 | $1,550 | $1.06 | 44d | 1 | 0.64mi |
| 2105 Sam Wilson St Houston, TX | 3.0 | 2.5 | 1416 | $6,750 | $4.77 | 44d | 1 | 0.67mi |
| 5605 Mulvey St Unit 1019610P Houston, TX | 3.0 | 2.5 | 1410 | $4,237 | $3.00 | 3d | 1 | 0.67mi |
| 1307 Bayou St Unit B Houston, TX | 3.0 | 3.0 | 1814 | $2,400 | $1.32 | 8d | 1 | 0.83mi |
| 1303 Bayou St Unit C Houston, TX | 3.0 | 3.0 | 1869 | $3,200 | $1.71 | 44d | 1 | 0.83mi |
| 2704 Sam Wilson St Unit 1391353P Houston, TX | 2.0 | 2.0 | 1001 | $1,916 | $1.91 | 8d | 1 | 0.94mi |
| 308 Grove St Houston, TX | 3.0 | 3.0 | 1701 | $2,350 | $1.38 | 8d | 1 | 1.03mi |
| 3503 Wyrick St Houston, TX | 3.0 | 2.5 | 1746 | $2,850 | $1.63 | 44d | 1 | 1.09mi |
| 1714 Mary St Houston, TX | 2.0 | 2.0 | 1100 | $2,400 | $2.18 | 44d | 1 | 1.29mi |
| 800 Middle St Houston, TX | 1.0–4.0 | 1.0–2.0 | 1003 | $1,320 | $1.32 | 5d | 1 | 1.36mi |
Listing history 50 events
-
2026-06-18days on market $174,900 Active 50 DOM
-
2026-06-17days on market $174,900 Active 49 DOM
-
2026-06-16days on market $174,900 Active 48 DOM
-
2026-06-15days on market $174,900 Active 47 DOM
-
2026-06-13days on market $174,900 Active 45 DOM
-
2026-06-10days on market $174,900 Active 41 DOM
-
2026-06-08days on market $174,900 Active 40 DOM
-
2026-06-07days on market $174,900 Active 39 DOM
-
2026-06-04days on market $174,900 Active 36 DOM
-
2026-06-01days on market $174,900 Active 33 DOM
-
2026-05-31days on market $174,900 Active 32 DOM
-
2026-04-29$174,900 Active 1005-char remark
-
2026-04-29historical
-
2025-12-15price $179,900
-
2025-09-26$189,900 Active
-
2025-09-04$189,900 Active
-
2025-09-04historical
-
2025-09-03historical
-
2025-08-22$189,900 Active
-
2025-08-20status Pending
-
2025-08-20historical
-
2025-08-08price $189,900
-
2025-07-02price $199,900
-
2025-06-08price $239,900
-
2025-04-17$249,900 Active
-
2025-03-02historical
-
2025-02-09$179,900 Active
-
2024-12-24historical
-
2024-10-09$179,500 Active
-
2024-10-09historical
-
2024-07-21price $199,995
-
2024-04-24price $219,995
-
2024-04-11price $224,995
-
2024-03-30price $229,995
-
2024-03-24price $234,995
-
2024-03-16price $243,999
-
2024-03-07$249,000 Active
-
2024-02-15historical
-
2024-02-14status Active
-
2024-02-08status Option Pending
-
2023-12-28price $232,400
-
2023-12-20price $242,400
-
2023-12-04$244,900 Active
-
2023-12-04historical
-
2023-11-25price $244,900
-
2023-11-16price $249,900
-
2023-10-16price $254,900
-
2023-09-08$264,900 Active
-
2023-09-08historical
-
2023-08-12price $264,900
ⓘ Source: listings_history table (triggers on properties + properties_extension) + one-shot
backfill from property_details.listing_events for pre-trigger history.
Tax reassessment forecast TX · Resets to sale price
- Current annual tax
- $4,790 · $399/mo
- Projected year-2 tax
- $4,790 · $399/mo
- Expected delta
- $0/yr ($0/mo · 0.0%)
ⓘ Screening estimate from a state-policy table — verify with the county assessor before closing.
Climate risk First Street
- Flood 7/10 Severe FEMA zone X (unshaded) · 99% chance over 30 yrs
- Wildfire 1/10 Low
- Heat 9/10 Extreme 7 d/yr ≥109°F today · 24 d/yr by 30 yrs out
- Wind 9/10 Extreme 99% chance of damaging wind over 30 yrs
- Air quality 3/10 Moderate 2 unhealthy d/yr today · 3 by 30 yrs out
Nearby sold comps map
Loading sold comps map…
Walkable amenities ~0.75 mi
Loading nearby amenities…
Taxation est. · year 1
- Rental income
- $24,292
- − Mortgage interest
- −$9,797
- − Property taxes
- −$4,790
- − Insurance
- −$1,672
- − Repairs & maintenance
- −$1,943
- − Management
- −$1,943
- − Depreciation
- −$5,088
- Taxable loss
- −$942
- Est. tax savings @ 24.0%
- +$226
- After-tax cash flow
- $1,948/yr
For passive investors: Depreciation is non-cash, so a rental often shows a tax loss while cash-flowing — sheltering income. Rental losses are passive: they offset passive income freely, and up to $25,000/yr can offset ordinary (W-2) income if you actively participate and your MAGI is under $100k (phasing out to $0 by $150k); unused losses carry forward. On sale, claimed depreciation is recaptured at up to 25%, and gains may owe capital-gains tax (a 1031 exchange can defer both). Figures are a year-1 estimate at your 24.0% rate — not tax advice; consult a CPA.
Schools (NCES district)
- District
- Houston ISD
- NCES district ID
- 4823640
- Math proficiency
- 27% ▼ -18.00%
- Reading proficiency
- 35% ▼ -6.00%
- Median HH income
- $46,054
- Composite
- 26.63/100
- National rank
- #7173
- State rank
- #593 of 826 in TX
Livability — Houston
- Score
- 74/100
- State rank
- #184
- US rank
- #4771
Category grades
Schools grade is shown separately in the Schools card above.
Census & demographics
- Census place
- Houston, TX
- County
- Harris County · 4,702,590 people
- City population
- 3,226,434
- Metro
- Houston-The Woodlands-Sugar Land, TX
- Population (ZIP)
- 23,686
- Household income
- $50,119
- Rent vs Own
- Severe rent burden
- 969.0
Population outlook (Harris County) Hauer SSP2
- Today (2025)
- 5,571,493 people
- By 2030
- 6,089,821 · +9.3%
- By 2040
- 7,142,806 · +28.2%
- By 2050
- 8,185,864 · +46.9%
- By 2075
- 10,574,329 · +89.8%
- By 2100
- 12,109,958 · +117.4%
Race, ethnicity, and origin ACS 2023
- Neighborhood character
- Predominantly Hispanic (69%)
- Race & ethnicity
- Hispanic / Latino 69% Black 24% Two or more races 22% White 5% Asian 1%
- Hispanic origin (detail)
- Mexican 60%
- Common ancestry
- Swiss 1%
- Foreign-born
- 23% · Canada
- Languages at home
- 39% English-only · Spanish 59% Other Indo-European 1%
Political lean MEDSL · Harris
- 2024 margin
- Lean D (+5.5) · D 52.0% · R 46.4% · Other 1.6%
- 2008→2024 swing
- +3.9pp toward D · 2008: 1.6pp · 2024: 5.5pp
- All cycles
- 2024: D+5.5 2020: D+13.3 2016: D+12.4 2012: D+0.1 2008: D+1.6
Not yet ingested
- Civics
- —
Market trends
- HPI YoY
- ▲ 55.64%
- Current HPI
- 246.5578
- Rent YoY
- ▲ 4.27%
- Metro
- Houston-The Woodlands-Sugar Land, TX
- State GDP YoY
- ▲ 3.95%
- F500 in state
- 110
Industry mix (Fortune 500 HQ in TX)
| Industry | F500 HQs | Revenue |
|---|---|---|
| Energy | 16 | $1,198B |
|
||
| Technology | 5 | $198B |
|
||
| Engineering / Construction | 4 | $72B |
|
||
| Energy Services | 3 | $60B |
|
||
| Utilities | 3 | $41B |
|
||
| Healthcare | 2 | $330B |
|
||
Price history
+206.8% since first listed73 events — show timeline
- 2026-04-29 Listing Removed — HARMLS
- 2026-04-29 Listed $174,900 HARMLS
- 2025-12-15 Price Changed $179,900 HARMLS
- 2025-09-26 Listed $189,900 HARMLS
- 2025-09-04 Listing Removed — HARMLS
- 2025-09-04 Listed $189,900 HARMLS
- 2025-09-03 Listing Removed — HARMLS
- 2025-08-22 Listed $189,900 HARMLS
- 2025-08-20 Pending — HARMLS
- 2025-08-20 Listing Removed — HARMLS
- 2025-08-08 Price Changed $189,900 HARMLS
- 2025-07-02 Price Changed $199,900 HARMLS
- 2025-06-08 Price Changed $239,900 HARMLS
- 2025-04-17 Listed $249,900 HARMLS
- 2025-03-02 Listing Removed — HARMLS
- 2025-02-09 Listed $179,900 HARMLS
- 2024-12-24 Listing Removed — HARMLS
- 2024-10-09 Listing Removed — HARMLS
- 2024-10-09 Listed $179,500 HARMLS
- 2024-07-21 Price Changed $199,995 HARMLS
- 2024-04-24 Price Changed $219,995 HARMLS
- 2024-04-11 Price Changed $224,995 HARMLS
- 2024-03-30 Price Changed $229,995 HARMLS
- 2024-03-24 Price Changed $234,995 HARMLS
- 2024-03-16 Price Changed $243,999 HARMLS
- 2024-03-07 Listed $249,000 HARMLS
- 2024-02-15 Listing Removed — HARMLS
- 2024-02-14 Relisted — HARMLS
- 2024-02-08 Pending — HARMLS
- 2023-12-28 Price Changed $232,400 HARMLS
- 2023-12-20 Price Changed $242,400 HARMLS
- 2023-12-04 Listing Removed — HARMLS
- 2023-12-04 Listed $244,900 HARMLS
- 2023-11-25 Price Changed $244,900 HARMLS
- 2023-11-16 Price Changed $249,900 HARMLS
- 2023-10-16 Price Changed $254,900 HARMLS
- 2023-09-08 Listing Removed — HARMLS
- 2023-09-08 Listed $264,900 HARMLS
- 2023-08-12 Price Changed $264,900 HARMLS
- 2023-08-05 Price Changed $269,900 HARMLS
- 2023-07-27 Price Changed $274,900 HARMLS
- 2023-06-29 Listing Removed — HARMLS
- 2023-06-29 Listed $295,000 HARMLS
- 2023-05-25 Price Changed $295,000 HARMLS
- 2023-04-20 Listing Removed — HARMLS
- 2023-04-20 Listed $279,900 HARMLS
- 2023-03-14 Price Changed $280,000 HARMLS
- 2023-03-08 Price Changed $285,000 HARMLS
- 2022-12-09 Listed $290,000 HARMLS
- 2017-05-09 Sold (Public Records) — Public Records
- 2017-05-08 Sold (MLS) — HARMLS
- 2017-05-02 Pending — HARMLS
- 2017-04-19 Pending — HARMLS
- 2017-04-10 Price Changed $139,000 HARMLS
- 2017-04-10 Relisted — HARMLS
- 2017-04-06 Listing Removed — HARMLS
- 2017-02-23 Relisted — HARMLS
- 2017-02-21 Pending — HARMLS
- 2017-02-14 Pending — HARMLS
- 2016-12-25 Relisted — HARMLS
- 2016-12-21 Pending — HARMLS
- 2016-12-20 Pending — HARMLS
- 2016-10-06 Price Changed $174,995 HARMLS
- 2016-06-22 Listed $189,995 HARMLS
- 2012-11-05 Sold (Public Records) — Public Records
- 2012-11-02 Sold (MLS) — HARMLS
- 2012-10-16 Listing Removed — HARMLS
- 2012-05-22 Listed $9,000 HARMLS
- 2010-12-24 Listing Removed — HARMLS
- 2008-12-23 Listed $19,000 HARMLS
- 2005-06-06 Listing Removed — HARMLS
- 2004-10-28 Listed $57,000 HARMLS
- 1995-06-05 Sold (Public Records) — Public Records
Property tax history
+17.1%/yrLatest (2025): $4,790 · -12.6% YoY. Source: county tax records.
Cash-flow waterfall
monthlySold comps — $/sqft
last 12 mo · ≤1 miLoading sold comps…