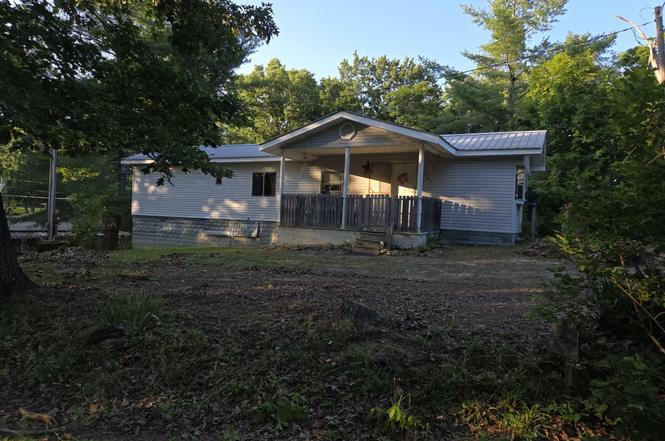
103 Cox Rd · Irvine, KY
Flood risk No data
- FEMA flood zone
- —
- Chance of flooding over 30 yrs
- —
- Est. flood insurance / yr
- —
Fire risk No data
- Est. fire insurance / yr
- —
Heat risk No data
- Hot days now (above threshold)
- —
- Hot days in 30 yrs
- —
Wind risk No data
- Chance of severe wind over 30 yrs
- —
Air-quality risk No data
- Unhealthy air days now
- —
- Unhealthy air days in 30 yrs
- —
Risk factors via First Street. Map © Google.
Why this score? — see what drove the C- grade
The composite is a weighted blend of 9 inputs, each scored 0–100. Each bar is that input's sub-score; the figure is the points it added to the 100-point composite (weight × sub-score).
- Cash flow +21.0/30.0
- ARV discount +7.5/15.0
- DSCR +6.7/10.0
- 1% rule +5.5/10.0
- Livability +3.2/5.0
- Rent growth +2.5/5.0
- Condition / age +2.2/5.0
- Schools +2.1/10.0
- Appreciation +0.0/10.0
$74,900
🖨 Deal sheet (PDF) 📄 Offer letter ✓ Due diligence
Key facts
- 0.75 acre lot
- Built 1981
- Listed 3 days
Property features AI
Exterior
- Utilities: Public water; No sewer service
- Home design: Manufactured home; Single-story
- Construction: Vinyl siding; 720 total building area
- Exterior features: Pillar/post/pier foundation
Interior
- Bedrooms: 2 total rooms
- Flooring: Carpet; Vinyl
- Bathrooms: 1 full bathroom
- Heating & cooling: Electric forced air heating; Window air conditioning units
- Interior features: Carpet and vinyl flooring; No fireplace
Neighborhood map
What this means for you Summary
Snapshot
- This is a 2-bed/1.0-bath single-family listed at $75k. Condition is rated fair.
Deal economics
- At list price, monthly cash flow is $105 ($1k/yr) — positive.
- The deal already cash-flows at list — no discount required.
- Meets the 1% rule at list price ($789 rent vs $75k).
Location & tenants
- Location reads 65/100 on livability (#254 in KY) — a middle-class / working-renter tenant base. Strengths: crime A+, cost of living A+, housing A+; Watch: health & safety D+, amenities F, commute F.
- Estill County (rural): math 19% / reading 33% proficiency, ranked #146 of 165 in KY (top 88%) — low school quality limits family demand, transient renter base, plan for 1-2y turnover.
- Zoned schools: West Irvine Elementary (math 20% / reading 31%, grade F, #477 of 676 statewide, top 71%, 468 students, 69% FRL); Estill County Middle School (math 17% / reading 34%, grade F, #181 of 217 statewide, top 84%, 446 students, 70% FRL); Estill County High School (math 22% / reading 37%, grade F, #127 of 254 statewide, top 58%, 644 students, 61% FRL).
- Market conditions: 120 active listings in the ZIP.
Forward outlook
- Local home prices are declining (-3.0%/yr); year-one equity from $518 of loan paydown is wiped out by about $2k of value loss. Plan a longer hold.
- Estill County population projected at -20% by 2050 — secular population decline; favor cash flow + early exit over multi-decade hold.
Negotiation context
- Only 4 days on market — expect competitive offers; lowballing is unlikely to land.
Questions for the listing agent
- Have any recent inspections been done? Can we get a copy of the seller's disclosures and any deferred-maintenance estimates?
- Is there a deadline driving the sale (1031 exchange, divorce, estate, relocation)? That informs how much negotiation room exists.
- Schools are F-rated, which usually means shorter tenancies and higher turnover. Who's the typical renter profile here, and what's been the actual vacancy rate?
- What's the average days-on-market for RENTAL listings here right now (not sales)? A rising rental-DOM trend means longer vacancies and softer asking-rent achievability than the comps imply.
- What's the recent tenant-quality profile in this submarket — average credit score on applications, eviction rate, late-payment / NSF rate, and stable-employment percentage? A property-management company in the area should have these aggregated.
- How much new for-sale + rental construction is in the pipeline within 1–3 miles? Heavy new supply typically softens prices + rents 12–24 months out; constrained supply supports both.
Investment metrics
- 1% rule
- 1.05% ✓
- Cap rate
- 7.98%
- Cash-on-cash
- 6.03%
- DSCR
- 1.27
- GRM
- 7.9
CMA / ARV
No comps found within radius.
Projected returns pro-forma
-3.0% appreciation · 3.0% rent growth · sell at horizon
- IRR
- -7.0%
- Equity multiple
- 0.74×
- Total profit
- $-5,417
- Equity at exit
- $11,168
- IRR
- 2.6%
- Equity multiple
- 1.19×
- Total profit
- $3,970
- Equity at exit
- $6,476
Cash invested: $20,972 (down + closing). Projections, not guarantees.
Landlord ↔ Tenant lean methodology
- Overall (STATE)
- 83 Strongly Landlord-Friendly
- State Kentucky
- 83 Strongly Landlord-Friendly · R+16
- County
- — inherits STATE
- City
- — inherits STATE
ZIP-level market 40336
- Home prices YoY
- -10.5%
- Active inventory
- 120
- Price-to-rent
- 7.9×
Monthly cashflow live
- Estimated rent
- $789 medium interval (Pro) →
- Mortgage (P&I)
- −$393
- Tax est. 1.5%
- −$94 /mo · $1,124/yr
- Insurance
- −$31
- HOA
- −$0
- Vacancy / Maint / Mgmt
- −$166
- Net cashflow
- $105
Break-even live
Sensitivity live
| Price | -10% $157 | -5% $131 | +0% $105 | +5% $79 | +10% $54 |
|---|---|---|---|---|---|
| Rent | -10% $43 | -5% $74 | +0% $105 | +5% $136 | +10% $168 |
| Rate | -1.0pp $143 | -0.5pp $124 | base $105 | +0.5pp $86 | +1.0pp $66 |
UW: 25.0% down · 7.5% · 30yr · 1.5% tax · 5.0% vac · 8.0% maint · 8.0% mgmt
Financing live
Cash to close
- Down payment
- $18,725
- Closing costs
- $2,247
- Reserves months
- —
- Total cash needed
- —
Loan-product check · same deal, 3 products live
Conventional
25% down · 7.5% · 30yr
- Down + closing
- —
- Monthly P&I
- —
- Monthly cashflow
- —
- DSCR
- —
- Eligible?
- —
Personal DTI + credit; lowest rate.
DSCR
20% down · 8.5% · 30yr
- Down + closing
- —
- Monthly P&I
- —
- Monthly cashflow
- —
- DSCR
- —
- Eligible?
- —
No personal income docs; deal must DSCR.
Hard money
10% down · 12.0% · 12mo
- Down + closing
- —
- Monthly P&I
- —
- Monthly cashflow
- —
- DSCR
- —
- Eligible?
- —
Short-term bridge; refi at stabilization.
Listing history 4 events
-
2026-06-19days on market $74,900 Active 4 DOM
-
2026-06-18days on market $74,900 Active 3 DOM
-
2026-06-17days on market $74,900 Active 2 DOM
-
2026-06-15$74,900 Active 1 DOM
ⓘ Source: listings_history table (triggers on properties + properties_extension) + one-shot
backfill from property_details.listing_events for pre-trigger history.
Nearby sold comps map
Loading sold comps map…
Walkable amenities ~0.75 mi
Loading nearby amenities…
Taxation est. · year 1
- Rental income
- $9,462
- − Mortgage interest
- −$4,196
- − Property taxes
- −$1,124
- − Insurance
- −$374
- − Repairs & maintenance
- −$757
- − Management
- −$757
- − Depreciation
- −$2,179
- Taxable income
- $76
- Est. tax owed @ 24.0%
- −$18
- After-tax cash flow
- $1,246/yr
For passive investors: Depreciation is non-cash, so a rental often shows a tax loss while cash-flowing — sheltering income. Rental losses are passive: they offset passive income freely, and up to $25,000/yr can offset ordinary (W-2) income if you actively participate and your MAGI is under $100k (phasing out to $0 by $150k); unused losses carry forward. On sale, claimed depreciation is recaptured at up to 25%, and gains may owe capital-gains tax (a 1031 exchange can defer both). Figures are a year-1 estimate at your 24.0% rate — not tax advice; consult a CPA.
Condition & rehab AI · 12 photos
The home requires moderate renovations, including landscaping, exterior updates, and kitchen improvements, to increase its value.
Repairs flagged
- Major Landscaping — Overgrown vegetation and debris
- Moderate Exterior siding — Weathered siding
- Minor Kitchen appliances — Outdated and cluttered
Value-add opportunities
- Resale Paint interior walls — Fresh paint enhances curb appeal
- Resale Replace windows — New windows improve energy efficiency and appearance
- Both Replace kitchen appliances — Modern appliances increase both resale and rental value
Renovation cost estimate screening
| Repair item | Severity | Est. cost |
|---|---|---|
| Landscaping · Overgrown vegetation and debris | Major | $15,000–50,000 |
| Exterior siding · Weathered siding | Moderate | $3,000–15,000 |
| Kitchen appliances · Outdated and cluttered | Minor | $500–3,000 |
| Total estimated repair cost · 3 items | $18,500–68,000 |
Value-add ROI direction
- Resale Paint interior walls — Fresh paint enhances curb appeal ↑
- Resale Replace windows — New windows improve energy efficiency and appearance ↑
- Both Replace kitchen appliances — Modern appliances increase both resale and rental value ↑
ⓘ Cost ranges are severity-bucket heuristics (US national rule-of-thumb). Get contractor quotes + a written scope before underwriting a rehab budget.
Schools (NCES district)
- District
- Estill County
- NCES district ID
- 2101760
- Math proficiency
- 19% ▼ -24.00%
- Reading proficiency
- 33% ▼ -13.00%
- Median HH income
- $29,324
- Composite
- 20.86/100
- National rank
- #8498
- State rank
- #146 of 165 in KY
Livability — Irvine
- Score
- 65/100
- State rank
- #254
- US rank
- #12740
Category grades
Schools grade is shown separately in the Schools card above.
Census & demographics
- Population (ZIP)
- 12,650
Population outlook (Estill County) Hauer SSP2
- Today (2025)
- 13,588 people
- By 2030
- 13,086 · -3.7%
- By 2040
- 12,012 · -11.6%
- By 2050
- 10,928 · -19.6%
- By 2075
- 8,646 · -36.4%
- By 2100
- 6,689 · -50.8%
Race, ethnicity, and origin ACS 2023
- Neighborhood character
- Predominantly White (96%)
- Race & ethnicity
- White 96% Two or more races 3% Asian 1% Hispanic / Latino 1%
- Common ancestry
- Serbian 2% Slovak 1% Italian 1%
- Foreign-born
- 2% · Canada, China
- Languages at home
- 98% English-only · Spanish 1% Chinese 1%
Political lean MEDSL · Estill
- 2024 margin
- Solid R (+63.2) · D 17.7% · R 81.0% · Other 1.3%
- 2008→2024 swing
- -23.1pp toward R · 2008: -40.1pp · 2024: -63.2pp
- All cycles
- 2024: R+63.2 2020: R+57.3 2016: R+56.5 2012: R+46.2 2008: R+40.1
Not yet ingested
- Civics
- —
Market trends
- HPI YoY
- ▼ -25.66%
- Current HPI
- 219.2756
- Rent YoY
- —
- Metro
- —
- State GDP YoY
- ▲ 1.81%
- F500 in state
- 4
Industry mix (Fortune 500 HQ in KY)
| Industry | F500 HQs | Revenue |
|---|---|---|
| Healthcare | 1 | $118B |
|
||
| Food / Beverage | 1 | $7B |
|
||
Price history
1 event — show timeline
- 2026-06-12 Listed $74,900 ImagineMLS
Cash-flow waterfall
monthlySold comps — $/sqft
last 12 mo · ≤1 miLoading sold comps…