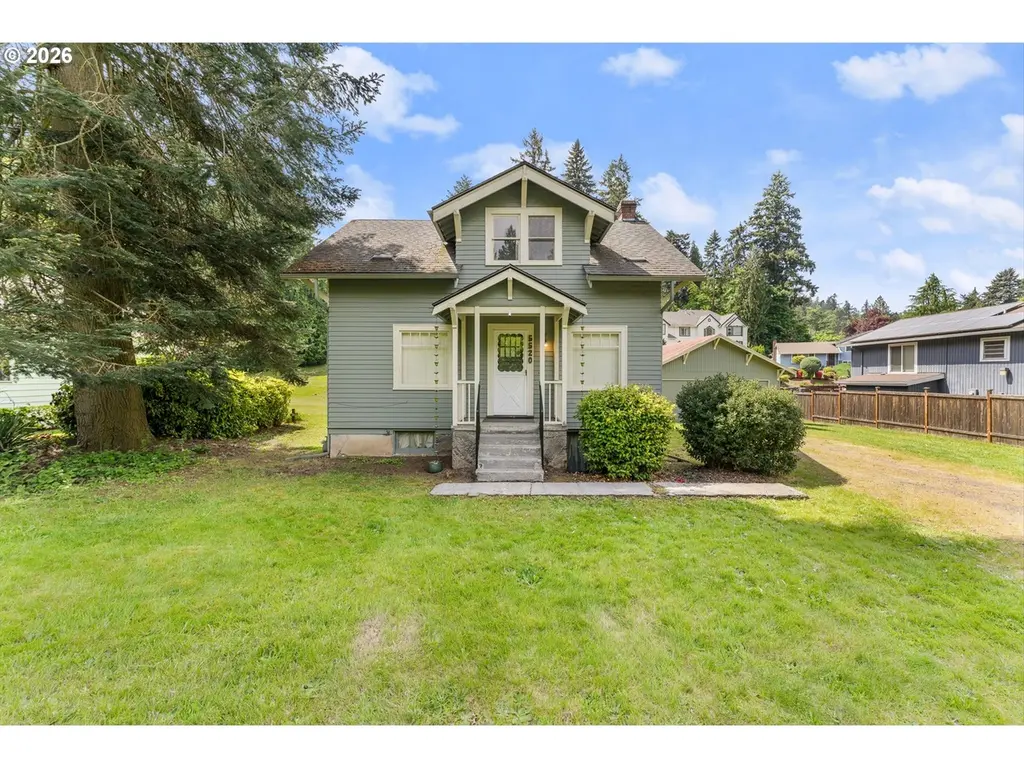
5520 SE Aldercrest Rd · Oatfield, OR
Flood risk 1/10 · Minimal
- FEMA flood zone
- X (unshaded)
- Chance of flooding over 30 yrs
- 0.0%
- Est. flood insurance / yr
- $473 – $860
Fire risk 1/10 · Minimal
- Est. fire insurance / yr
- $498 – $926
Heat risk 3/10 · Minor
- Hot days now (above 94°F)
- 7 days/yr
- Hot days in 30 yrs
- 14 days/yr
Wind risk 1/10 · Minimal
- Chance of severe wind over 30 yrs
- —
Air-quality risk 10/10 · Severe
- Unhealthy air days now
- 18 days/yr
- Unhealthy air days in 30 yrs
- 20 days/yr
Risk factors via First Street. Map © Google.
Why this score? — see what drove the D grade
The composite is a weighted blend of 9 inputs, each scored 0–100. Each bar is that input's sub-score; the figure is the points it added to the 100-point composite (weight × sub-score).
- ARV discount +15.0/15.0
- Cash flow +9.3/30.0
- Livability +4.0/5.0
- Schools +3.2/10.0
- DSCR +2.6/10.0
- Condition / age +2.5/5.0
- Rent growth +2.3/5.0
- 1% rule +2.2/10.0
- Appreciation +0.0/10.0
$374,900
🖨 Deal sheet 📄 Offer letter ✓ Due diligence
Listing remarks
Charming Craftsman style bungalow in the desirable Milwaukie Heights neighborhood! Step onto the main level and into a spacious living room featuring beautiful hardwood floors and abundant natural light. This home retains its original character with a custom kitchen showcasing solid built in cabinetry and a bright, inviting eating nook. The primary bedroom and full bathroom are conveniently located on the main floor. Upstairs, you’ll find a versatile second living area perfect for a home office, study space, media room, or hobby area, along with two additional bedrooms. The lower level offers a large basement with separate laundry area and ample square footage, ideal for a workshop, s
Key facts
- Custom kitchen
- Hardwood floors
- Built in cabinetry
Tags
Property features AI
Finance
- HOA & community: Not a senior community
Exterior
- Parking: Driveway; RV parking; Detached 2-car garage; Total parking for 2 vehicles
- Utilities: Public water; Public sewer; Gas fuel; Electric water heater
- Home design: Single-family residence; Residential property; Resale home; No notable view
- Construction: Built in 1925; Block foundation; Composition roof
- Exterior features: Deck; RV parking; Workshop with exterior entry; Yard; Wood siding; Paved road access; Level lot
Interior
- Kitchen: Free-standing range
- Bedrooms: Primary bedroom on main level with closet; Second bedroom on upper level with closet and wall-to-wall carpet; Third bedroom on upper level with closet and wall-to-wall carpet
- Flooring: Concrete; Hardwood; Vinyl; Wall-to-wall carpet
- Bathrooms: One full bathroom (located on main level)
- Heating & cooling: Forced air heating; No central air
- Interior features: Concrete floors; Hardwood floors; High ceilings; Laundry area; Vinyl flooring; Wall-to-wall carpet; Washer and dryer included; Wood window frames; Unfinished basement
- Laundry & utility: Washer and dryer included; Utility room on lower level
Neighborhood map
What this means for you Summary
Snapshot
- This is a 3-bed/1.0-bath single-family listed at $375k.
Deal economics
- At list price, monthly cash flow is $-276 ($-3k/yr) — negative.
- To cash-flow at today's rent, offer at most $326k (13.0% below list).
- To meet the 1% rule (rent ≥ 1% of price), the offer needs to be $270k (28.0% below list).
- Recommended offer: $270k (28.0% below list) — sets the bar for 1% rule.
- Cap rate 5.4% vs local median 2.6% in Oatfield — top-decile yield for the area; either an underpriced asset or a hidden risk that comps aren't pricing in. Stress-test before assuming the spread holds.
Location & tenants
- Location reads 81/100 on livability (#49 in OR, #1,363 nationally) — a professional / high-income tenant draw. Strengths: commute A+, employment A+, housing A+; Watch: amenities D, cost of living F.
- North Clackamas SD 12 (suburban): math 29% / reading 43% proficiency, ranked #22 of 58 in OR (top 38%) — families likely to look elsewhere, expect single-tenant / working-renter base with shorter leases.
- Zoned schools: View Acres Elementary School (math 24% / reading 44%, grade F, #218 of 412 statewide, top 58%, 378 students, 32% FRL); Alder Creek Middle School (math 13% / reading 36%, grade F, #108 of 128 statewide, top 89%, 846 students, 49% FRL); Putnam High School (math 34% / reading 74%, grade C-, #30 of 143 statewide, top 20%, 1,106 students, 38% FRL).
- Market conditions: Rents soft (-0.8%/yr); 139 active listings in the ZIP; 7 comparable units currently listed for rent nearby; rentals at typical pace (median 17d on market — plan ~3-4 weeks tenant-placement turnaround); solid renter incomes; 946 units permitted in Clackamas County in 2024 (188 in 5+ unit buildings).
- This rent runs 39% of the median local income ($83k/yr) — at the standard rent-burdened threshold; future hikes will face affordability resistance.
Forward outlook
- Local home prices are declining (-3.0%/yr); year-one equity from $3k of loan paydown is wiped out by about $11k of value loss. Plan a longer hold.
- Clackamas County population projected at +25% by 2050 — long-run rental-demand tailwind backs the buy-and-hold thesis.
Negotiation context
- Only 12 days on market — expect competitive offers; lowballing is unlikely to land.
- 2 sale attempts with the ask held roughly flat each time — persistent listings suggest the price (not the market) is what's stuck; bring a comps-based counter.
Risks & watch-outs
- Watch-outs: built in 1925 — expect roof / HVAC / electrical / plumbing capex.
Questions for the listing agent
- What do current leases actually rent for vs. the listed asking? Can we see a recent rent roll and the last 12 months of T-12 income?
- Built in 1925 — when were the roof, HVAC, electrical panel, plumbing, and water heater last replaced?
- Is there a deadline driving the sale (1031 exchange, divorce, estate, relocation)? That informs how much negotiation room exists.
- The area grade is low — what's the realistic commute time and amenity access for the typical tenant pool here? Any planned neighborhood developments (good or bad) we should know about?
- What's the average days-on-market for RENTAL listings here right now (not sales)? A rising rental-DOM trend means longer vacancies and softer asking-rent achievability than the comps imply.
- What's the recent tenant-quality profile in this submarket — average credit score on applications, eviction rate, late-payment / NSF rate, and stable-employment percentage? A property-management company in the area should have these aggregated.
- How much new for-sale + rental construction is in the pipeline within 1–3 miles? Heavy new supply typically softens prices + rents 12–24 months out; constrained supply supports both.
Investment metrics
- 1% rule
- 0.72% ✗
- Cap rate
- 5.41%
- Cash-on-cash
- -3.15%
- DSCR
- 0.86
- GRM
- 11.6
CMA / ARV
- ARV (median comp)
- $566,114
- List price
- $374,900
- Delta
- -33.78%
- Verdict
- UNDERPRICED
- Comps
- 20 within 1.0 mi
Show comp detail 12 sales within ~0.75 mi
| Address | Dist | Beds/Ba | Sqft | Sold | Price | $/sf | Match |
|---|---|---|---|---|---|---|---|
| 5420 SE Aldercrest Rd | 0.11mi | 3/3.0 | 1,768 (-7%) | 1mo | $549,900 | $311 | 75 |
| 4510 SE Pinehurst Ave | 0.54mi | 3/2.0 | 2,020 (+7%) | 1mo | $610,000 | $302 | 59 |
| 6101 SE Parmenter Ct | 0.22mi | 3/2.0 | 2,146 (+13%) | 6mo | $770,400 | $359 | 58 |
| 13945 SE Piper Cub Way | 0.56mi | 3/3.0 | 1,816 (-4%) | 1mo | $607,300 | $334 | 58 |
| 5332 SE EL Centro Way | 0.44mi | 3/2.0 | 2,052 (+8%) | 8mo | $450,000 | $219 | 55 |
| 14792 SE Gayle Ct | 0.54mi | 3/2.0 | 1,704 (-10%) | 6mo | $555,000 | $326 | 49 |
| 15081 SE Mount Royale Ct | 0.56mi | 4/3.0 (+1) | 1,829 (-4%) | 8mo | $543,900 | $297 | 48 |
| 5189 SE LA Mesa Way | 0.47mi | 3/2.0 | 2,152 (+14%) | 5mo | $610,000 | $283 | 47 |
| 4408 SE View Acres Rd | 0.72mi | 4/3.0 (+1) | 2,037 (+8%) | 4mo | $573,000 | $281 | 38 |
| 6335 SE Molt St | 0.67mi | 3/3.0 | 1,644 (-13%) | 1mo | $590,000 | $359 | 38 |
| 14568 SE Kingston Ave | 0.56mi | 4/3.0 (+1) | 2,135 (+13%) | 3mo | $645,000 | $302 | 37 |
| 15158 SE LA Marquita Way | 0.70mi | 4/3.0 (+1) | 2,095 (+11%) | 3mo | $650,000 | $310 | 34 |
Match score weights: distance 35% · size 25% · config 20% · recency 20%. Top-matched comps best support the ARV.
Projected returns pro-forma
-3.0% appreciation · 0.0% rent growth · sell at horizon
- IRR
- -24.7%
- Equity multiple
- 0.18×
- Total profit
- $-86,310
- Equity at exit
- $55,899
- IRR
- -31.5%
- Equity multiple
- -0.23×
- Total profit
- $-128,662
- Equity at exit
- $32,415
Cash invested: $104,972 (down + closing). Projections, not guarantees.
Landlord ↔ Tenant lean methodology
- Overall (STATE)
- 28 Tenant-Leaning
- State Oregon
- 28 Tenant-Leaning · D+6
- County
- — inherits STATE
- City
- — inherits STATE
ZIP-level market 97222
- Rents YoY
- -0.8%
- Active inventory
- 139
- Price-to-rent
- 11.6×
Monthly cashflow live
- Estimated rent
- $2,701 high interval (Pro) →
- Mortgage (P&I)
- −$1,966
- Tax from tax record
- −$287 /mo · $3,446/yr
- Insurance
- −$156
- HOA
- −$0
- Vacancy / Maint / Mgmt
- −$567
- Net cashflow
- $-276
Break-even live
UW: 25.0% down · 7.5% · 30yr · 1.5% tax · 5.0% vac · 8.0% maint · 8.0% mgmt
Financing live
Cash to close
- Down payment
- $93,725
- Closing costs
- $11,247
- Reserves months
- —
- Total cash needed
- —
Loan-product check · same deal, 3 products live
Conventional
25% down · 7.5% · 30yr
- Down + closing
- —
- Monthly P&I
- —
- Monthly cashflow
- —
- DSCR
- —
- Eligible?
- —
Personal DTI + credit; lowest rate.
DSCR
20% down · 8.5% · 30yr
- Down + closing
- —
- Monthly P&I
- —
- Monthly cashflow
- —
- DSCR
- —
- Eligible?
- —
No personal income docs; deal must DSCR.
Hard money
10% down · 12.0% · 12mo
- Down + closing
- —
- Monthly P&I
- —
- Monthly cashflow
- —
- DSCR
- —
- Eligible?
- —
Short-term bridge; refi at stabilization.
Rent comps 7 comps
| Address | Beds | Baths | Sqft | Rent | $/sqft | DOM | Units | Dist |
|---|---|---|---|---|---|---|---|---|
| 6455 SE Quail Park Ln Portland, OR | 3.0 | 2.5 | 1556 | $3,249 | $2.09 | 1d | 2 | 0.52mi |
| 6170 SE Lake Rd Portland, OR | 2.0 | 2.5 | 1381 | $2,250 | $1.63 | 7d | 1 | 0.61mi |
| 6593 SE Thiessen Rd Portland, OR | 4.0 | 2.0 | 1791 | $3,100 | $1.73 | 1d | 1 | 0.62mi |
| 15607 SE Meadowlark Ln Portland, OR | 3.0 | 2.5 | 1336 | $2,695 | $2.02 | 21d | 1 | 0.95mi |
| 6420 SE Mabel Ave Portland, OR | 3.0 | 2.5 | 2044 | $3,250 | $1.59 | 21d | 1 | 0.99mi |
| 13822 SE Oatfield Rd Unit 3C Milwaukie, OR | 3.0 | 2.5 | 1385 | $2,595 | $1.87 | 17d | 1 | 1.15mi |
| 3312 SE Concord Rd Unit A Milwaukie, OR | 3.0 | 2.0 | 1650 | $2,395 | $1.45 | 17d | 1 | 1.46mi |
Listing history 5 events
-
2026-06-16status $374,900 Pending 12 DOM
-
2026-06-15days on market $374,900 Active 12 DOM
-
2026-06-13days on market $374,900 Active 10 DOM
-
2026-06-10status $374,900 Active 6 DOM
-
2026-05-14$374,900 Active 1486-char remark
ⓘ Source: listings_history table (triggers on properties + properties_extension) + one-shot
backfill from property_details.listing_events for pre-trigger history.
Tax reassessment forecast OR · Resets to sale price
- Current annual tax
- $3,446 · $287/mo
- Projected year-2 tax
- $3,637 · $303/mo
- Expected delta
- +$190/yr (+$16/mo · 5.5%)
ⓘ Screening estimate from a state-policy table — verify with the county assessor before closing.
Climate risk First Street
- Flood 1/10 Low FEMA zone X (unshaded) · 0% chance over 30 yrs
- Wildfire 1/10 Low
- Heat 3/10 Moderate 7 d/yr ≥94°F today · 14 d/yr by 30 yrs out
- Wind 1/10 Low
- Air quality 10/10 Extreme 18 unhealthy d/yr today · 20 by 30 yrs out
Nearby sold comps map
Loading sold comps map…
Walkable amenities ~0.75 mi
Loading nearby amenities…
Taxation est. · year 1
- Rental income
- $32,407
- − Mortgage interest
- −$21,000
- − Property taxes
- −$3,446
- − Insurance
- −$1,874
- − Repairs & maintenance
- −$2,593
- − Management
- −$2,593
- − Depreciation
- −$10,906
- Taxable loss
- −$10,005
- Est. tax savings @ 24.0%
- +$2,401
- After-tax cash flow
- $-910/yr
For passive investors: Depreciation is non-cash, so a rental often shows a tax loss while cash-flowing — sheltering income. Rental losses are passive: they offset passive income freely, and up to $25,000/yr can offset ordinary (W-2) income if you actively participate and your MAGI is under $100k (phasing out to $0 by $150k); unused losses carry forward. On sale, claimed depreciation is recaptured at up to 25%, and gains may owe capital-gains tax (a 1031 exchange can defer both). Figures are a year-1 estimate at your 24.0% rate — not tax advice; consult a CPA.
Schools (NCES district)
- District
- North Clackamas SD 12
- NCES district ID
- 4108830
- Math proficiency
- 29% ▼ -14.00%
- Reading proficiency
- 43% ▼ -13.00%
- Median HH income
- $60,217
- Composite
- 32.1/100
- National rank
- #5807
- State rank
- #22 of 58 in OR
Livability — Oatfield
- Score
- 81/100
- State rank
- #49
- US rank
- #1363
Category grades
Schools grade is shown separately in the Schools card above.
Census & demographics
- Census place
- Oatfield, OR
- County
- Clackamas County · 361,406 people
- City population
- 31,160
- Metro
- Portland-Vancouver-Hillsboro, OR-WA
- Population (ZIP)
- 36,398
- Household income
- $83,119
- Rent vs Own
- Severe rent burden
- 1823.0
Population outlook (Clackamas County) Hauer SSP2
- Today (2025)
- 458,456 people
- By 2030
- 485,185 · +5.8%
- By 2040
- 532,932 · +16.2%
- By 2050
- 574,445 · +25.3%
- By 2075
- 665,497 · +45.2%
- By 2100
- 697,488 · +52.1%
Race, ethnicity, and origin ACS 2023
- Neighborhood character
- Predominantly White (75%)
- Race & ethnicity
- White 75% Hispanic / Latino 13% Two or more races 12% Asian 3% Black 1%
- Hispanic origin (detail)
- Mexican 8% Puerto Rican 1%
- Common ancestry
- Slovak 3% Italian 3% Portuguese 3%
- Foreign-born
- 7% · Canada
- Languages at home
- 89% English-only · Spanish 6% Russian/Polish/Slavic 2% Arabic 1%
Political lean MEDSL · Clackamas
- 2024 margin
- Lean D (+9.7) · D 53.4% · R 43.6% · Other 3.0%
- 2008→2024 swing
- -0.6pp no change · 2008: 10.4pp · 2024: 9.7pp
- All cycles
- 2024: D+9.7 2020: D+11.1 2016: D+6.1 2012: D+3.5 2008: D+10.4
Not yet ingested
- Civics
- —
Market trends
- HPI YoY
- ▼ -447.07%
- Current HPI
- 306.8458
- Rent YoY
- ▼ -0.82%
- Metro
- Portland-Vancouver-Hillsboro, OR-WA
- State GDP YoY
- ▲ 2.05%
- F500 in state
- 2
Industry mix (Fortune 500 HQ in OR)
| Industry | F500 HQs | Revenue |
|---|---|---|
| Consumer Goods | 1 | $51B |
|
||
Price history
4 events — show timeline
- 2026-06-15 Pending — RMLS
- 2026-06-09 Relisted — RMLS
- 2026-05-21 Pending — RMLS
- 2026-05-14 Listed $374,900 RMLS
Property tax history
+3.8%/yrLatest (2025): $3,446 · +3.7% YoY. Source: county tax records.
Cash-flow waterfall
monthlySold comps — $/sqft
last 12 mo · ≤1 miLoading sold comps…