 🏢 Co-op
529 E 12th St Unit C5 · New York, NY
Flood risk 1/10 · Minimal
- FEMA flood zone
- X (unshaded)
- Chance of flooding over 30 yrs
- 0.0%
- Est. flood insurance / yr
- $507 – $1,088
Fire risk 1/10 · Minimal
- Est. fire insurance / yr
- $691 – $1,283
Heat risk 6/10 · Moderate
- Hot days now (above 99°F)
- 7 days/yr
- Hot days in 30 yrs
- 15 days/yr
Wind risk 6/10 · Moderate
- Chance of severe wind over 30 yrs
- 27.0%
Air-quality risk 4/10 · Minor
- Unhealthy air days now
- 5 days/yr
- Unhealthy air days in 30 yrs
- 7 days/yr
Risk factors via First Street. Map © Google.
Why this score? — see what drove the B- grade
The composite is a weighted blend of 9 inputs, each scored 0–100. Each bar is that input's sub-score; the figure is the points it added to the 100-point composite (weight × sub-score).
- Cash flow +21.1/30.0
- Appreciation +10.0/10.0
- ARV discount +7.5/15.0
- DSCR +6.7/10.0
- 1% rule +5.6/10.0
- Schools +5.0/10.0
- Rent growth +4.4/5.0
- Livability +3.8/5.0
- Condition / age +2.2/5.0
$499,000
🖨 Deal sheet 📄 Offer letter ✓ Due diligence
Listing remarks
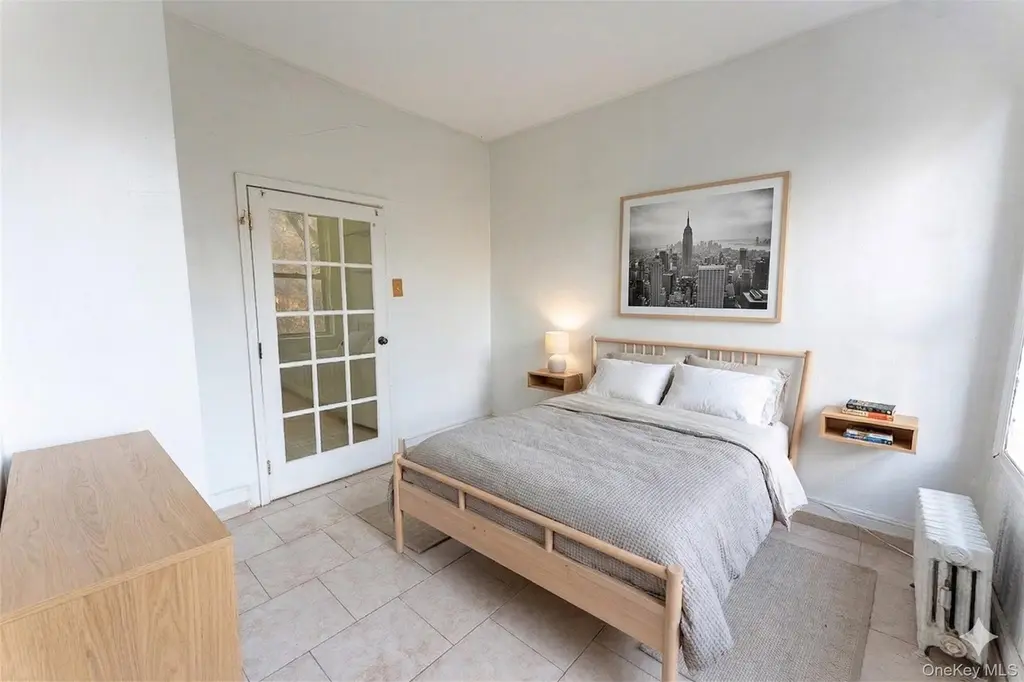
RENTING ALLOWED! Welcome to this charming two-bedroom, one-bathroom HDFC co-op apartment nestled in the heart of the highly sought-after East Village, near Tompkins Square Park, NYC. Situated on a quiet, tree-lined block, this home offers the perfect balance of peaceful living and vibrant city energy, with an eclectic mix of restaurants, bars, and community gardens right outside your door. Located on the third floor of a well-maintained pre-war walk-up building, the apartment features a functional layout with great natural light and endless potential. This is a great option for buyers to customize and create their ideal living space. Residents enjoy access to convenient amenities includi
Key facts
- Built 1901
- Listed 84 days
Property features AI
Exterior
- Parking: On-street parking
- Utilities: Public sewer; No utilities listed
- Home design: Stock cooperative
- Construction: Other construction materials; Other foundation details
- Exterior features: No waterfront
Interior
- Kitchen: Oven; Refrigerator
- Bedrooms: Entry level: 3
- Bathrooms: 1 full bathroom
- Heating & cooling: Wall/Window unit(s) cooling; Heating: see remarks
- Interior features: Walk-through kitchen; Pets allowed
Neighborhood map
What this means for you Summary
Snapshot
- This is a 2-bed/1.0-bath condo listed at $499k. Condition is rated fair.
Deal economics
- At list price, monthly cash flow is $712 ($9k/yr) — positive.
- The deal already cash-flows at list — no discount required.
- Meets the 1% rule at list price ($5k rent vs $499k).
- Recommended offer: $469k (6.0% below list) — sets the bar for market timing.
- Cap rate 8.0% vs local median 2.6% in New York — top-decile yield for the area; either an underpriced asset or a hidden risk that comps aren't pricing in. Stress-test before assuming the spread holds.
Location & tenants
- Location reads 75/100 on livability (#268 in NY, #4,188 nationally) — a middle-class / working-renter tenant base. Strengths: amenities A+, commute A+, health & safety A; Watch: crime F, cost of living F.
- Market conditions: Rents rising fast (+7.5%/yr); 87 active listings in the ZIP; 40 comparable units currently listed for rent nearby; rentals leasing fast (median 5d on market — plan ~1-2 weeks tenant-placement turnaround); solid renter incomes; 4,467 units permitted in New York County in 2024 (4,463 in 5+ unit buildings).
- At $5,267/mo this rent would consume 68% of the median local household income ($93k/yr) (locally 5275% of renters already pay >50% of income on rent) — very limited rent-growth headroom before tenants either downsize or default.
Forward outlook
- In year one you build about $53k of equity ($3k loan paydown + $50k appreciation (10.0% local appreciation)).
- New York County population projected at +21% by 2050 — long-run rental-demand tailwind backs the buy-and-hold thesis.
- At projected returns (10.0% appreciation + 7.5% rent growth), your $140k cash investment doubles in ~3 years — after that, you're playing with house money.
- By year 2, paydown + projected appreciation supports a ~$86k cash-out refi (75% LTV) — recoverable capital for the next deal without selling this one.
Negotiation context
- It's been on market 85 days — a 6% lower offer ($469k) is reasonable based on typical stale-listing flexibility.
Risks & watch-outs
- Watch-outs: built in 1901 — expect roof / HVAC / electrical / plumbing capex.
- Climate carrying-cost: major wind risk, 27% chance of damaging wind over 30y; extreme-heat days projected 7→15/yr by 2055 (HVAC capex compounding) — expect insurance premiums to compound above CPI over the hold.
Questions for the listing agent
- It's been on market 85 days. Have you received any prior offers? Is the seller open to a 6% concession, seller financing, or rate buy-down credit?
- Have any recent inspections been done? Can we get a copy of the seller's disclosures and any deferred-maintenance estimates?
- Built in 1901 — when were the roof, HVAC, electrical panel, plumbing, and water heater last replaced?
- Any open or pending special assessments — roof, HVAC, plumbing, elevator, façade? What's the per-unit balance and payoff schedule, and is the seller paying it off at close or rolling it to the buyer?
- Why hasn't it sold? Are there any deal-killer items the seller is aware of (foundation, flood, title, zoning, code violations)?
- Is there a deadline driving the sale (1031 exchange, divorce, estate, relocation)? That informs how much negotiation room exists.
- Schools are B-rated — typically a magnet for longer-tenancy family renters. What's the average tenant stay here, and is there a school-zone premium baked into asking?
- Crime grade is F in this area — have there been break-ins, vandalism, or insurance claims at this property in the last 3 years? What carrier currently insures it and at what premium?
- What's the average days-on-market for RENTAL listings here right now (not sales)? A rising rental-DOM trend means longer vacancies and softer asking-rent achievability than the comps imply.
- What's the recent tenant-quality profile in this submarket — average credit score on applications, eviction rate, late-payment / NSF rate, and stable-employment percentage? A property-management company in the area should have these aggregated.
- How much new apartment / multifamily construction is in the pipeline within 1–3 miles? Heavy new supply (>2% of stock underway) typically softens rents 12–24 months out; light construction supports rent growth.
Investment metrics
- 1% rule
- 1.06% ✓
- Cap rate
- 8.01%
- Cash-on-cash
- 6.12%
- DSCR
- 1.27
- GRM
- 7.9
CMA / ARV
No comps found within radius.
Projected returns pro-forma
10.0% appreciation · 7.48% rent growth · sell at horizon
- IRR
- 30.6%
- Equity multiple
- 3.45×
- Total profit
- $342,035
- Equity at exit
- $449,539
- IRR
- 27.9%
- Equity multiple
- 8.39×
- Total profit
- $1,031,949
- Equity at exit
- $969,447
Cash invested: $139,720 (down + closing). Projections, not guarantees.
Landlord ↔ Tenant lean methodology
- Overall (CITY)
- 0 Strongly Tenant-Friendly
- State New York
- 15 Strongly Tenant-Friendly · D+10
- County
- — inherits STATE
- City New York
- 0 Strongly Tenant-Friendly · D+34
ZIP-level market 10009
- Home prices YoY
- 2.2%
- Rents YoY
- 7.5%
- Active inventory
- 87
- Price-to-rent
- 7.9×
Monthly cashflow live
- Estimated rent
- $5,267 medium interval (Pro) →
- Mortgage (P&I)
- −$2,617
- Tax est. 1.5%
- −$624 /mo · $7,485/yr
- Insurance
- −$208
- HOA
- −$0
- Vacancy / Maint / Mgmt
- −$1,106
- Net cashflow
- $712
Break-even live
UW: 25.0% down · 7.5% · 30yr · 1.5% tax · 5.0% vac · 8.0% maint · 8.0% mgmt
Financing live
Cash to close
- Down payment
- $124,750
- Closing costs
- $14,970
- Reserves months
- —
- Total cash needed
- —
Loan-product check · same deal, 3 products live
Conventional
25% down · 7.5% · 30yr
- Down + closing
- —
- Monthly P&I
- —
- Monthly cashflow
- —
- DSCR
- —
- Eligible?
- —
Personal DTI + credit; lowest rate.
DSCR
20% down · 8.5% · 30yr
- Down + closing
- —
- Monthly P&I
- —
- Monthly cashflow
- —
- DSCR
- —
- Eligible?
- —
No personal income docs; deal must DSCR.
Hard money
10% down · 12.0% · 12mo
- Down + closing
- —
- Monthly P&I
- —
- Monthly cashflow
- —
- DSCR
- —
- Eligible?
- —
Short-term bridge; refi at stabilization.
Rent comps 40 comps
| Address | Beds | Baths | Sqft | Rent | $/sqft | DOM | Units | Dist |
|---|---|---|---|---|---|---|---|---|
| 209 1st Ave Unit 1370708P New York, NY | 1.0 | 1.0 | 602 | $12,000 | $19.93 | 24d | 1 | 0.21mi |
| 93 1/2 E 7th St Unit 1054297P New York, NY | 2.0 | 1.0 | 495 | $10,000 | $20.20 | 22d | 1 | 0.31mi |
| 346 E 18th St Unit 1254596P New York, NY | 2.0 | 2.0 | 699 | $12,979 | $18.57 | 22d | 1 | 0.35mi |
| 112 E 10th St Unit 1021937P New York, NY | 1.0–3.0 | 1.0–2.5 | 1296 | $13,688 | $10.56 | 3d | 2 | 0.45mi |
| 101 E 10th St #1153 New York, NY | 1.0–2.0 | 1.0–2.0 | 575 | $16,510 | $28.71 | 1d | 2 | 0.47mi |
| 250 E 21st St Unit 8D New York, NY | 1.0 | 1.0 | 688 | $9,525 | $13.84 | 2d | 1 | 0.54mi |
| 171 Suffolk St #1265 New York, NY | 1.0–2.0 | 1.0 | 650 | $8,710 | $13.40 | 7d | 2 | 0.59mi |
| 1 Union Sq S #1174 New York, NY | 2.0 | 1.0–2.0 | 775 | $13,210 | $17.05 | 10d | 3 | 0.64mi |
| 20 Waterside Plz #978 New York, NY | 1.0 | 1.0 | 682 | $4,760 | $6.98 | 6d | 1 | 0.65mi |
| 815 Broadway #204 New York, NY | 1.0 | 1.0 | 522 | $8,250 | $15.80 | 7d | 1 | 0.66mi |
| 290 3rd Ave #279 New York, NY | 1.0 | 1.0 | 607 | $9,740 | $16.03 | 3d | 2 | 0.69mi |
| 11 E 1st St New York, NY | 2.0 | 1.0–2.0 | 1060 | $11,225 | $10.59 | 1d | 1 | 0.70mi |
| 30 Waterside Plz New York, NY | 2.0 | 1.0–2.0 | 743 | $6,598 | $8.88 | 1d | 33 | 0.72mi |
| 229 Chrystie St New York, NY | 1.0–2.0 | 1.0–2.0 | 810 | $10,485 | $12.94 | 4d | 3 | 0.72mi |
| 125 Delancey St #1523 New York, NY | 1.0–2.0 | 1.0–2.0 | 850 | $9,670 | $11.38 | 1d | 2 | 0.85mi |
| 180 Broome St #1521 New York, NY | 1.0–2.0 | 1.0–2.0 | 850 | $10,630 | $12.51 | 1d | 2 | 0.89mi |
| 155 E 31st St #2190 New York, NY | 1.0–2.0 | 1.0–1.5 | 725 | $8,070 | $11.13 | 7d | 2 | 1.06mi |
| 401 E 34th St New York, NY | 3.0 | 1.0–2.0 | 887 | $7,340 | $8.27 | 1d | 55 | 1.08mi |
| 364 6th Ave Unit 1023432P New York, NY | 1.0 | 1.0 | 441 | $9,135 | $20.71 | 22d | 1 | 1.08mi |
| 399 E 34th St Unit 1025362P New York, NY | 1.0 | 1.0 | 570 | $9,174 | $16.09 | 22d | 1 | 1.08mi |
| 101 W 15th St New York, NY | 1.0 | 1.0 | 562 | $9,550 | $16.98 | 1d | 2 | 1.09mi |
| 104 MacDougal St Unit 1056263P New York, NY | 2.0 | 1.0 | 441 | $9,375 | $21.26 | 22d | 1 | 1.09mi |
| 108 W 15th St #205 New York, NY | 1.0–2.0 | 1.0 | 697 | $10,040 | $14.39 | 3d | 2 | 1.10mi |
| 222 E 34th St #999 New York, NY | 1.0 | 1.0 | 554 | $5,490 | $9.91 | 6d | 1 | 1.12mi |
| 130 W 15th St #1383 New York, NY | 1.0–2.0 | 1.0–2.0 | 844 | $13,770 | $16.32 | 1d | 2 | 1.13mi |
| 187 Kent Ave #1730 Brooklyn, NY | 1.0 | 1.0 | 500 | $5,750 | $11.50 | 6d | 1 | 1.13mi |
| 141 E 33rd St #1278 New York, NY | 2.0 | 1.0–1.5 | 683 | $7,210 | $10.56 | 7d | 3 | 1.15mi |
| 177 Waverly Pl Unit 1075286P New York, NY | 1.0 | 1.0 | 452 | $10,000 | $22.12 | 24d | 1 | 1.16mi |
| 2 Blue Slip Brooklyn, NY | 2.0 | 1.0–2.0 | 819 | $8,221 | $10.04 | 2d | 7 | 1.18mi |
| 120 W 21st St New York, NY | 2.0 | 1.0–2.0 | 676 | $9,036 | $13.37 | 4d | 14 | 1.18mi |
| 10 Downing St #131 New York, NY | 1.0 | 1.0 | 731 | $9,050 | $12.38 | 4d | 2 | 1.20mi |
| 1 Blue Slip Brooklyn, NY | 2.0 | 1.0–2.0 | 834 | $7,548 | $9.04 | 2d | 13 | 1.21mi |
| 120 Mulberry St Unit 1257050P New York, NY | 2.0 | 1.0 | 645 | $12,372 | $19.18 | 24d | 1 | 1.22mi |
| 776 6th Ave New York, NY | 2.0 | 1.0–2.0 | 756 | $10,644 | $14.07 | 1d | 18 | 1.23mi |
| 43 W 27th St #1055 New York, NY | 2.0 | 1.0 | 740 | $9,940 | $13.43 | 24d | 1 | 1.23mi |
| 180 W 20th St #1202 New York, NY | 2.0 | 1.0–2.0 | 791 | $13,780 | $17.41 | 1d | 3 | 1.25mi |
| 309 5th Ave New York, NY | 1.0 | 1.0 | 597 | $7,596 | $12.72 | 7d | 13 | 1.25mi |
| 1 Bell Slip Brooklyn, NY | 2.0 | 1.0–2.0 | 766 | $7,462 | $9.74 | 2d | 7 | 1.26mi |
| 556 3rd Ave Unit 2244 New York, NY | 1.0 | 1.0 | 500 | $5,650 | $11.30 | 3d | 1 | 1.29mi |
| 556 3rd Ave New York, NY | 1.0 | 1.0 | 540 | $5,635 | $10.44 | 1d | 2 | 1.29mi |
HOA detail condo
- Monthly dues
- $0 · $0/yr
- Assessments
- None detected in remarks — confirm with the listing agent.
Listing history 14 events
-
2026-06-18days on market $499,000 Active 85 DOM
-
2026-06-17days on market $499,000 Active 84 DOM
-
2026-06-15days on market $499,000 Active 82 DOM
-
2026-06-13days on market $499,000 Active 80 DOM
-
2026-06-10days on market $499,000 Active 76 DOM
-
2026-06-08days on market $499,000 Active 75 DOM
-
2026-06-08days on market $499,000 Active 74 DOM
-
2026-06-04days on market $499,000 Active 71 DOM
-
2026-06-03days on market $499,000 Active 70 DOM
-
2026-06-01days on market $499,000 Active 68 DOM
-
2026-05-31pricedays on market $499,000 Active 67 DOM
-
2026-04-13price $535,000
-
2026-03-26$599,000 Active
-
2026-03-23historical $599,000
ⓘ Source: listings_history table (triggers on properties + properties_extension) + one-shot
backfill from property_details.listing_events for pre-trigger history.
Climate risk First Street
- Flood 1/10 Low FEMA zone X (unshaded) · 0% chance over 30 yrs
- Wildfire 1/10 Low
- Heat 6/10 Major 7 d/yr ≥99°F today · 15 d/yr by 30 yrs out
- Wind 6/10 Major 27% chance of damaging wind over 30 yrs
- Air quality 4/10 Moderate 5 unhealthy d/yr today · 7 by 30 yrs out
Nearby sold comps map
Loading sold comps map…
Walkable amenities ~0.75 mi
Loading nearby amenities…
Taxation est. · year 1
- Rental income
- $63,203
- − Mortgage interest
- −$27,952
- − Property taxes
- −$7,485
- − Insurance
- −$2,495
- − Repairs & maintenance
- −$5,056
- − Management
- −$5,056
- − Depreciation
- −$14,516
- Taxable income
- $643
- Est. tax owed @ 24.0%
- −$154
- After-tax cash flow
- $8,395/yr
For passive investors: Depreciation is non-cash, so a rental often shows a tax loss while cash-flowing — sheltering income. Rental losses are passive: they offset passive income freely, and up to $25,000/yr can offset ordinary (W-2) income if you actively participate and your MAGI is under $100k (phasing out to $0 by $150k); unused losses carry forward. On sale, claimed depreciation is recaptured at up to 25%, and gains may owe capital-gains tax (a 1031 exchange can defer both). Figures are a year-1 estimate at your 24.0% rate — not tax advice; consult a CPA.
Condition & rehab AI · 13 photos
This two-bedroom, one-bathroom HDFC co-op apartment in the East Village requires minor repairs and maintenance, with potential for significant value increases through updates.
Repairs flagged
- Minor kitchen backsplash — slight wear
- Minor bathroom shower door — slight wear
Value-add opportunities
- Both paint interior walls — Fresh paint enhances curb appeal and interior aesthetics
- Both update kitchen backsplash — Modern backsplash can increase both resale and rental value
- Both update bathroom shower door — A new shower door can improve both resale and rental value
Renovation cost estimate screening
| Repair item | Severity | Est. cost |
|---|---|---|
| kitchen backsplash · slight wear | Minor | $500–3,000 |
| bathroom shower door · slight wear | Minor | $500–3,000 |
| Total estimated repair cost · 2 items | $1,000–6,000 |
Value-add ROI direction
- Both paint interior walls — Fresh paint enhances curb appeal and interior aesthetics ↑
- Both update kitchen backsplash — Modern backsplash can increase both resale and rental value ↑
- Both update bathroom shower door — A new shower door can improve both resale and rental value ↑
ⓘ Cost ranges are severity-bucket heuristics (US national rule-of-thumb). Get contractor quotes + a written scope before underwriting a rehab budget.
Schools (NCES district)
No district data.
Livability — New York
- Score
- 75/100
- State rank
- #268
- US rank
- #4188
Category grades
Schools grade is shown separately in the Schools card above.
Census & demographics
- Census place
- New York, NY
- County
- New York County · 1,599,927 people
- City population
- 7,731,280
- Metro
- New York-Newark-Jersey City, NY-NJ-PA
- Population (ZIP)
- 60,209
- Household income
- $92,876
- Rent vs Own
- Severe rent burden
- 5275.0
Population outlook (New York County) Hauer SSP2
- Today (2025)
- 1,825,725 people
- By 2030
- 1,904,611 · +4.3%
- By 2040
- 2,052,719 · +12.4%
- By 2050
- 2,206,601 · +20.9%
- By 2075
- 2,509,427 · +37.4%
- By 2100
- 2,702,933 · +48.0%
Race, ethnicity, and origin ACS 2023
- Neighborhood character
- Diverse neighborhood (Simpson 0.66)
- Race & ethnicity
- White 51% Hispanic / Latino 24% Asian 13% Two or more races 11% Black 8%
- Hispanic origin (detail)
- Mexican 1% Puerto Rican 11% Cuban 2% Dominican 5%
- Common ancestry
- Romanian 3% Subsaharan African 2% Scotch-Irish 2%
- Foreign-born
- 25% · China, Canada, Jamaica
- Languages at home
- 64% English-only · Spanish 18% Chinese 8% Other Indo-European 3%
Political lean MEDSL · New York
- 2024 margin
- Solid D (+64.8) · D 82.4% · R 17.6%
- 2008→2024 swing
- -7.4pp toward R · 2008: 72.2pp · 2024: 64.8pp
- All cycles
- 2024: D+64.8 2020: D+74.5 2016: D+77.2 2012: D+69.6 2008: D+72.2
Not yet ingested
- Civics
- —
Market trends
- HPI YoY
- ▲ 10.20%
- Current HPI
- 473.6656
- Rent YoY
- ▲ 7.48%
- Metro
- New York-Newark-Jersey City, NY-NJ-PA
- State GDP YoY
- ▲ 2.60%
- F500 in state
- 92
Industry mix (Fortune 500 HQ in NY)
| Industry | F500 HQs | Revenue |
|---|---|---|
| Financial Services | 10 | $950B |
|
||
| Consumer Goods | 9 | $162B |
|
||
| Insurance | 4 | $225B |
|
||
| Telecommunications | 2 | $144B |
|
||
| Pharmaceuticals | 2 | $112B |
|
||
| Media / Entertainment | 2 | $69B |
|
||
Price history
-10.7% since first listed3 events — show timeline
- 2026-04-13 Price Changed $535,000 OneKey® MLS as Distributed by MLS Grid
- 2026-03-26 Listed $599,000 OneKey® MLS as Distributed by MLS Grid
- 2026-03-23 Coming Soon $599,000 OneKey® MLS as Distributed by MLS Grid
Cash-flow waterfall
monthlySold comps — $/sqft
last 12 mo · ≤1 miLoading sold comps…