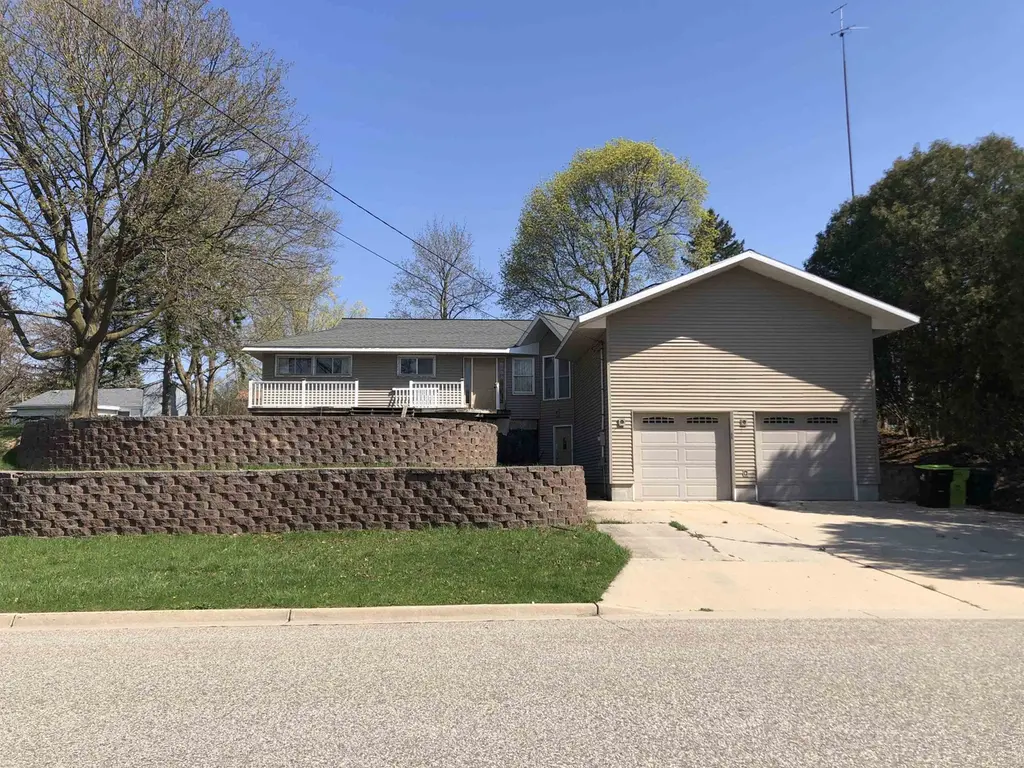
609 S Rainbow Dr · Clare, MI
Flood risk 5/10 · Moderate
- FEMA flood zone
- X (unshaded)
- Chance of flooding over 30 yrs
- 0.24%
- Est. flood insurance / yr
- $473 – $860
Fire risk 1/10 · Minimal
- Est. fire insurance / yr
- $784 – $1,456
Heat risk 2/10 · Minimal
- Hot days now (above 97°F)
- 7 days/yr
- Hot days in 30 yrs
- 14 days/yr
Wind risk 1/10 · Minimal
- Chance of severe wind over 30 yrs
- —
Air-quality risk 2/10 · Minimal
- Unhealthy air days now
- 1 days/yr
- Unhealthy air days in 30 yrs
- 1 days/yr
Risk factors via First Street. Map © Google.
Why this score? — see what drove the B- grade
The composite is a weighted blend of 9 inputs, each scored 0–100. Each bar is that input's sub-score; the figure is the points it added to the 100-point composite (weight × sub-score).
- Cash flow +24.3/30.0
- ARV discount +15.0/15.0
- DSCR +7.8/10.0
- 1% rule +7.4/10.0
- Livability +3.7/5.0
- Schools +3.0/10.0
- Rent growth +2.5/5.0
- Condition / age +2.5/5.0
- Appreciation +0.0/10.0
$109,900
🖨 Deal sheet 📄 Offer letter ✓ Due diligence
Listing remarks
Wow! Great residential location in Clare. Many possibilities for this home that needs upgrades and finish work. 3 bedrooms, 1 bath on main level, option laundry hookup in main bath, basement with laundry area, basement has unfinished rooms, unfinished bonus room above 2 car garage offering additional 720 sq ft. so many options for a new buyer, shown by advance appointment only, seller selling "as is" no upgrades and/or repairs, seller will consider only cash or conventional financing. #8023
Key facts
- 8,276 sq ft lot
- 2 garage spots
- Built 1954
Property features AI
Exterior
- Parking: Attached 2-car garage (28 x 24); Paved driveway
- Utilities: Public water; Public sanitary sewer; Natural gas service; Gas water heater
- Home design: Residential 1-story structure; Built in 1954; Below-grade finished area recorded
- Construction: Vinyl siding exterior; Block foundation; Full basement
- Exterior features: Vinyl siding; Property located within city limits and a subdivision; Road frontage
Interior
- Kitchen: Main-level kitchen (12 x 11) with vinyl flooring
- Bedrooms: First-floor bedroom(s); Bedroom 1 on main level (10 x 12) with wood flooring; Bedroom 2 on main level (11 x 15) with wood flooring; Bedroom 3 on main level (approx. W=14) with wood flooring
- Flooring: Wood flooring in bedrooms; Carpet in living room, dining room, office/library/den and other room(s); Vinyl flooring in kitchen and basement bathroom; Ceramic flooring in main bathroom; Other flooring in bonus/media room and one other room
- Bathrooms: Two full bathrooms; Main-level full bathroom (ceramic floor); Basement full bathroom (vinyl floor)
- Heating & cooling: Forced air heating (natural gas); Supplemental space heater; Gas water heater
- Interior features: Main-level living room (19 x 13); Main-level dining room (10 x 10); Bonus/media room; Office/library/den (11 x 11); Basement (full, block foundation) with finished area noted below; Other finished rooms (10 x 15; 29 x 24)
- Laundry & utility: Laundry room in basement (11 x 11)
Neighborhood map
What this means for you Summary
Snapshot
- This is a 4-bed/2.0-bath single-family listed at $110k.
Deal economics
- At list price, monthly cash flow is $221 ($3k/yr) — positive.
- The deal already cash-flows at list — no discount required.
- Meets the 1% rule at list price ($1k rent vs $110k).
- Recommended offer: $108k (1.5% below list) — sets the bar for market timing.
Location & tenants
- Location reads 74/100 on livability (#189 in MI, #4,789 nationally) — a middle-class / working-renter tenant base. Strengths: cost of living A+, housing A+, crime A; Watch: amenities F, commute F, employment F.
- Clare Public Schools (town): math 27% / reading 45% proficiency, ranked #280 of 540 in MI (top 52%) — families likely to look elsewhere, expect single-tenant / working-renter base with shorter leases.
- Market conditions: 23 active listings in the ZIP; 77 units permitted in Clare County in 2024 (0 in 5+ unit buildings).
Forward outlook
- Local home prices are declining (-3.0%/yr); year-one equity from $760 of loan paydown is wiped out by about $3k of value loss. Plan a longer hold.
- Clare County population projected at -20% by 2050 — secular population decline; favor cash flow + early exit over multi-decade hold.
Negotiation context
- It's been on market 22 days — a 2% lower offer ($108k) is reasonable based on typical stale-listing flexibility.
- 4 sale attempts since 3y ago with the ask held roughly flat each time — persistent listings suggest the price (not the market) is what's stuck; bring a comps-based counter.
Risks & watch-outs
- Watch-outs: property tax is 2.5% of price; built in 1954 — expect roof / HVAC / electrical / plumbing capex.
- Climate carrying-cost: moderate flood risk — expect insurance premiums to compound above CPI over the hold.
Questions for the listing agent
- Built in 1954 — when were the roof, HVAC, electrical panel, plumbing, and water heater last replaced?
- Property tax is high relative to price — has the assessment been appealed recently, and will the sale trigger a re-assessment?
- Is there a deadline driving the sale (1031 exchange, divorce, estate, relocation)? That informs how much negotiation room exists.
- What's the average days-on-market for RENTAL listings here right now (not sales)? A rising rental-DOM trend means longer vacancies and softer asking-rent achievability than the comps imply.
- What's the recent tenant-quality profile in this submarket — average credit score on applications, eviction rate, late-payment / NSF rate, and stable-employment percentage? A property-management company in the area should have these aggregated.
- How much new for-sale + rental construction is in the pipeline within 1–3 miles? Heavy new supply typically softens prices + rents 12–24 months out; constrained supply supports both.
Investment metrics
- 1% rule
- 1.24% ✓
- Cap rate
- 8.71%
- Cash-on-cash
- 8.62%
- DSCR
- 1.38
- GRM
- 6.7
CMA / ARV
- ARV (median comp)
- $175,051
- List price
- $109,900
- Delta
- -37.22%
- Verdict
- UNDERPRICED
- Comps
- 20 within 1.0 mi
Show comp detail 4 sales within ~0.75 mi
| Address | Dist | Beds/Ba | Sqft | Sold | Price | $/sf | Match |
|---|---|---|---|---|---|---|---|
| 775 Northridge Dr | 0.21mi | 4/2.5 | 2,397 (+8%) | 19mo | $350,000 | $146 | 60 |
| 4975 E Clarabella Rd | 0.53mi | 3/3.5 (-1) | 2,240 (+0%) | 6mo | $226,000 | $101 | 58 |
| 742 Blossomwood Dr | 0.26mi | 3/2.0 (-1) | 1,930 (-13%) | 9mo | $349,000 | $181 | 54 |
| 308 Forest Ave | 0.67mi | 4/3.0 | 2,192 (-2%) | 18mo | $217,500 | $99 | 47 |
Match score weights: distance 35% · size 25% · config 20% · recency 20%. Top-matched comps best support the ARV.
Projected returns pro-forma
-3.0% appreciation · 3.0% rent growth · sell at horizon
- IRR
- -3.2%
- Equity multiple
- 0.88×
- Total profit
- $-3,657
- Equity at exit
- $16,386
- IRR
- 6.6%
- Equity multiple
- 1.50×
- Total profit
- $15,258
- Equity at exit
- $9,502
Cash invested: $30,772 (down + closing). Projections, not guarantees.
Landlord ↔ Tenant lean methodology
- Overall (STATE)
- 62 Landlord-Friendly
- State Michigan
- 62 Landlord-Friendly · EVEN
- County
- — inherits STATE
- City
- — inherits STATE
ZIP-level market 48617
- Home prices YoY
- -22.4%
- Active inventory
- 23
- Price-to-rent
- 6.7×
Monthly cashflow live
- Estimated rent
- $1,362 medium interval (Pro) →
- Mortgage (P&I)
- −$576
- Tax from tax record
- −$233 /mo · $2,798/yr
- Insurance
- −$46
- HOA
- −$0
- Vacancy / Maint / Mgmt
- −$286
- Net cashflow
- $221
Break-even live
UW: 25.0% down · 7.5% · 30yr · 1.5% tax · 5.0% vac · 8.0% maint · 8.0% mgmt
Financing live
Cash to close
- Down payment
- $27,475
- Closing costs
- $3,297
- Reserves months
- —
- Total cash needed
- —
Loan-product check · same deal, 3 products live
Conventional
25% down · 7.5% · 30yr
- Down + closing
- —
- Monthly P&I
- —
- Monthly cashflow
- —
- DSCR
- —
- Eligible?
- —
Personal DTI + credit; lowest rate.
DSCR
20% down · 8.5% · 30yr
- Down + closing
- —
- Monthly P&I
- —
- Monthly cashflow
- —
- DSCR
- —
- Eligible?
- —
No personal income docs; deal must DSCR.
Hard money
10% down · 12.0% · 12mo
- Down + closing
- —
- Monthly P&I
- —
- Monthly cashflow
- —
- DSCR
- —
- Eligible?
- —
Short-term bridge; refi at stabilization.
Listing history 10 events
-
2026-05-15status Pending 507-char remark
-
2026-04-23$109,900 Active 507-char remark
-
2025-02-07status Pending
-
2025-02-07historical
-
2025-01-10price $139,900
-
2024-11-05status Active
-
2024-11-01historical
-
2024-04-02status Active
-
2024-04-01historical
-
2023-09-25$169,900 Active
ⓘ Source: listings_history table (triggers on properties + properties_extension) + one-shot
backfill from property_details.listing_events for pre-trigger history.
Tax reassessment forecast MI · Partial reset (capped growth)
- Current annual tax
- $2,798 · $233/mo
- Projected year-2 tax
- $2,798 · $233/mo
- Expected delta
- $0/yr ($0/mo · 0.0%)
ⓘ Screening estimate from a state-policy table — verify with the county assessor before closing.
Climate risk First Street
- Flood 5/10 Major FEMA zone X (unshaded) · 24% chance over 30 yrs
- Wildfire 1/10 Low
- Heat 2/10 Low 7 d/yr ≥97°F today · 14 d/yr by 30 yrs out
- Wind 1/10 Low
- Air quality 2/10 Low 1 unhealthy d/yr today · 1 by 30 yrs out
Nearby sold comps map
Loading sold comps map…
Walkable amenities ~0.75 mi
Loading nearby amenities…
Taxation est. · year 1
- Rental income
- $16,348
- − Mortgage interest
- −$6,156
- − Property taxes
- −$2,798
- − Insurance
- −$550
- − Repairs & maintenance
- −$1,308
- − Management
- −$1,308
- − Depreciation
- −$3,197
- Taxable income
- $1,031
- Est. tax owed @ 24.0%
- −$248
- After-tax cash flow
- $2,404/yr
For passive investors: Depreciation is non-cash, so a rental often shows a tax loss while cash-flowing — sheltering income. Rental losses are passive: they offset passive income freely, and up to $25,000/yr can offset ordinary (W-2) income if you actively participate and your MAGI is under $100k (phasing out to $0 by $150k); unused losses carry forward. On sale, claimed depreciation is recaptured at up to 25%, and gains may owe capital-gains tax (a 1031 exchange can defer both). Figures are a year-1 estimate at your 24.0% rate — not tax advice; consult a CPA.
Schools (NCES district)
- District
- Clare Public Schools
- NCES district ID
- 2609750
- Math proficiency
- 27% ▼ -6.00%
- Reading proficiency
- 45% ▼ -6.00%
- Median HH income
- $41,538
- Composite
- 30.3/100
- National rank
- #6276
- State rank
- #280 of 540 in MI
Livability — Clare
- Score
- 74/100
- State rank
- #189
- US rank
- #4789
Category grades
Schools grade is shown separately in the Schools card above.
Census & demographics
- Census place
- Clare, MI
- Population (ZIP)
- 9,729
Population outlook (Clare County) Hauer SSP2
- Today (2025)
- 29,283 people
- By 2030
- 28,199 · -3.7%
- By 2040
- 25,722 · -12.2%
- By 2050
- 23,372 · -20.2%
- By 2075
- 18,569 · -36.6%
- By 2100
- 14,320 · -51.1%
Race, ethnicity, and origin ACS 2023
- Neighborhood character
- Predominantly White (95%)
- Race & ethnicity
- White 95% Two or more races 4% Hispanic / Latino 1%
- Common ancestry
- Polish 9% Romanian 4% Iranian 2%
- Foreign-born
- 0%
- Languages at home
- 84% English-only · German/W. Germanic 15% Spanish 1%
Political lean MEDSL · Clare
- 2024 margin
- Solid R (+37.6) · D 30.5% · R 68.1% · Other 1.4%
- 2008→2024 swing
- -42.4pp toward R · 2008: 4.8pp · 2024: -37.6pp
- All cycles
- 2024: R+37.6 2020: R+34.8 2016: R+31.8 2012: R+4.8 2008: D+4.8
Not yet ingested
- Civics
- —
Market trends
- HPI YoY
- ▼ -68.18%
- Current HPI
- 236.3212
- Rent YoY
- —
- Metro
- —
- State GDP YoY
- ▲ 1.37%
- F500 in state
- 28
Industry mix (Fortune 500 HQ in MI)
| Industry | F500 HQs | Revenue |
|---|---|---|
| Automotive Parts | 3 | $48B |
|
||
| Automotive | 2 | $372B |
|
||
| Chemicals | 1 | $45B |
|
||
| Automotive Retail | 1 | $29B |
|
||
| Healthcare / Medical Devices | 1 | $23B |
|
||
| Automotive Technology | 1 | $20B |
|
||
Price history
-35.3% since first listed10 events — show timeline
- 2026-05-15 Pending — MiRealSource-MiMLS
- 2026-04-23 Listed $109,900 MiRealSource-MiMLS
- 2025-02-07 Pending — MiRealSource-MiMLS
- 2025-02-07 Listing Removed — MiRealSource-MiMLS
- 2025-01-10 Price Changed $139,900 MiRealSource-MiMLS
- 2024-11-05 Relisted — MiRealSource-MiMLS
- 2024-11-01 Listing Removed — MiRealSource-MiMLS
- 2024-04-02 Relisted — MiRealSource-MiMLS
- 2024-04-01 Listing Removed — MiRealSource-MiMLS
- 2023-09-25 Listed $169,900 MiRealSource-MiMLS
Property tax history
+4.2%/yrLatest (2025): $2,798 · +2.1% YoY. Source: county tax records.
Cash-flow waterfall
monthlySold comps — $/sqft
last 12 mo · ≤1 miLoading sold comps…