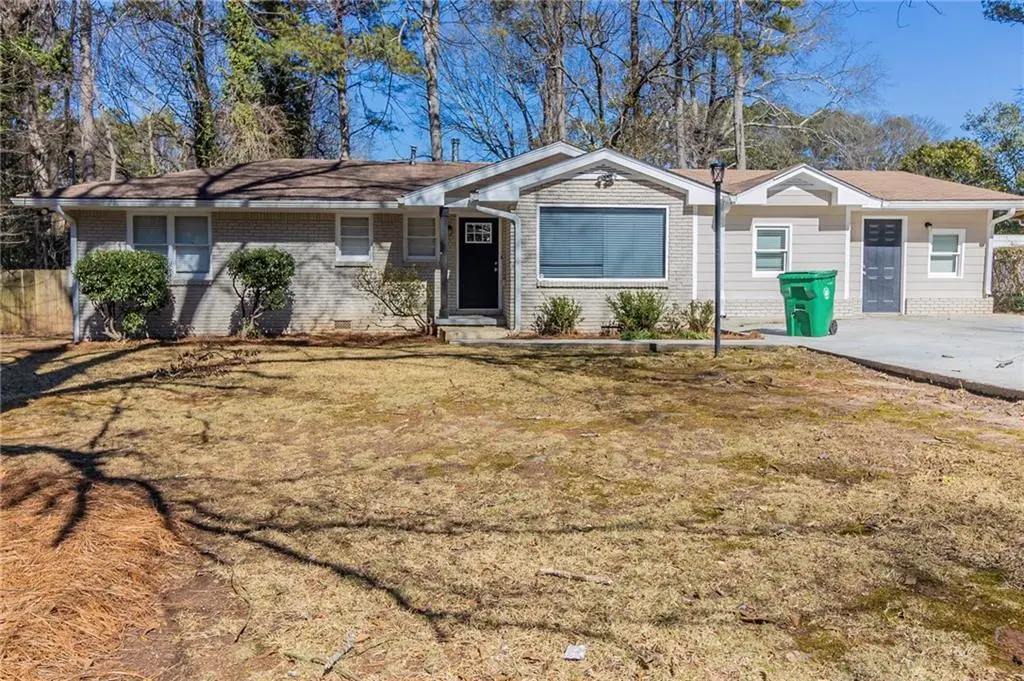
3716 Loren Dr · Belvedere Park, GA
Flood risk 1/10 · Minimal
- FEMA flood zone
- X (unshaded)
- Chance of flooding over 30 yrs
- 0.0%
- Est. flood insurance / yr
- $507 – $1,088
Fire risk 1/10 · Minimal
- Est. fire insurance / yr
- $963 – $1,789
Heat risk 5/10 · Moderate
- Hot days now (above 104°F)
- 7 days/yr
- Hot days in 30 yrs
- 18 days/yr
Wind risk 5/10 · Moderate
- Chance of severe wind over 30 yrs
- 26.0%
Air-quality risk 6/10 · Moderate
- Unhealthy air days now
- 8 days/yr
- Unhealthy air days in 30 yrs
- 11 days/yr
Risk factors via First Street. Map © Google.
Why this score? — see what drove the D grade
The composite is a weighted blend of 9 inputs, each scored 0–100. Each bar is that input's sub-score; the figure is the points it added to the 100-point composite (weight × sub-score).
- ARV discount +15.0/15.0
- Cash flow +10.3/30.0
- 1% rule +3.6/10.0
- Livability +3.4/5.0
- DSCR +3.0/10.0
- Rent growth +2.8/5.0
- Condition / age +2.5/5.0
- Schools +2.1/10.0
- Appreciation +0.0/10.0
$219,900
🖨 Deal sheet (PDF) 📄 Offer letter ✓ Due diligence
Listing remarks MLS
Welcome to this stunning 4-bedroom, 2-bathroom single-story home, offering both comfort and style in every detail. The beautifully designed kitchen features white cabinetry, stone countertops, and stainless steel appliances, creating the perfect space for cooking and entertaining. The home boasts a mix of tile, carpet, and artificial flooring, adding warmth and character throughout. Step outside to enjoy the spacious fenced backyard, complete with a patio-ideal for outdoor gatherings and relaxation. A driveway provides ample parking. Don't miss this incredible opportunity to own a home that combines modern updates with inviting spaces. Schedule your showing today!
Key facts
- Stone countertops
- Patio
- Fenced backyard
Tags
Neighborhood map
What this means for you Summary
Snapshot
- This is a 3-bed/1.5-bath single-family listed at $220k.
Deal economics
- At list price, monthly cash flow is $-121 ($-1k/yr) — negative.
- To cash-flow at today's rent, offer at most $199k (9.7% below list).
- To meet the 1% rule (rent ≥ 1% of price), the offer needs to be $188k (14.4% below list).
- Recommended offer: $188k (14.4% below list) — sets the bar for 1% rule.
- Cap rate 5.6% vs local median 3.6% in Belvedere Park — top-decile yield for the area; either an underpriced asset or a hidden risk that comps aren't pricing in. Stress-test before assuming the spread holds.
Location & tenants
- Location reads 68/100 on livability (#153 in GA) — a middle-class / working-renter tenant base. Strengths: cost of living A+, housing A+; Watch: amenities F, commute F, health & safety F.
- Dekalb County (suburban): math 19% / reading 28% proficiency, ranked #125 of 174 in GA (top 72%) — low school quality limits family demand, transient renter base, plan for 1-2y turnover; 68% free/reduced lunch — lower-income household profile, screen leases tightly.
- Zoned schools: Peachcrest Elementary School (math 2% / reading 8%, grade F, #1,160 of 1,228 statewide, top 98%, 677 students, 100% FRL); The Champion Middle Theme School (math 21% / reading 52%, grade F, #167 of 470 statewide, top 38%, 751 students, 100% FRL); Towers High School (math 2% / reading 12%, grade F, #385 of 424 statewide, top 92%, 764 students, 100% FRL) — zoned schools average 100% FRL vs 68% district-wide (32 pts higher); higher-poverty schools than district average — tighter screening recommended.
- Market conditions: Rents rising (+1.3%/yr); 431 active listings in the ZIP; 40 comparable units currently listed for rent nearby; rentals at typical pace (median 27d on market — plan ~3-4 weeks tenant-placement turnaround); 42% of comp listings sitting > 30 days — soft ceiling on asking rent; 1,240 units permitted in DeKalb County in 2024 (385 in 5+ unit buildings).
- This rent runs 36% of the median local income ($63k/yr) — at the standard rent-burdened threshold; future hikes will face affordability resistance.
Forward outlook
- Local home prices are declining (-3.0%/yr); year-one equity from $2k of loan paydown is wiped out by about $7k of value loss. Plan a longer hold.
- DeKalb County population projected at +28% by 2050 — long-run rental-demand tailwind backs the buy-and-hold thesis.
Negotiation context
- It's been on market 101 days — a 9% lower offer ($200k) is reasonable based on typical stale-listing flexibility.
- 9 sale attempts since 19y ago with the ask held roughly flat each time — persistent listings suggest the price (not the market) is what's stuck; bring a comps-based counter.
- Current owner paid $142k; list at $220k implies a 54% gain — meaningful room to come down on a strong offer.
Risks & watch-outs
- Watch-outs: built in 1956 — expect roof / HVAC / electrical / plumbing capex.
- Climate carrying-cost: moderate wind risk, 26% chance of damaging wind over 30y; extreme-heat days projected 7→18/yr by 2055 (HVAC capex compounding) — expect insurance premiums to compound above CPI over the hold.
Questions for the listing agent
- What do current leases actually rent for vs. the listed asking? Can we see a recent rent roll and the last 12 months of T-12 income?
- It's been on market 101 days. Have you received any prior offers? Is the seller open to a 14% concession, seller financing, or rate buy-down credit?
- Built in 1956 — when were the roof, HVAC, electrical panel, plumbing, and water heater last replaced?
- Why hasn't it sold? Are there any deal-killer items the seller is aware of (foundation, flood, title, zoning, code violations)?
- Is there a deadline driving the sale (1031 exchange, divorce, estate, relocation)? That informs how much negotiation room exists.
- Schools are F-rated, which usually means shorter tenancies and higher turnover. Who's the typical renter profile here, and what's been the actual vacancy rate?
- The area grade is low — what's the realistic commute time and amenity access for the typical tenant pool here? Any planned neighborhood developments (good or bad) we should know about?
- What's the average days-on-market for RENTAL listings here right now (not sales)? A rising rental-DOM trend means longer vacancies and softer asking-rent achievability than the comps imply.
- What's the recent tenant-quality profile in this submarket — average credit score on applications, eviction rate, late-payment / NSF rate, and stable-employment percentage? A property-management company in the area should have these aggregated.
- How much new for-sale + rental construction is in the pipeline within 1–3 miles? Heavy new supply typically softens prices + rents 12–24 months out; constrained supply supports both.
Investment metrics
- 1% rule
- 0.86% ✗
- Cap rate
- 5.63%
- Cash-on-cash
- -2.36%
- DSCR
- 0.90
- GRM
- 9.7
CMA / ARV
- ARV (median comp)
- $278,439
- List price
- $219,900
- Delta
- -21.02%
- Verdict
- UNDERPRICED
- Comps
- 20 within 1.0 mi
Show comp detail 12 sales within ~0.75 mi
| Address | Dist | Beds/Ba | Sqft | Sold | Price | $/sf | Match |
|---|---|---|---|---|---|---|---|
| 1368 W Austin Rd | 0.11mi | 4/2.0 (+1) | 1,469 (-7%) | 1mo | $205,000 | $140 | 76 |
| 3993 Brookcrest Cir | 0.57mi | 3/2.0 | 1,618 (+3%) | 1mo | $265,000 | $164 | 66 |
| 1440 Joy Ln | 0.56mi | 3/2.0 | 1,508 (-4%) | 1mo | $299,000 | $198 | 64 |
| 1304 Cornwall Rd | 0.28mi | 3/2.0 | 1,376 (-13%) | 4mo | $320,000 | $233 | 61 |
| 3452 Beech Dr | 0.72mi | 3/2.0 | 1,590 (+1%) | 7mo | $340,000 | $214 | 57 |
| 1613 Gilston Ct | 0.58mi | 3/1.5 | 1,462 (-7%) | 8mo | $155,000 | $106 | 54 |
| 3751 Oakwood Mnr | 0.56mi | 4/2.5 (+1) | 1,682 (+7%) | 0mo | $229,900 | $137 | 54 |
| 3699 Oakwood Mnr | 0.64mi | 3/2.5 | 1,466 (-7%) | 4mo | $200,000 | $136 | 52 |
| 3842 Brookcrest Cir | 0.59mi | 4/2.0 (+1) | 1,475 (-6%) | 5mo | $324,000 | $220 | 50 |
| 1155 Evangeline Dr | 0.53mi | 3/2.0 | 1,770 (+12%) | 4mo | $240,000 | $136 | 49 |
| 3986 Phylis Pl | 0.66mi | 4/2.0 (+1) | 1,404 (-11%) | 1mo | $329,000 | $234 | 43 |
| 1669 Freedom Vly | 0.74mi | 4/1.5 (+1) | 1,375 (-13%) | 0mo | $174,000 | $127 | 39 |
Match score weights: distance 35% · size 25% · config 20% · recency 20%. Top-matched comps best support the ARV.
Projected returns pro-forma
-3.0% appreciation · 1.34% rent growth · sell at horizon
- IRR
- -22.2%
- Equity multiple
- 0.25×
- Total profit
- $-46,355
- Equity at exit
- $32,788
- IRR
- -21.1%
- Equity multiple
- -0.01×
- Total profit
- $-62,236
- Equity at exit
- $19,013
Cash invested: $61,572 (down + closing). Projections, not guarantees.
Landlord ↔ Tenant lean methodology
- Overall (STATE)
- 90 Strongly Landlord-Friendly
- State Georgia
- 90 Strongly Landlord-Friendly · R+3
- County
- — inherits STATE
- City
- — inherits STATE
ZIP-level market 30032
- Rents YoY
- 1.3%
- Active inventory
- 431
- Price-to-rent
- 9.7×
Monthly cashflow live
- Estimated rent
- $1,883 high interval (Pro) →
- Mortgage (P&I)
- −$1,153
- Tax from tax record
- −$364 /mo · $4,367/yr
- Insurance
- −$92
- HOA
- −$0
- Vacancy / Maint / Mgmt
- −$395
- Net cashflow
- $-121
Break-even live
Sensitivity live
| Price | -10% $3 | -5% $-59 | +0% $-121 | +5% $-183 | +10% $-246 |
|---|---|---|---|---|---|
| Rent | -10% $-270 | -5% $-195 | +0% $-121 | +5% $-47 | +10% $28 |
| Rate | -1.0pp $-10 | -0.5pp $-65 | base $-121 | +0.5pp $-178 | +1.0pp $-236 |
UW: 25.0% down · 7.5% · 30yr · 1.5% tax · 5.0% vac · 8.0% maint · 8.0% mgmt
Financing live
Cash to close
- Down payment
- $54,975
- Closing costs
- $6,597
- Reserves months
- —
- Total cash needed
- —
Loan-product check · same deal, 3 products live
Conventional
25% down · 7.5% · 30yr
- Down + closing
- —
- Monthly P&I
- —
- Monthly cashflow
- —
- DSCR
- —
- Eligible?
- —
Personal DTI + credit; lowest rate.
DSCR
20% down · 8.5% · 30yr
- Down + closing
- —
- Monthly P&I
- —
- Monthly cashflow
- —
- DSCR
- —
- Eligible?
- —
No personal income docs; deal must DSCR.
Hard money
10% down · 12.0% · 12mo
- Down + closing
- —
- Monthly P&I
- —
- Monthly cashflow
- —
- DSCR
- —
- Eligible?
- —
Short-term bridge; refi at stabilization.
Rent comps 40 comps
| Address | Beds | Baths | Sqft | Rent | $/sqft | DOM | Units | Dist |
|---|---|---|---|---|---|---|---|---|
| 3728 Loren Dr Decatur, GA | 3.0 | 1.5 | 1340 | $2,150 | $1.60 | 46d | 1 | 0.03mi |
| 1423 Dennis Dr Decatur, GA | 3.0 | 1.0 | 1062 | $1,200 | $1.13 | 19d | 1 | 0.23mi |
| 3787 Redwing Cir Decatur, GA | 3.0 | 1.0 | 1220 | $1,495 | $1.23 | 46d | 1 | 0.24mi |
| 3961 Covington Hwy Decatur, GA | 2.0–3.0 | 1.0–1.5 | 1000 | $1,560 | $1.56 | 4d | 8 | 0.29mi |
| 3824 London Dr Decatur, GA | 3.0 | 2.5 | 1544 | $1,531 | $0.99 | 46d | 1 | 0.46mi |
| 1473 Hyatt Cir Decatur, GA | 3.0 | 2.5 | 1386 | $2,050 | $1.48 | 46d | 1 | 0.52mi |
| 3096 Calcutta St Decatur, GA | 3.0 | 2.5 | 1386 | $1,895 | $1.37 | 46d | 1 | 0.53mi |
| 3106 Calcutta St Decatur, GA | 3.0 | 2.5 | 1386 | $1,895 | $1.37 | 46d | 1 | 0.55mi |
| 3121 Journal Ct Decatur, GA | 3.0 | 2.5 | 1386 | $1,895 | $1.37 | 22d | 1 | 0.57mi |
| 1502 Vernon Blvd Decatur, GA | 3.0 | 3.0 | 1515 | $2,050 | $1.35 | 26d | 1 | 0.62mi |
| 1683 Vernon Blvd Decatur, GA | 3.0 | 2.5 | 1515 | $1,840 | $1.21 | 21d | 1 | 0.69mi |
| 3184 Delancy St Decatur, GA | 3.0 | 2.5 | 1515 | $1,800 | $1.19 | 46d | 1 | 0.70mi |
| 1055 Holcombe Rd Decatur, GA | 2.0–3.0 | 1.5 | 1157 | $1,459 | $1.26 | 5d | 6 | 0.74mi |
| 3141 Journal Ct Decatur, GA | 3.0 | 2.5 | 1386 | $1,895 | $1.37 | 15d | 1 | 0.77mi |
| 3560 Sweetgum Ln Decatur, GA | 4.0 | 3.0 | 1848 | $1,766 | $0.96 | 7d | 1 | 0.78mi |
| 3427 Jackson Dr Decatur, GA | 3.0 | 2.0 | 1400 | $1,900 | $1.36 | 21d | 1 | 0.80mi |
| 3960 Redan Rd Stone Mountain, GA | 1.0–3.0 | 1.0–2.0 | 1339 | $3,194 | $2.39 | 3d | 19 | 0.81mi |
| 4011 Redan Rd #5 Stone Mountain, GA | 3.0 | 2.5 | 1426 | $2,040 | $1.43 | 21d | 1 | 0.82mi |
| 4011 Redan Rd #5 Stone Mountain, GA | 3.0 | 2.5 | 1400 | $2,040 | $1.46 | 46d | 1 | 0.82mi |
| 1428 David Cir Unit A11 Decatur, GA | 3.0 | 1.5 | 1362 | $1,830 | $1.34 | 46d | 1 | 0.82mi |
| 1590 Agape Way Decatur, GA | 1.0–3.0 | 1.0–2.0 | 1022 | $1,400 | $1.37 | 46d | 1 | 0.82mi |
| 1081 Brittania Rd Stone Mountain, GA | 3.0 | 3.0 | 1866 | $1,950 | $1.05 | 46d | 1 | 0.87mi |
| 1081 Brittania Rd Unit 1 Stone Mountain, GA | 3.0 | 2.5 | 1866 | $1,950 | $1.05 | 46d | 1 | 0.87mi |
| 3964 Carlinswood Way Stone Mountain, GA | 3.0 | 2.5 | 1681 | $2,000 | $1.19 | 46d | 1 | 0.92mi |
| 3485 Cobbs Ferry Dr Decatur, GA | 3.0 | 2.0 | 1252 | $1,450 | $1.16 | 26d | 1 | 0.92mi |
| 1023 Privy Ln Stone Mountain, GA | 3.0 | 2.5 | 1701 | $2,700 | $1.59 | 7d | 1 | 0.95mi |
| 3445 Cobbs Ferry Dr Decatur, GA | 3.0 | 2.0 | 1252 | $1,450 | $1.16 | 26d | 1 | 0.95mi |
| 3432 Cobbs Ferry Dr Decatur, GA | 3.0 | 2.0 | 1252 | $1,450 | $1.16 | 7d | 1 | 0.95mi |
| 3841 Kensington Rd Decatur, GA | 2.0–3.0 | 2.0 | 1220 | $1,800 | $1.48 | 1d | 13 | 0.96mi |
| 1368 Alverado Way Decatur, GA | 2.0 | 1.0 | 1088 | $1,523 | $1.40 | 46d | 1 | 0.96mi |
| 1223 Crescentwood Ln Decatur, GA | 3.0 | 2.5 | 2244 | $2,500 | $1.11 | 22d | 1 | 0.99mi |
| 3711 Daisy Dr Decatur, GA | 3.0 | 1.5 | 1240 | $1,700 | $1.37 | 46d | 1 | 1.00mi |
| 3579 Tulip Dr Decatur, GA | 3.0 | 2.0 | 1075 | $1,550 | $1.44 | 26d | 1 | 1.01mi |
| 3692 Larkspur Ter Decatur, GA | 3.0 | 2.0 | 1100 | $1,700 | $1.55 | 46d | 1 | 1.04mi |
| 3405 Cobbs Ferry Dr Unit 3405 Decatur, GA | 3.0 | 2.0 | 1331 | $1,550 | $1.16 | 46d | 1 | 1.04mi |
| 1221 S Indian Creek Dr Stone Mountain, GA | 1.0–2.0 | 1.0–2.0 | 905 | $1,790 | $1.98 | 26d | 15 | 1.06mi |
| 1221 S Indian Creek Dr Stone Mountain, GA | 1.0–2.0 | 1.0–2.0 | 905 | $1,725 | $1.91 | 1d | 16 | 1.06mi |
| 3395 Columbia Trce Decatur, GA | 3.0 | 2.0 | 1252 | $1,450 | $1.16 | 26d | 1 | 1.06mi |
| 3381 Columbia Trce Decatur, GA | 3.0 | 2.0 | 1252 | $1,450 | $1.16 | 7d | 1 | 1.09mi |
| 3365 Columbia Trce Decatur, GA | 3.0 | 2.0 | 1252 | $1,450 | $1.16 | 7d | 1 | 1.11mi |
Listing history 38 events
-
2026-06-21days on market $219,900 Active 101 DOM
-
2026-06-18days on market $219,900 Active 98 DOM
-
2026-06-17days on market $219,900 Active 97 DOM
-
2026-06-16days on market $219,900 Active 96 DOM
-
2026-06-15days on market $219,900 Active 95 DOM
-
2026-06-13days on market $219,900 Active 93 DOM
-
2026-06-09days on market $219,900 Active 89 DOM
-
2026-06-08days on market $219,900 Active 88 DOM
-
2026-06-07days on market $219,900 Active 87 DOM
-
2026-06-04days on market $219,900 Active 84 DOM
-
2026-06-03days on market $219,900 Active 83 DOM
-
2026-06-02days on market $219,900 Active 82 DOM
-
2026-06-01days on market $219,900 Active 81 DOM
-
2026-05-31days on market $219,900 Active 80 DOM
-
2026-03-12$230,000 New 675-char remark
Show marketing remark (687 chars)
Welcome to this stunning 4-bedroom, 2-bathroom single-story home, offering both comfort and style in every detail. The beautifully designed kitchen features white cabinetry, stone countertops, and stainless steel appliances, creating the perfect space for cooking and entertaining. The home boasts a mix of tile, carpet, and artificial flooring, adding warmth and character throughout. Step outside to enjoy the spacious fenced backyard, complete with a patio—ideal for outdoor gatherings and relaxation. A driveway provides ample parking. Don’t miss this incredible opportunity to own a home that combines modern updates with inviting spaces. Schedule your showing today!
-
2026-03-12$230,000 Active 687-char remark
Show marketing remark (687 chars)
Welcome to this stunning 4-bedroom, 2-bathroom single-story home, offering both comfort and style in every detail. The beautifully designed kitchen features white cabinetry, stone countertops, and stainless steel appliances, creating the perfect space for cooking and entertaining. The home boasts a mix of tile, carpet, and artificial flooring, adding warmth and character throughout. Step outside to enjoy the spacious fenced backyard, complete with a patio—ideal for outdoor gatherings and relaxation. A driveway provides ample parking. Don’t miss this incredible opportunity to own a home that combines modern updates with inviting spaces. Schedule your showing today!
-
2026-03-11historical
-
2025-09-23status Back On Market
-
2025-09-18historical Active Under Contract
-
2025-08-27status Back On Market
-
2025-05-07historical Active Under Contract
-
2025-04-11price $250,000
-
2025-02-26$260,000 New
-
2019-10-15soldstatus $142,500
-
2019-10-11soldstatus $142,500 Closed
-
2019-09-27status Pending
-
2019-09-22$149,900 Active
-
2018-10-02soldstatus $115,000 Sold
-
2018-10-02soldstatus $115,000 Sold
-
2018-08-30status Under Contract
-
2018-08-30status Pending
-
2018-08-17$125,000 Active
-
2018-08-17$125,000 New
-
2013-02-25soldstatus $48,800
-
2008-03-17soldstatus $55,000
-
2007-08-30$60,000
-
2006-05-04soldstatus $165,000
-
1992-05-15soldstatus $46,000
ⓘ Source: listings_history table (triggers on properties + properties_extension) + one-shot
backfill from property_details.listing_events for pre-trigger history.
Tax reassessment forecast GA · Resets to sale price
- Current annual tax
- $4,367 · $364/mo
- Projected year-2 tax
- $4,367 · $364/mo
- Expected delta
- $0/yr ($0/mo · 0.0%)
ⓘ Screening estimate from a state-policy table — verify with the county assessor before closing.
Climate risk First Street
- Flood 1/10 Low FEMA zone X (unshaded) · 0% chance over 30 yrs
- Wildfire 1/10 Low
- Heat 5/10 Major 7 d/yr ≥104°F today · 18 d/yr by 30 yrs out
- Wind 5/10 Major 26% chance of damaging wind over 30 yrs
- Air quality 6/10 Major 8 unhealthy d/yr today · 11 by 30 yrs out
Nearby sold comps map
Loading sold comps map…
Walkable amenities ~0.75 mi
Loading nearby amenities…
Taxation est. · year 1
- Rental income
- $22,597
- − Mortgage interest
- −$12,318
- − Property taxes
- −$4,367
- − Insurance
- −$1,100
- − Repairs & maintenance
- −$1,808
- − Management
- −$1,808
- − Depreciation
- −$6,397
- Taxable loss
- −$5,200
- Est. tax savings @ 24.0%
- +$1,248
- After-tax cash flow
- $-205/yr
For passive investors: Depreciation is non-cash, so a rental often shows a tax loss while cash-flowing — sheltering income. Rental losses are passive: they offset passive income freely, and up to $25,000/yr can offset ordinary (W-2) income if you actively participate and your MAGI is under $100k (phasing out to $0 by $150k); unused losses carry forward. On sale, claimed depreciation is recaptured at up to 25%, and gains may owe capital-gains tax (a 1031 exchange can defer both). Figures are a year-1 estimate at your 24.0% rate — not tax advice; consult a CPA.
Schools (NCES district)
- District
- Dekalb County
- NCES district ID
- 1301740
- Math proficiency
- 19% ▼ -12.00%
- Reading proficiency
- 28% ▼ -7.00%
- Median HH income
- $51,448
- Composite
- 20.92/100
- National rank
- #8482
- State rank
- #125 of 174 in GA
Livability — Belvedere Park
- Score
- 68/100
- State rank
- #153
- US rank
- #9886
Category grades
Schools grade is shown separately in the Schools card above.
Census & demographics
- Census place
- Belvedere Park, GA
- County
- Dekalb County · 782,738 people
- City population
- 42,812
- Metro
- Atlanta-Sandy Springs-Alpharetta, GA
- Population (ZIP)
- 42,948
- Household income
- $62,765
- Rent vs Own
- Severe rent burden
- 2097.0
Population outlook (DeKalb County) Hauer SSP2
- Today (2025)
- 839,977 people
- By 2030
- 891,768 · +6.2%
- By 2040
- 988,894 · +17.7%
- By 2050
- 1,074,583 · +27.9%
- By 2075
- 1,245,026 · +48.2%
- By 2100
- 1,303,135 · +55.1%
Race, ethnicity, and origin ACS 2023
- Neighborhood character
- Predominantly Black (70%)
- Race & ethnicity
- Black 70% White 18% Two or more races 6% Hispanic / Latino 5% Asian 2%
- Hispanic origin (detail)
- Mexican 2%
- Common ancestry
- Slovak 1% Italian 1% Serbian 1%
- Foreign-born
- 7% · Canada, China, Guatemala
- Languages at home
- 91% English-only · Spanish 4% Arabic 1% Other Indo-European 0%
Political lean MEDSL · DeKalb
- 2024 margin
- Solid D (+64.8) · D 81.9% · R 17.1% · Other 1.0%
- 2008→2024 swing
- +6.1pp toward D · 2008: 58.6pp · 2024: 64.8pp
- All cycles
- 2024: D+64.8 2020: D+67.4 2016: D+64.8 2012: D+56.8 2008: D+58.6
Not yet ingested
- Civics
- —
Market trends
- HPI YoY
- ▼ -203.83%
- Current HPI
- 221.0467
- Rent YoY
- ▲ 1.34%
- Metro
- Atlanta-Sandy Springs-Alpharetta, GA
- State GDP YoY
- ▲ 2.66%
- F500 in state
- 28
Industry mix (Fortune 500 HQ in GA)
| Industry | F500 HQs | Revenue |
|---|---|---|
| Paper / Packaging | 2 | $29B |
|
||
| Retail | 1 | $160B |
|
||
| Transportation / Logistics | 1 | $91B |
|
||
| Airlines | 1 | $62B |
|
||
| Consumer Goods | 1 | $47B |
|
||
| Utilities | 1 | $25B |
|
||
Price history
+400.0% since first listed24 events — show timeline
- 2026-03-12 Listed $230,000 FMLS
- 2026-03-12 Listed $230,000 GAMLS
- 2026-03-11 Listing Removed — GAMLS
- 2025-09-23 Relisted — GAMLS
- 2025-09-18 Contingent — GAMLS
- 2025-08-27 Relisted — GAMLS
- 2025-05-07 Contingent — GAMLS
- 2025-04-11 Price Changed $250,000 GAMLS
- 2025-02-26 Listed $260,000 GAMLS
- 2019-10-15 Sold (Public Records) $142,500 Public Records
- 2019-10-11 Sold (MLS) $142,500 FMLS
- 2019-09-27 Pending — FMLS
- 2019-09-22 Listed $149,900 FMLS
- 2018-10-02 Sold (MLS) $115,000 GAMLS
- 2018-10-02 Sold (MLS) $115,000 FMLS
- 2018-08-30 Pending — GAMLS
- 2018-08-30 Pending — FMLS
- 2018-08-17 Listed $125,000 GAMLS
- 2018-08-17 Listed $125,000 FMLS
- 2013-02-25 Sold (Public Records) $48,800 Public Records
- 2008-03-17 Sold (MLS) $55,000 FMLS
- 2007-08-30 Listed $60,000 FMLS
- 2006-05-04 Sold (Public Records) $165,000 Public Records
- 1992-05-15 Sold (Public Records) $46,000 Public Records
Property tax history
+4.6%/yrLatest (2025): $4,367 · +0.1% YoY. Source: county tax records.
Cash-flow waterfall
monthlySold comps — $/sqft
last 12 mo · ≤1 miLoading sold comps…