 🏗️ New Construction
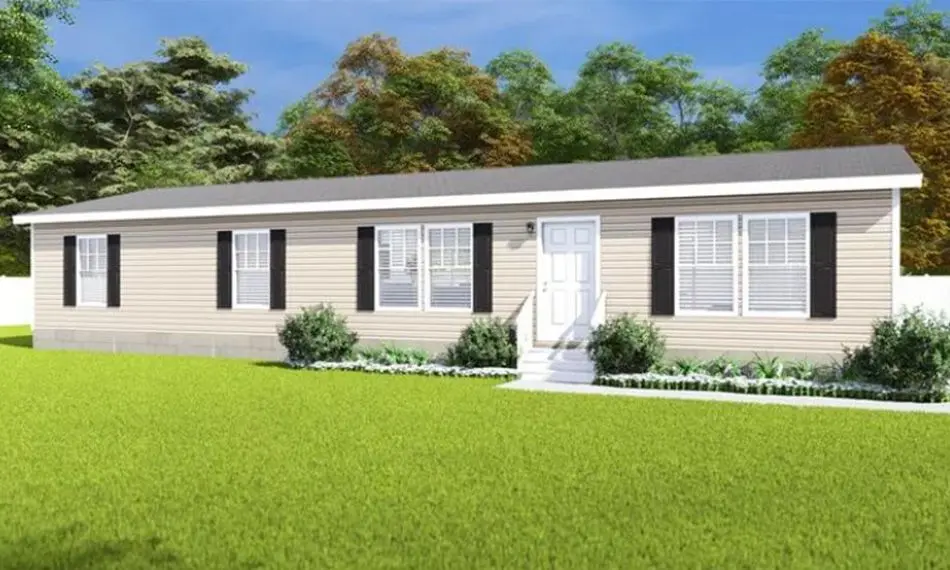
Sterling Plan · Upper Providence, PA
Flood risk No data
- FEMA flood zone
- —
- Chance of flooding over 30 yrs
- —
- Est. flood insurance / yr
- —
Fire risk No data
- Est. fire insurance / yr
- —
Heat risk No data
- Hot days now (above threshold)
- —
- Hot days in 30 yrs
- —
Wind risk No data
- Chance of severe wind over 30 yrs
- —
Air-quality risk No data
- Unhealthy air days now
- —
- Unhealthy air days in 30 yrs
- —
Risk factors via First Street. Map © Google.
Why this score? — see what drove the B- grade
The composite is a weighted blend of 9 inputs, each scored 0–100. Each bar is that input's sub-score; the figure is the points it added to the 100-point composite (weight × sub-score).
- Cash flow +30.0/30.0
- 1% rule +10.0/10.0
- DSCR +10.0/10.0
- ARV discount +7.5/15.0
- Schools +6.0/10.0
- Rent growth +3.0/5.0
- Livability +2.5/5.0
- Condition / age +1.0/5.0
- Appreciation +0.0/10.0
$96,900
🖨 Deal sheet 📄 Offer letter ✓ Due diligence
Key facts
- Listed 14 days
Property features AI
Finance
- Financial info: List price $96,900
Exterior
- Home design: Plan home (Sterling)
- Exterior features: Living area approximately 800
Interior
- Bedrooms: 2 bedrooms
- Bathrooms: 1 full bathroom
- Interior features: Plan name: Sterling
Neighborhood map
What this means for you Summary
Snapshot
- This is a 2-bed/1.0-bath manufactured listed at $97k. Condition is rated poor.
Deal economics
- At list price, monthly cash flow is $969 ($12k/yr) — positive.
- The deal already cash-flows at list — no discount required.
- Meets the 1% rule at list price ($2k rent vs $97k).
Location & tenants
- Location reads: area grade B — affects rentability + tenant quality, not the cash-flow math above.
- Rose Tree Media SD (suburban): math 54% / reading 79% proficiency, ranked #28 of 539 in PA (top 5%) — acceptable for families but not a draw, mixed tenant base, ~2y average lease; only 10% free/reduced lunch — higher-income household profile.
- Market conditions: Rents rising (+1.9%/yr); 126 active listings in the ZIP; 17 comparable units currently listed for rent nearby; rentals leasing fast (median 13d on market — plan ~1-2 weeks tenant-placement turnaround); high-income renter base; 299 units permitted in Delaware County in 2024 (5 in 5+ unit buildings).
Forward outlook
- Local home prices are declining (-3.0%/yr); year-one equity from $670 of loan paydown is wiped out by about $3k of value loss. Plan a longer hold.
- At projected returns (-3.0% appreciation + 1.9% rent growth), your $27k cash investment doubles in ~3 years — after that, you're playing with house money.
Negotiation context
- Only 14 days on market — expect competitive offers; lowballing is unlikely to land.
Questions for the listing agent
- Have any recent inspections been done? Can we get a copy of the seller's disclosures and any deferred-maintenance estimates?
- Is there a deadline driving the sale (1031 exchange, divorce, estate, relocation)? That informs how much negotiation room exists.
- What's the average days-on-market for RENTAL listings here right now (not sales)? A rising rental-DOM trend means longer vacancies and softer asking-rent achievability than the comps imply.
- What's the recent tenant-quality profile in this submarket — average credit score on applications, eviction rate, late-payment / NSF rate, and stable-employment percentage? A property-management company in the area should have these aggregated.
- How much new for-sale + rental construction is in the pipeline within 1–3 miles? Heavy new supply typically softens prices + rents 12–24 months out; constrained supply supports both.
Investment metrics
- 1% rule
- 2.14% ✓
- Cap rate
- 18.30%
- Cash-on-cash
- 42.86%
- DSCR
- 2.91
- GRM
- 3.9
CMA / ARV
No comps found within radius.
Projected returns pro-forma
-3.0% appreciation · 1.91% rent growth · sell at horizon
- IRR
- 38.4%
- Equity multiple
- 2.61×
- Total profit
- $43,806
- Equity at exit
- $14,448
- IRR
- 44.4%
- Equity multiple
- 5.01×
- Total profit
- $108,721
- Equity at exit
- $8,378
Cash invested: $27,132 (down + closing). Projections, not guarantees.
Landlord ↔ Tenant lean methodology
- Overall (STATE)
- 62 Landlord-Friendly
- State Pennsylvania
- 62 Landlord-Friendly · EVEN
- County
- — inherits STATE
- City
- — inherits STATE
ZIP-level market 19063
- Rents YoY
- 1.9%
- Active inventory
- 126
- Price-to-rent
- 3.9×
Monthly cashflow live
- Estimated rent
- $2,074 high interval (Pro) →
- Mortgage (P&I)
- −$508
- Tax est. 1.5%
- −$121 /mo · $1,454/yr
- Insurance
- −$40
- HOA
- −$0
- Vacancy / Maint / Mgmt
- −$436
- Net cashflow
- $969
Break-even live
UW: 25.0% down · 7.5% · 30yr · 1.5% tax · 5.0% vac · 8.0% maint · 8.0% mgmt
Financing live
Cash to close
- Down payment
- $24,225
- Closing costs
- $2,907
- Reserves months
- —
- Total cash needed
- —
Loan-product check · same deal, 3 products live
Conventional
25% down · 7.5% · 30yr
- Down + closing
- —
- Monthly P&I
- —
- Monthly cashflow
- —
- DSCR
- —
- Eligible?
- —
Personal DTI + credit; lowest rate.
DSCR
20% down · 8.5% · 30yr
- Down + closing
- —
- Monthly P&I
- —
- Monthly cashflow
- —
- DSCR
- —
- Eligible?
- —
No personal income docs; deal must DSCR.
Hard money
10% down · 12.0% · 12mo
- Down + closing
- —
- Monthly P&I
- —
- Monthly cashflow
- —
- DSCR
- —
- Eligible?
- —
Short-term bridge; refi at stabilization.
Rent comps 17 comps
| Address | Beds | Baths | Sqft | Rent | $/sqft | DOM | Units | Dist |
|---|---|---|---|---|---|---|---|---|
| 340 Media Station Rd Unit A106 Media, PA | 1.0 | 1.0 | 755 | $1,980 | $2.62 | 43d | 1 | 0.32mi |
| 30 E Jefferson St Media, PA | 1.0 | 1.0 | 705 | $1,447 | $2.05 | 5d | 1 | 0.50mi |
| 420 W Jefferson St Unit B Media, PA | 2.0 | 1.0 | 800 | $1,615 | $2.02 | 43d | 1 | 0.50mi |
| 402 Wallingford Ave Media, PA | 2.0 | 1.0 | 1000 | $2,595 | $2.60 | 16d | 1 | 0.50mi |
| 418 W Jefferson St Unit 1 Media, PA | 2.0 | 1.0 | 640 | $1,595 | $2.49 | 1d | 1 | 0.51mi |
| 302 S Orange St Unit First floor Media, PA | 1.0 | 1.0 | 700 | $2,000 | $2.86 | 43d | 1 | 0.53mi |
| 302 S Orange St Media, PA | 2.0 | 1.0 | 850 | $2,500 | $2.94 | 1d | 1 | 0.53mi |
| 407 Emerald St Media, PA | 3.0 | 1.0 | 1050 | $2,750 | $2.62 | 23d | 1 | 0.62mi |
| 448 Vernon St Media, PA | 2.0 | 1.0 | 656 | $2,015 | $3.07 | 2d | 1 | 0.63mi |
| 100 W Front St Unit 2B Media, PA | 2.0 | 1.0 | 1000 | $3,050 | $3.05 | 4d | 1 | 0.71mi |
| 100 W Front St Unit 1A Media, PA | 1.0 | 1.0 | 750 | $2,400 | $3.20 | 43d | 1 | 0.71mi |
| 100 W Front St Unit 3A Media, PA | 1.0 | 1.0 | 750 | $2,150 | $2.87 | 11d | 1 | 0.71mi |
| 306 E Front St Unit 2ND FLOOR Media, PA | 1.0 | 1.0 | 900 | $2,075 | $2.31 | 24d | 1 | 0.87mi |
| 412 N Jackson St Media, PA | 2.0 | 1.0 | 925 | $2,500 | $2.70 | 1d | 1 | 0.96mi |
| 27 Wallingford Ave Unit D-2 Wallingford, PA | 2.0 | 1.0 | 1000 | $1,750 | $1.75 | 5d | 1 | 1.05mi |
| 317 Mount Alverno Rd Media, PA | 2.0 | 1.0 | 1000 | $1,750 | $1.75 | 43d | 1 | 1.32mi |
| 809 N Providence Rd Media, PA | 2.0 | 1.5 | 980 | $2,250 | $2.30 | 12d | 1 | 1.34mi |
Listing history 9 events
-
2026-06-18days on market $96,900 Active 14 DOM
-
2026-06-17days on market $96,900 Active 13 DOM
-
2026-06-16days on market $96,900 Active 12 DOM
-
2026-06-15days on market $96,900 Active 11 DOM
-
2026-06-13days on market $96,900 Active 9 DOM
-
2026-06-13days on market $96,900 Active 8 DOM
-
2026-06-09days on market $96,900 Active 5 DOM
-
2026-06-08days on market $96,900 Active 4 DOM
-
2026-06-07$96,900 Active 3 DOM
ⓘ Source: listings_history table (triggers on properties + properties_extension) + one-shot
backfill from property_details.listing_events for pre-trigger history.
Nearby sold comps map
Loading sold comps map…
Walkable amenities ~0.75 mi
Loading nearby amenities…
Taxation est. · year 1
- Rental income
- $24,894
- − Mortgage interest
- −$5,428
- − Property taxes
- −$1,454
- − Insurance
- −$484
- − Repairs & maintenance
- −$1,991
- − Management
- −$1,991
- − Depreciation
- −$2,819
- Taxable income
- $10,726
- Est. tax owed @ 24.0%
- −$2,574
- After-tax cash flow
- $9,056/yr
For passive investors: Depreciation is non-cash, so a rental often shows a tax loss while cash-flowing — sheltering income. Rental losses are passive: they offset passive income freely, and up to $25,000/yr can offset ordinary (W-2) income if you actively participate and your MAGI is under $100k (phasing out to $0 by $150k); unused losses carry forward. On sale, claimed depreciation is recaptured at up to 25%, and gains may owe capital-gains tax (a 1031 exchange can defer both). Figures are a year-1 estimate at your 24.0% rate — not tax advice; consult a CPA.
Condition & rehab AI · 1 photo
This manufactured home requires extensive repairs and updates across all systems and areas, significantly impacting its value and marketability.
Repairs flagged
- Major roof — No visible roof structure
- Major exterior — No visible siding or paint
- Major flooring — No visible flooring
- Major interior walls/paint — No visible interior walls or paint
- Major bathrooms — No visible bathrooms
- Major kitchen — No visible kitchen
- Major systems — No visible HVAC or mechanical systems
- Major landscaping/curb appeal — No visible landscaping or curb appeal
Value-add opportunities
- Both roof replacement — Critical to the home's structural integrity and appearance
- Both exterior siding and paint — Improves curb appeal and home value
- Both flooring and interior walls/paint — Enhances the home's livability and aesthetic appeal
- Both bathroom and kitchen updates — Modernizes the home and increases its marketability
- Both HVAC and mechanical systems — Ensures comfort and energy efficiency
- Both landscaping and curb appeal — Enhances the home's curb appeal and overall aesthetic
Renovation cost estimate screening
| Repair item | Severity | Est. cost |
|---|---|---|
| roof · No visible roof structure | Major | $15,000–50,000 |
| exterior · No visible siding or paint | Major | $15,000–50,000 |
| flooring · No visible flooring | Major | $15,000–50,000 |
| interior walls/paint · No visible interior walls or paint | Major | $15,000–50,000 |
| bathrooms · No visible bathrooms | Major | $15,000–50,000 |
| kitchen · No visible kitchen | Major | $15,000–50,000 |
| systems · No visible HVAC or mechanical systems | Major | $15,000–50,000 |
| landscaping/curb appeal · No visible landscaping or curb appeal | Major | $15,000–50,000 |
| Total estimated repair cost · 8 items | $120,000–400,000 |
Value-add ROI direction
- Both roof replacement — Critical to the home's structural integrity and appearance ↑
- Both exterior siding and paint — Improves curb appeal and home value ↑
- Both flooring and interior walls/paint — Enhances the home's livability and aesthetic appeal ↑
- Both bathroom and kitchen updates — Modernizes the home and increases its marketability ↑
- Both HVAC and mechanical systems — Ensures comfort and energy efficiency ↑
- Both landscaping and curb appeal — Enhances the home's curb appeal and overall aesthetic ↑
ⓘ Cost ranges are severity-bucket heuristics (US national rule-of-thumb). Get contractor quotes + a written scope before underwriting a rehab budget.
Schools (NCES district)
- District
- Rose Tree Media SD
- NCES district ID
- 4220550
- Math proficiency
- 54% ▼ -11.00%
- Reading proficiency
- 79% ▼ -5.00%
- Median HH income
- $86,643
- Composite
- 59.87/100
- National rank
- #887
- State rank
- #28 of 539 in PA
Livability — Upper Providence
No livability data for this city. (Only ~50 U.S. cities are tracked.)
Census & demographics
- County
- Delaware County · 399,863 people
- Metro
- Philadelphia-Camden-Wilmington, PA-NJ-DE-MD
- Population (ZIP)
- 38,172
- Household income
- $127,368
- Rent vs Own
- Severe rent burden
- 1358.0
Population outlook (Delaware County) Hauer SSP2
- Today (2025)
- 577,490 people
- By 2030
- 581,243 · +0.6%
- By 2040
- 584,700 · +1.2%
- By 2050
- 586,581 · +1.6%
- By 2075
- 598,706 · +3.7%
- By 2100
- 590,823 · +2.3%
Race, ethnicity, and origin ACS 2023
- Neighborhood character
- Predominantly White (81%)
- Race & ethnicity
- White 81% Asian 8% Black 4% Two or more races 4% Hispanic / Latino 2%
- Common ancestry
- Romanian 5% Slovak 3% Lithuanian 2%
- Foreign-born
- 9% · China, Canada, Vietnam
- Languages at home
- 89% English-only · Other Asian/Pacific 2% Chinese 2% Spanish 2%
Political lean MEDSL · Delaware
- 2024 margin
- Strong D (+23.7) · D 61.4% · R 37.6% · Other 1.0%
- 2008→2024 swing
- +2.3pp toward D · 2008: 21.4pp · 2024: 23.7pp
- All cycles
- 2024: D+23.7 2020: D+26.7 2016: D+22.0 2012: D+21.8 2008: D+21.4
Not yet ingested
- Civics
- —
Market trends
- HPI YoY
- ▼ -310.16%
- Current HPI
- 304.78
- Rent YoY
- ▲ 1.91%
- Metro
- Philadelphia-Camden-Wilmington, PA-NJ-DE-MD
- State GDP YoY
- ▲ 1.68%
- F500 in state
- 34
Industry mix (Fortune 500 HQ in PA)
| Industry | F500 HQs | Revenue |
|---|---|---|
| Healthcare | 2 | $309B |
|
||
| Insurance | 2 | $27B |
|
||
| Telecommunications / Media | 1 | $124B |
|
||
| Industrial Distribution | 1 | $22B |
|
||
| Financial Services | 1 | $20B |
|
||
| Chemicals / Materials | 1 | $18B |
|
||
Cash-flow waterfall
monthlySold comps — $/sqft
last 12 mo · ≤1 miLoading sold comps…