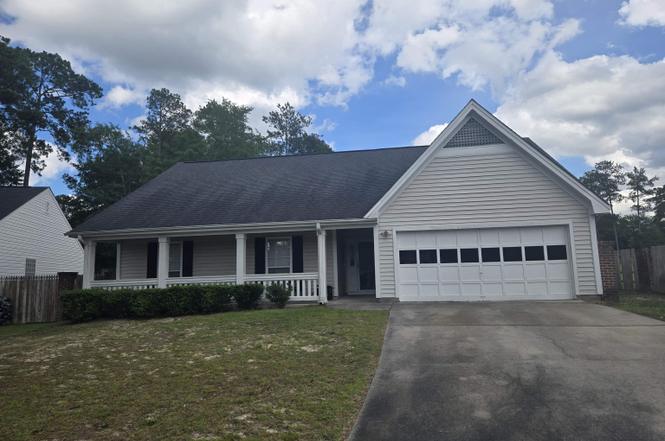
100 Millstone Ct · Dentsville, SC
Flood risk 1/10 · Minimal
- FEMA flood zone
- X (unshaded)
- Chance of flooding over 30 yrs
- 0.0%
- Est. flood insurance / yr
- $507 – $1,088
Fire risk 3/10 · Minor
- Est. fire insurance / yr
- $783 – $1,453
Heat risk 6/10 · Moderate
- Hot days now (above 108°F)
- 7 days/yr
- Hot days in 30 yrs
- 16 days/yr
Wind risk 6/10 · Moderate
- Chance of severe wind over 30 yrs
- 64.0%
Air-quality risk 3/10 · Minor
- Unhealthy air days now
- 3 days/yr
- Unhealthy air days in 30 yrs
- 3 days/yr
Risk factors via First Street. Map © Google.
Why this score? — see what drove the D grade
The composite is a weighted blend of 9 inputs, each scored 0–100. Each bar is that input's sub-score; the figure is the points it added to the 100-point composite (weight × sub-score).
- Cash flow +16.5/30.0
- ARV discount +7.5/15.0
- DSCR +5.1/10.0
- 1% rule +3.6/10.0
- Schools +3.6/10.0
- Livability +3.6/5.0
- Rent growth +2.6/5.0
- Condition / age +2.5/5.0
- Appreciation +0.0/10.0
$229,900
🖨 Deal sheet (PDF) 📄 Offer letter ✓ Due diligence
Listing remarks
This move-in ready gem offers a highly desirable open-concept floor plan and is tucked away in a peaceful cul-de-sac. You'll love the spacious, fully fenced backyard, perfect for entertaining, relaxing, or enjoying the newly added deck. The kitchen comes complete with all appliances, including a new gas range and dishwasher. Combining comfort, functionality, and exceptional value, this home is sure to attract attention. Don't miss your opportunity—schedule your showing today! Disclaimer: CMLS has not reviewed and, therefore, does not endorse vendors who may appear in listings.
Key facts
- New gas range
- New dishwasher
- Newly added deck
Tags
Property features AI
Finance
- Other: Paved road access; Approximately 0.5 acre lot; Directions: Off Hardscrabble Rd in Millbank subdivision onto Grinders Mill and left on Millstone Ct.
- HOA & community: Property is part of an association
Exterior
- Parking: Attached 2-car garage
- Utilities: Public water; Public sewer; Central heating; Central air conditioning
- Home design: Single-family property; Slab foundation
- Construction: Vinyl siding; Slab foundation
- Exterior features: Covered front porch; Deck; Vinyl exterior finish; Privacy wood fence
Interior
- Kitchen: Formica countertops; Stained wood cabinets; Dishwasher; Disposal; Refrigerator; Microwave above the stove; Gas range
- Bedrooms: Primary bedroom on the main level
- Bathrooms: Two full bathrooms
- Interior features: Ceiling fan; Wet bar; Gas fireplace with natural gas logs; Cathedral ceilings
- Laundry & utility: Utility room; Gas water heater
Neighborhood map
What this means for you Summary
Snapshot
- This is a 3-bed/2.0-bath single-family listed at $230k.
Deal economics
- At list price, monthly cash flow is $135 ($2k/yr) — positive.
- The deal already cash-flows at list — no discount required.
- To meet the 1% rule (rent ≥ 1% of price), the offer needs to be $198k (13.7% below list).
- Recommended offer: $198k (13.7% below list) — sets the bar for 1% rule.
Location & tenants
- Location reads 71/100 on livability (#50 in SC) — a middle-class / working-renter tenant base. Strengths: cost of living A+, health & safety A+, housing A; Watch: amenities D+, crime F, commute F.
- Richland 02 (suburban): math 35% / reading 47% proficiency, ranked #29 of 80 in SC (top 36%) — families likely to look elsewhere, expect single-tenant / working-renter base with shorter leases.
- Zoned schools: Killian Elementary (math 18% / reading 24%, grade F, #488 of 597 statewide, top 82%, 742 students, 100% FRL); Westwood High (math 47% / reading 87%, grade B, #73 of 196 statewide, top 41%, 1,684 students, 66% FRL) — zoned schools average 83% FRL vs 38% district-wide (45 pts higher); higher-poverty schools than district average — tighter screening recommended.
- Market conditions: Rents flat; 341 active listings in the ZIP; 19 comparable units currently listed for rent nearby; rentals leasing fast (median 4d on market — plan ~1-2 weeks tenant-placement turnaround); 3,472 units permitted in Richland County in 2024 (1,096 in 5+ unit buildings).
- This rent runs 38% of the median local income ($62k/yr) — at the standard rent-burdened threshold; future hikes will face affordability resistance.
Forward outlook
- Local home prices are declining (-3.0%/yr); year-one equity from $2k of loan paydown is wiped out by about $7k of value loss. Plan a longer hold.
- Richland County population projected at +30% by 2050 — long-run rental-demand tailwind backs the buy-and-hold thesis.
Negotiation context
- Only 1 days on market — expect competitive offers; lowballing is unlikely to land.
- Current owner paid $118k; list at $230k implies a 95% gain — meaningful room to come down on a strong offer.
Risks & watch-outs
- Climate carrying-cost: major wind risk, 64% chance of damaging wind over 30y; extreme-heat days projected 7→16/yr by 2055 (HVAC capex compounding) — expect insurance premiums to compound above CPI over the hold.
Questions for the listing agent
- What does the HOA fee cover, when was the last increase, and are there any pending special assessments or reserve-fund shortfalls?
- Is there a deadline driving the sale (1031 exchange, divorce, estate, relocation)? That informs how much negotiation room exists.
- Schools are D-rated, which usually means shorter tenancies and higher turnover. Who's the typical renter profile here, and what's been the actual vacancy rate?
- Crime grade is F in this area — have there been break-ins, vandalism, or insurance claims at this property in the last 3 years? What carrier currently insures it and at what premium?
- The area grade is low — what's the realistic commute time and amenity access for the typical tenant pool here? Any planned neighborhood developments (good or bad) we should know about?
- What's the average days-on-market for RENTAL listings here right now (not sales)? A rising rental-DOM trend means longer vacancies and softer asking-rent achievability than the comps imply.
- What's the recent tenant-quality profile in this submarket — average credit score on applications, eviction rate, late-payment / NSF rate, and stable-employment percentage? A property-management company in the area should have these aggregated.
- How much new for-sale + rental construction is in the pipeline within 1–3 miles? Heavy new supply typically softens prices + rents 12–24 months out; constrained supply supports both.
Investment metrics
- 1% rule
- 0.86% ✗
- Cap rate
- 7.00%
- Cash-on-cash
- 2.52%
- DSCR
- 1.11
- GRM
- 9.7
CMA / ARV
No comps found within radius.
Projected returns pro-forma
-3.0% appreciation · 0.21% rent growth · sell at horizon
- IRR
- -15.2%
- Equity multiple
- 0.47×
- Total profit
- $-34,128
- Equity at exit
- $34,279
- IRR
- -11.8%
- Equity multiple
- 0.38×
- Total profit
- $-39,933
- Equity at exit
- $19,878
Cash invested: $64,372 (down + closing). Projections, not guarantees.
Landlord ↔ Tenant lean methodology
- Overall (STATE)
- 90 Strongly Landlord-Friendly
- State South Carolina
- 90 Strongly Landlord-Friendly · R+6
- County
- — inherits STATE
- City
- — inherits STATE
ZIP-level market 29223
- Rents YoY
- 0.2%
- Active inventory
- 341
- Price-to-rent
- 9.7×
Monthly cashflow live
- Estimated rent
- $1,985 high interval (Pro) →
- Mortgage (P&I)
- −$1,206
- Tax from tax record
- −$123 /mo · $1,482/yr
- Insurance
- −$96
- HOA
- −$8
- Vacancy / Maint / Mgmt
- −$417
- Net cashflow
- $135
Break-even live
Sensitivity live
| Price | -10% $265 | -5% $200 | +0% $135 | +5% $70 | +10% $5 |
|---|---|---|---|---|---|
| Rent | -10% $-22 | -5% $57 | +0% $135 | +5% $214 | +10% $292 |
| Rate | -1.0pp $251 | -0.5pp $194 | base $135 | +0.5pp $76 | +1.0pp $15 |
UW: 25.0% down · 7.5% · 30yr · 1.5% tax · 5.0% vac · 8.0% maint · 8.0% mgmt
Financing live
Cash to close
- Down payment
- $57,475
- Closing costs
- $6,897
- Reserves months
- —
- Total cash needed
- —
Loan-product check · same deal, 3 products live
Conventional
25% down · 7.5% · 30yr
- Down + closing
- —
- Monthly P&I
- —
- Monthly cashflow
- —
- DSCR
- —
- Eligible?
- —
Personal DTI + credit; lowest rate.
DSCR
20% down · 8.5% · 30yr
- Down + closing
- —
- Monthly P&I
- —
- Monthly cashflow
- —
- DSCR
- —
- Eligible?
- —
No personal income docs; deal must DSCR.
Hard money
10% down · 12.0% · 12mo
- Down + closing
- —
- Monthly P&I
- —
- Monthly cashflow
- —
- DSCR
- —
- Eligible?
- —
Short-term bridge; refi at stabilization.
Rent comps 19 comps
| Address | Beds | Baths | Sqft | Rent | $/sqft | DOM | Units | Dist |
|---|---|---|---|---|---|---|---|---|
| 113 Millhouse Ct Columbia, SC | 3.0 | 2.0 | 1936 | $2,030 | $1.05 | 19d | 1 | 0.13mi |
| 2 Majestic Ct Columbia, SC | 4.0 | 2.5 | 2156 | $2,479 | $1.15 | 24d | 1 | 0.31mi |
| 18 Rosepine Dr Columbia, SC | 4.0 | 2.0 | 1600 | $1,985 | $1.24 | 3d | 1 | 0.36mi |
| 1340 N Brickyard Rd Columbia, SC | 1.0–3.0 | 1.0–2.0 | 1061 | $1,860 | $1.75 | 3d | 34 | 0.50mi |
| 916 N Brickyard Rd Columbia, SC | 3.0 | 2.0 | 1350 | $1,695 | $1.26 | 14d | 1 | 0.66mi |
| 621 Heron Glen Dr Columbia, SC | 4.0 | 2.5 | 2195 | $2,095 | $0.95 | 3d | 1 | 0.76mi |
| 109 Summer Vale Dr Columbia, SC | 4.0 | 2.5 | 1800 | $2,150 | $1.19 | 3d | 1 | 0.86mi |
| 1800 Killian Lakes Dr Columbia, SC | 1.0–3.0 | 1.0–2.5 | 1401 | $2,657 | $1.90 | 3d | 47 | 0.89mi |
| 502 Blue Garden Way Columbia, SC | 4.0 | 2.5 | 1775 | $2,183 | $1.23 | 14d | 1 | 0.95mi |
| 495 Blue Garden Way Columbia, SC | 4.0 | 2.5 | 2075 | $2,224 | $1.07 | 3d | 1 | 0.98mi |
| 500 Rockhaven Dr Columbia, SC | 3.0 | 2.0 | 1064 | $1,649 | $1.55 | 24d | 1 | 1.01mi |
| 9641 Farrow Rd Columbia, SC | 2.0–3.0 | 2.0 | 1179 | $1,872 | $1.59 | 3d | 32 | 1.05mi |
| 508 Longtown Rd Columbia, SC | 1.0–3.0 | 1.0–2.0 | 984 | $1,316 | $1.34 | 3d | 26 | 1.18mi |
| 13 Tomafield Ct Columbia, SC | 3.0 | 2.0 | 1721 | $2,000 | $1.16 | 3d | 1 | 1.19mi |
| 21 Winslow Ct Columbia, SC | 3.0 | 2.0 | 1220 | $1,649 | $1.35 | 21d | 1 | 1.22mi |
| 109 Jaybird Ln Columbia, SC | 3.0 | 2.0 | 1250 | $1,679 | $1.34 | 3d | 1 | 1.39mi |
| 113 Charleswood Dr Columbia, SC | 4.0 | 1.5 | 1196 | $1,555 | $1.30 | 3d | 1 | 1.41mi |
| 125 Charleswood Dr Columbia, SC | 3.0 | 1.0 | 1074 | $1,350 | $1.26 | 24d | 1 | 1.41mi |
| 2250 Hard Scrabble Rd Columbia, SC | 1.0–3.0 | 1.0–2.0 | 1155 | $2,311 | $2.00 | 11d | 18 | 1.47mi |
HOA detail
- Monthly dues
- $8 · $96/yr
- Likely covers
- gas
Listing history 2 events
-
2026-06-19remarks 584-char remark
-
2026-06-19$229,900 Active 1 DOM
ⓘ Source: listings_history table (triggers on properties + properties_extension) + one-shot
backfill from property_details.listing_events for pre-trigger history.
Tax reassessment forecast SC · Resets to sale price
- Current annual tax
- $1,482 · $123/mo
- Projected year-2 tax
- $1,482 · $123/mo
- Expected delta
- $0/yr ($0/mo · 0.0%)
ⓘ Screening estimate from a state-policy table — verify with the county assessor before closing.
Climate risk First Street
- Flood 1/10 Low FEMA zone X (unshaded) · 0% chance over 30 yrs
- Wildfire 3/10 Moderate
- Heat 6/10 Major 7 d/yr ≥108°F today · 16 d/yr by 30 yrs out
- Wind 6/10 Major 64% chance of damaging wind over 30 yrs
- Air quality 3/10 Moderate 3 unhealthy d/yr today · 3 by 30 yrs out
Nearby sold comps map
Loading sold comps map…
Walkable amenities ~0.75 mi
Loading nearby amenities…
Taxation est. · year 1
- Rental income
- $23,819
- − Mortgage interest
- −$12,878
- − Property taxes
- −$1,482
- − Insurance
- −$1,150
- − Repairs & maintenance
- −$1,906
- − Management
- −$1,906
- − HOA
- −$96
- − Depreciation
- −$6,688
- Taxable loss
- −$2,285
- Est. tax savings @ 24.0%
- +$548
- After-tax cash flow
- $2,171/yr
For passive investors: Depreciation is non-cash, so a rental often shows a tax loss while cash-flowing — sheltering income. Rental losses are passive: they offset passive income freely, and up to $25,000/yr can offset ordinary (W-2) income if you actively participate and your MAGI is under $100k (phasing out to $0 by $150k); unused losses carry forward. On sale, claimed depreciation is recaptured at up to 25%, and gains may owe capital-gains tax (a 1031 exchange can defer both). Figures are a year-1 estimate at your 24.0% rate — not tax advice; consult a CPA.
Schools (NCES district)
- District
- Richland 02
- NCES district ID
- 4503390
- Math proficiency
- 35% ▼ -15.00%
- Reading proficiency
- 47% ▼ -5.00%
- Median HH income
- $59,684
- Composite
- 36.2/100
- National rank
- #4730
- State rank
- #29 of 80 in SC
Livability — Dentsville
- Score
- 71/100
- State rank
- #50
- US rank
- #6940
Category grades
Schools grade is shown separately in the Schools card above.
Census & demographics
- County
- Richland County · 389,530 people
- City population
- 52,835
- Metro
- Columbia, SC
- Population (ZIP)
- 53,074
- Household income
- $62,408
- Rent vs Own
- Severe rent burden
- 2857.0
Population outlook (Richland County) Hauer SSP2
- Today (2025)
- 459,667 people
- By 2030
- 487,524 · +6.1%
- By 2040
- 542,035 · +17.9%
- By 2050
- 595,371 · +29.5%
- By 2075
- 732,998 · +59.5%
- By 2100
- 820,415 · +78.5%
Race, ethnicity, and origin ACS 2023
- Neighborhood character
- Diverse neighborhood (Simpson 0.60)
- Race & ethnicity
- Black 57% White 23% Hispanic / Latino 11% Two or more races 6% Asian 4%
- Hispanic origin (detail)
- Mexican 5% Puerto Rican 2%
- Common ancestry
- Slovak 1% Serbian 1% Italian 1%
- Foreign-born
- 10% · Canada, South Korea
- Languages at home
- 86% English-only · Spanish 8% Other Indo-European 2% Korean 1%
Political lean MEDSL · Richland
- 2024 margin
- Solid D (+34.6) · D 66.4% · R 31.8% · Other 1.8%
- 2008→2024 swing
- +5.7pp toward D · 2008: 28.9pp · 2024: 34.6pp
- All cycles
- 2024: D+34.6 2020: D+38.3 2016: D+32.9 2012: D+33.3 2008: D+28.9
Not yet ingested
- Civics
- —
Market trends
- HPI YoY
- ▼ -135.96%
- Current HPI
- 195.3158
- Rent YoY
- ▲ 0.21%
- Metro
- Columbia, SC
- State GDP YoY
- ▲ 4.51%
- F500 in state
- 2
Industry mix (Fortune 500 HQ in SC)
| Industry | F500 HQs | Revenue |
|---|---|---|
| Packaging | 1 | $7B |
|
||
Price history
+1336.9% since first listed5 events — show timeline
- 2026-06-18 Listed $229,900 Consolidated MLS
- 2004-08-27 Sold (Public Records) $117,900 Public Records
- 1993-11-15 Sold (Public Records) $97,000 Public Records
- 1990-06-04 Sold (Public Records) $89,275 Public Records
- 1990-04-02 Sold (Public Records) $16,000 Public Records
Property tax history
+1.4%/yrLatest (2025): $1,482 · +3.6% YoY. Source: county tax records.
Cash-flow waterfall
monthlySold comps — $/sqft
last 12 mo · ≤1 miLoading sold comps…