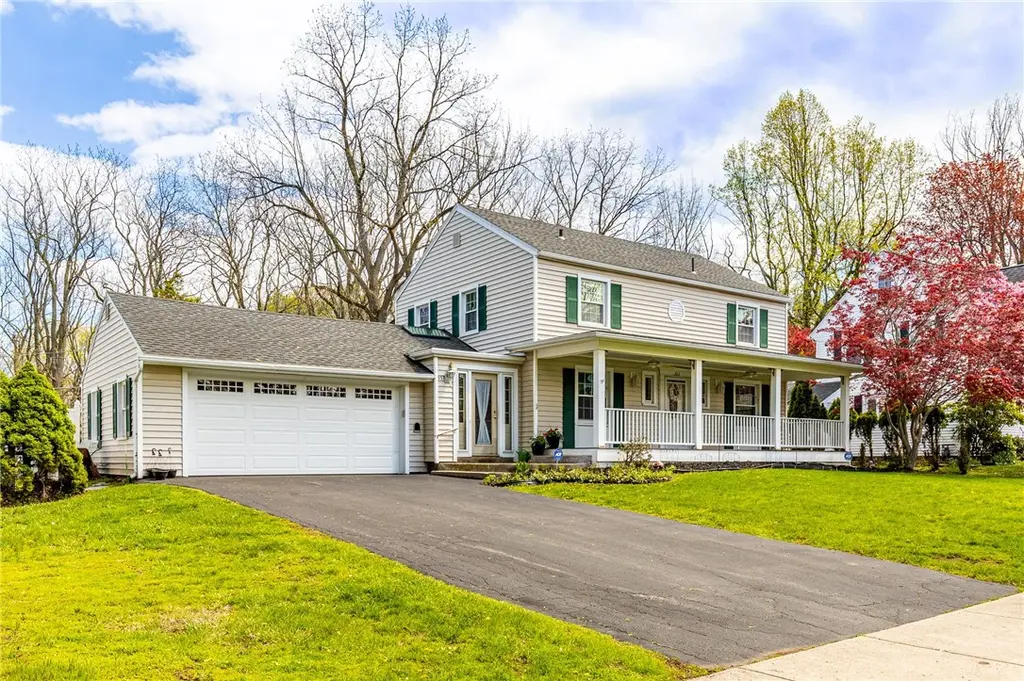
353 Pinecrest Dr · Irondequoit, NY
Flood risk 1/10 · Minimal
- FEMA flood zone
- X (unshaded)
- Chance of flooding over 30 yrs
- 0.0%
- Est. flood insurance / yr
- $473 – $860
Fire risk 2/10 · Minimal
- Est. fire insurance / yr
- $691 – $1,283
Heat risk 2/10 · Minimal
- Hot days now (above 95°F)
- 6 days/yr
- Hot days in 30 yrs
- 14 days/yr
Wind risk 1/10 · Minimal
- Chance of severe wind over 30 yrs
- —
Air-quality risk 2/10 · Minimal
- Unhealthy air days now
- 1 days/yr
- Unhealthy air days in 30 yrs
- 2 days/yr
Risk factors via First Street. Map © Google.
Why this score? — see what drove the D+ grade
The composite is a weighted blend of 9 inputs, each scored 0–100. Each bar is that input's sub-score; the figure is the points it added to the 100-point composite (weight × sub-score).
- ARV discount +12.6/15.0
- Cash flow +12.4/30.0
- Schools +6.2/10.0
- 1% rule +4.5/10.0
- Livability +4.0/5.0
- DSCR +3.7/10.0
- Rent growth +2.5/5.0
- Condition / age +2.5/5.0
- Appreciation +0.0/10.0
$349,900
🖨 Deal sheet (PDF) 📄 Offer letter ✓ Due diligence
Listing remarks
OWNER OF OVER 50 YEARS. ONE OF IRONDEQUOIT'S MOST DESIRABLE NEIGHBORHOODS. 3 LARGE BDRMS, FULL FRONT PORCH, BLT-IN POOL WITH RECENT LINER & MESH COVER. UPDATED ROOF, C-AIR, GARAGE DOOR W/ OPENER, NEWER REFRIGERATOR, DISHWASHER, MICRO-WAVE. REFINISHED FIRST FLOOR HARDWOODS & MORE. CLOSE TO COLEBROOK & IROQUOIS SCHOOLS. A MUST SEE! OPEN HOUSE SUNDAY, JUNE 7TH 1:00-2:30
Key facts
- Full front porch
- C-air
- Dishwasher
Tags
Property features AI
Exterior
- Parking: Attached garage with garage door opener; 2 garage spaces
- Utilities: Cable available; Public water connected; Sewer connected; Circuit breaker electrical
- Home design: 2-story existing home; Rectangular residential lot; Road frontage on city street
- Construction: Vinyl siding; Block foundation; Composition roof; Copper plumbing; Built existing (year built details: existing)
- Exterior features: Blacktop driveway; In-ground pool; Shed(s) and storage
Interior
- Kitchen: Dishwasher; Electric oven; Electric range; Disposal; Refrigerator; Gas water heater
- Bedrooms: Total rooms: 7; Includes living room, recreation room, family room; Has basement with partially finished space
- Flooring: Ceramic tile; Hardwood; Laminate; Luxury vinyl; Tile; Varies
- Bathrooms: 2 full bathrooms; 1 half bathroom; 1 main-level bathroom
- Heating & cooling: Gas heating; Central air conditioning
- Interior features: Eat-in kitchen; Separate/formal living room; Pull-down attic stairs; Skylights; Thermal windows
Neighborhood map
What this means for you Summary
Snapshot
- This is a 3-bed/1.5-bath single-family listed at $350k.
Deal economics
- At list price, monthly cash flow is $-59 ($-712/yr) — negative.
- To cash-flow at today's rent, offer at most $339k (3.0% below list).
- To meet the 1% rule (rent ≥ 1% of price), the offer needs to be $332k (5.1% below list).
- Recommended offer: $332k (5.1% below list) — sets the bar for 1% rule.
- Cap rate 6.1% vs local median 4.5% in Irondequoit — top-decile yield for the area; either an underpriced asset or a hidden risk that comps aren't pricing in. Stress-test before assuming the spread holds.
Location & tenants
- Location reads 81/100 on livability (#92 in NY, #1,414 nationally) — a professional / high-income tenant draw. Strengths: housing A+, health & safety A+, crime B+; Watch: amenities F.
- West Irondequoit Central School District (suburban): math 73% / reading 70% proficiency, ranked #126 of 590 in NY (top 21%) — strong family-tenant draw, lease renewals of 3-5y typical; only 18% free/reduced lunch — higher-income household profile.
- Zoned schools: Irondequoit High School (math 96% / reading 64%, grade A, #509 of 1,100 statewide, top 46%, 1,163 students, 33% FRL).
- Market conditions: 104 active listings in the ZIP; 3 comparable units currently listed for rent nearby; rentals leasing fast (median 5d on market — plan ~1-2 weeks tenant-placement turnaround); solid renter incomes; 1,169 units permitted in Monroe County in 2024 (591 in 5+ unit buildings).
- This rent runs 44% of the median local income ($90k/yr) — at the standard rent-burdened threshold; future hikes will face affordability resistance.
Forward outlook
- Local home prices are declining (-3.0%/yr); year-one equity from $2k of loan paydown is wiped out by about $10k of value loss. Plan a longer hold.
- Monroe County population projected to shrink 6% by 2050 — rents likely to lag national; underwrite the cash flow, not the appreciation.
Negotiation context
- It's been on market 28 days — a 2% lower offer ($345k) is reasonable based on typical stale-listing flexibility.
Risks & watch-outs
- Watch-outs: built in 1948 — expect roof / HVAC / electrical / plumbing capex.
Questions for the listing agent
- What do current leases actually rent for vs. the listed asking? Can we see a recent rent roll and the last 12 months of T-12 income?
- Built in 1948 — when were the roof, HVAC, electrical panel, plumbing, and water heater last replaced?
- Is there a deadline driving the sale (1031 exchange, divorce, estate, relocation)? That informs how much negotiation room exists.
- Schools are B-rated — typically a magnet for longer-tenancy family renters. What's the average tenant stay here, and is there a school-zone premium baked into asking?
- The area grade is low — what's the realistic commute time and amenity access for the typical tenant pool here? Any planned neighborhood developments (good or bad) we should know about?
- What's the average days-on-market for RENTAL listings here right now (not sales)? A rising rental-DOM trend means longer vacancies and softer asking-rent achievability than the comps imply.
- What's the recent tenant-quality profile in this submarket — average credit score on applications, eviction rate, late-payment / NSF rate, and stable-employment percentage? A property-management company in the area should have these aggregated.
- How much new for-sale + rental construction is in the pipeline within 1–3 miles? Heavy new supply typically softens prices + rents 12–24 months out; constrained supply supports both.
Investment metrics
- 1% rule
- 0.95% ✗
- Cap rate
- 6.09%
- Cash-on-cash
- -0.73%
- DSCR
- 0.97
- GRM
- 8.8
CMA / ARV
- ARV (on-the-fly)
- $394,570
- Comps found
- 12
Show comp detail 12 sales within ~0.75 mi
| Address | Dist | Beds/Ba | Sqft | Sold | Price | $/sf | Match |
|---|---|---|---|---|---|---|---|
| 120 Hillhurst Ln | 0.29mi | 4/2.5 (+1) | 2,106 (-0%) | 14mo | $501,000 | $238 | 65 |
| 80 Rock Beach Rd | 0.22mi | 4/2.5 (+1) | 1,968 (-7%) | 10mo | $383,000 | $195 | 61 |
| 176 Harvington Dr | 0.27mi | 3/2.0 | 2,400 (+14%) | 8mo | $425,000 | $177 | 56 |
| 177 Pinecrest Dr | 0.24mi | 3/2.5 | 2,397 (+14%) | 12mo | $470,500 | $196 | 52 |
| 25 Pinecrest Dr | 0.42mi | 4/3.0 (+1) | 2,214 (+5%) | 13mo | $415,000 | $187 | 51 |
| 83 Rock Beach Rd | 0.21mi | 4/2.5 (+1) | 1,888 (-10%) | 17mo | $325,000 | $172 | 49 |
| 579 Lake Shore Blvd | 0.60mi | 3/1.5 | 1,877 (-11%) | 6mo | $230,000 | $123 | 48 |
| 4840 Saint Paul Blvd | 0.57mi | 3/1.5 | 1,938 (-8%) | 16mo | $265,000 | $137 | 46 |
| 314 Rock Beach Rd | 0.65mi | 4/3.0 (+1) | 2,226 (+6%) | 6mo | $860,000 | $386 | 45 |
| 75 Oakridge Dr | 0.73mi | 4/2.0 (+1) | 2,208 (+5%) | 11mo | $250,000 | $113 | 42 |
| 267 Mount Airy Dr | 0.66mi | 4/2.5 (+1) | 1,926 (-9%) | 10mo | $425,000 | $221 | 38 |
| 96 Thomas Ave | 0.70mi | 3/2.5 | 1,794 (-15%) | 2mo | $308,500 | $172 | 37 |
Match score weights: distance 35% · size 25% · config 20% · recency 20%. Top-matched comps best support the ARV.
Projected returns pro-forma
-3.0% appreciation · 3.0% rent growth · sell at horizon
- IRR
- -17.4%
- Equity multiple
- 0.38×
- Total profit
- $-60,266
- Equity at exit
- $52,171
- IRR
- -9.3%
- Equity multiple
- 0.42×
- Total profit
- $-56,481
- Equity at exit
- $30,253
Cash invested: $97,972 (down + closing). Projections, not guarantees.
Landlord ↔ Tenant lean methodology
- Overall (STATE)
- 15 Strongly Tenant-Friendly
- State New York
- 15 Strongly Tenant-Friendly · D+10
- County
- — inherits STATE
- City
- — inherits STATE
ZIP-level market 14617
- Active inventory
- 104
- Price-to-rent
- 8.8×
Monthly cashflow live
- Estimated rent
- $3,321 medium interval (Pro) →
- Mortgage (P&I)
- −$1,835
- Tax from tax record
- −$702 /mo · $8,425/yr
- Insurance
- −$146
- HOA
- −$0
- Vacancy / Maint / Mgmt
- −$697
- Net cashflow
- $-59
Break-even live
Sensitivity live
| Price | -10% $139 | -5% $40 | +0% $-59 | +5% $-158 | +10% $-257 |
|---|---|---|---|---|---|
| Rent | -10% $-322 | -5% $-191 | +0% $-59 | +5% $72 | +10% $203 |
| Rate | -1.0pp $117 | -0.5pp $30 | base $-59 | +0.5pp $-150 | +1.0pp $-242 |
UW: 25.0% down · 7.5% · 30yr · 1.5% tax · 5.0% vac · 8.0% maint · 8.0% mgmt
Financing live
Cash to close
- Down payment
- $87,475
- Closing costs
- $10,497
- Reserves months
- —
- Total cash needed
- —
Loan-product check · same deal, 3 products live
Conventional
25% down · 7.5% · 30yr
- Down + closing
- —
- Monthly P&I
- —
- Monthly cashflow
- —
- DSCR
- —
- Eligible?
- —
Personal DTI + credit; lowest rate.
DSCR
20% down · 8.5% · 30yr
- Down + closing
- —
- Monthly P&I
- —
- Monthly cashflow
- —
- DSCR
- —
- Eligible?
- —
No personal income docs; deal must DSCR.
Hard money
10% down · 12.0% · 12mo
- Down + closing
- —
- Monthly P&I
- —
- Monthly cashflow
- —
- DSCR
- —
- Eligible?
- —
Short-term bridge; refi at stabilization.
Rent comps 3 comps
| Address | Beds | Baths | Sqft | Rent | $/sqft | DOM | Units | Dist |
|---|---|---|---|---|---|---|---|---|
| 485 Oakridge Dr Rochester, NY | 3.0 | 1.5 | 1826 | $4,000 | $2.19 | 4d | 1 | 0.25mi |
| 58 Fairview Cres Rochester, NY | 4.0 | 1.5 | 2194 | $3,600 | $1.64 | 4d | 1 | 1.19mi |
| 4302 Lake Ave Unit 1 Rochester, NY | 3.0 | 1.5 | 1600 | $3,000 | $1.88 | 45d | 1 | 1.39mi |
Listing history 10 events
-
2026-06-10status $349,900 Pending 28 DOM
-
2026-06-09days on market $349,900 Active 28 DOM
-
2026-06-09days on market $349,900 Active 27 DOM
-
2026-06-07days on market $349,900 Active 26 DOM
-
2026-06-03days on market $349,900 Active 22 DOM
-
2026-06-03remarks 375-char remark
-
2026-06-03days on market $349,900 Active 21 DOM
-
2026-06-01days on market $349,900 Active 20 DOM
-
2026-05-31days on market $349,900 Active 19 DOM
-
2026-05-12$349,900 Active
ⓘ Source: listings_history table (triggers on properties + properties_extension) + one-shot
backfill from property_details.listing_events for pre-trigger history.
Tax reassessment forecast NY · Partial reset (capped growth)
- Current annual tax
- $8,425 · $702/mo
- Projected year-2 tax
- $8,425 · $702/mo
- Expected delta
- $0/yr ($0/mo · 0.0%)
ⓘ Screening estimate from a state-policy table — verify with the county assessor before closing.
Climate risk First Street
- Flood 1/10 Low FEMA zone X (unshaded) · 0% chance over 30 yrs
- Wildfire 2/10 Low
- Heat 2/10 Low 6 d/yr ≥95°F today · 14 d/yr by 30 yrs out
- Wind 1/10 Low
- Air quality 2/10 Low 1 unhealthy d/yr today · 2 by 30 yrs out
Nearby sold comps map
Loading sold comps map…
Walkable amenities ~0.75 mi
Loading nearby amenities…
Taxation est. · year 1
- Rental income
- $39,850
- − Mortgage interest
- −$19,600
- − Property taxes
- −$8,425
- − Insurance
- −$1,750
- − Repairs & maintenance
- −$3,188
- − Management
- −$3,188
- − Depreciation
- −$10,179
- Taxable loss
- −$6,479
- Est. tax savings @ 24.0%
- +$1,555
- After-tax cash flow
- $843/yr
For passive investors: Depreciation is non-cash, so a rental often shows a tax loss while cash-flowing — sheltering income. Rental losses are passive: they offset passive income freely, and up to $25,000/yr can offset ordinary (W-2) income if you actively participate and your MAGI is under $100k (phasing out to $0 by $150k); unused losses carry forward. On sale, claimed depreciation is recaptured at up to 25%, and gains may owe capital-gains tax (a 1031 exchange can defer both). Figures are a year-1 estimate at your 24.0% rate — not tax advice; consult a CPA.
Schools (NCES district)
- District
- West Irondequoit Central School District
- NCES district ID
- 3615390
- Math proficiency
- 73% ▲ 3.00%
- Reading proficiency
- 70% ▲ 5.00%
- Median HH income
- $60,218
- Composite
- 61.61/100
- National rank
- #748
- State rank
- #126 of 590 in NY
Livability — Irondequoit
- Score
- 81/100
- State rank
- #92
- US rank
- #1414
Category grades
Schools grade is shown separately in the Schools card above.
Census & demographics
- Census place
- Irondequoit, NY
- County
- Monroe County · 674,131 people
- City population
- 74,252
- Metro
- Rochester, NY
- Population (ZIP)
- 21,788
- Household income
- $90,192
- Rent vs Own
- Severe rent burden
- 426.0
Population outlook (Monroe County) Hauer SSP2
- Today (2025)
- 759,460 people
- By 2030
- 757,154 · -0.3%
- By 2040
- 740,644 · -2.5%
- By 2050
- 714,443 · -5.9%
- By 2075
- 645,883 · -15.0%
- By 2100
- 547,084 · -28.0%
Race, ethnicity, and origin ACS 2023
- Neighborhood character
- Predominantly White (85%)
- Race & ethnicity
- White 85% Hispanic / Latino 8% Two or more races 6% Black 4%
- Hispanic origin (detail)
- Puerto Rican 4%
- Common ancestry
- Romanian 6% Iranian 3% Lithuanian 3%
- Foreign-born
- 4% · Canada
- Languages at home
- 93% English-only · Spanish 4% Other Indo-European 1% Russian/Polish/Slavic 1%
Political lean MEDSL · Monroe
- 2024 margin
- D (+19.1) · D 59.5% · R 40.5%
- 2008→2024 swing
- +1.4pp toward D · 2008: 17.7pp · 2024: 19.1pp
- All cycles
- 2024: D+19.1 2020: D+21.0 2016: D+14.1 2012: D+17.4 2008: D+17.7
Not yet ingested
- Civics
- —
Market trends
- HPI YoY
- ▼ -148.22%
- Current HPI
- 263.9973
- Rent YoY
- —
- Metro
- Rochester, NY
- State GDP YoY
- ▲ 2.60%
- F500 in state
- 92
Industry mix (Fortune 500 HQ in NY)
| Industry | F500 HQs | Revenue |
|---|---|---|
| Financial Services | 10 | $950B |
|
||
| Consumer Goods | 9 | $162B |
|
||
| Insurance | 4 | $225B |
|
||
| Telecommunications | 2 | $144B |
|
||
| Pharmaceuticals | 2 | $112B |
|
||
| Media / Entertainment | 2 | $69B |
|
||
Price history
1 event — show timeline
- 2026-05-12 Listed $349,900 UNYREIS
Property tax history
+4.1%/yrLatest (2025): $8,425 · +29.0% YoY. Source: county tax records.
Cash-flow waterfall
monthlySold comps — $/sqft
last 12 mo · ≤1 miLoading sold comps…