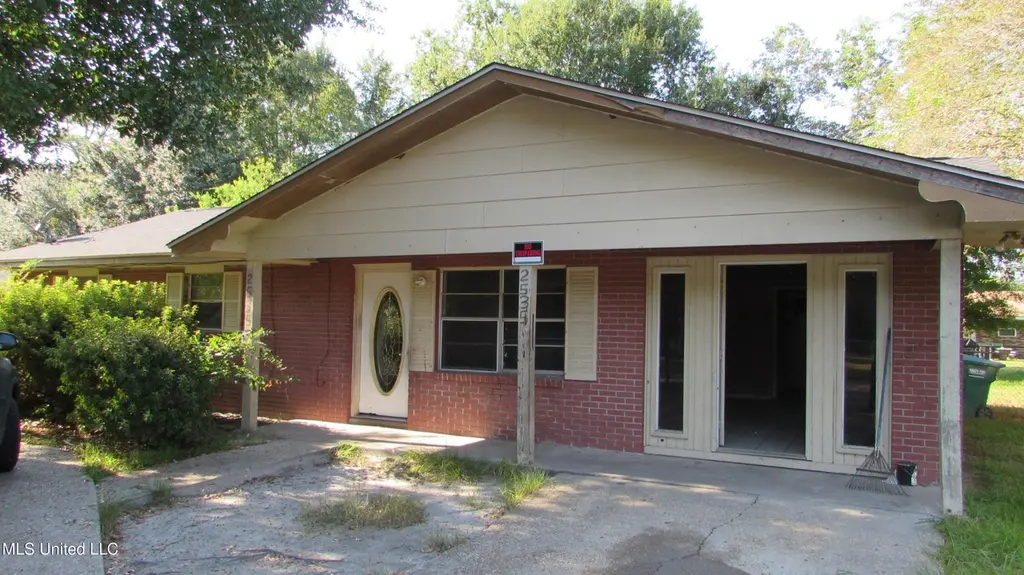
2535 Tandy Dr · Gulfport, MS
Flood risk 6/10 · Moderate
- FEMA flood zone
- X (unshaded)
- Chance of flooding over 30 yrs
- 0.7%
- Est. flood insurance / yr
- $507 – $1,088
Fire risk 3/10 · Minor
- Est. fire insurance / yr
- $1,241 – $2,305
Heat risk 10/10 · Severe
- Hot days now (above 107°F)
- 7 days/yr
- Hot days in 30 yrs
- 23 days/yr
Wind risk 9/10 · Severe
- Chance of severe wind over 30 yrs
- 99.0%
Air-quality risk 1/10 · Minimal
- Unhealthy air days now
- 0 days/yr
- Unhealthy air days in 30 yrs
- 0 days/yr
Risk factors via First Street. Map © Google.
Why this score? — see what drove the B+ grade
The composite is a weighted blend of 9 inputs, each scored 0–100. Each bar is that input's sub-score; the figure is the points it added to the 100-point composite (weight × sub-score).
- Cash flow +30.0/30.0
- ARV discount +15.0/15.0
- 1% rule +10.0/10.0
- DSCR +10.0/10.0
- Rent growth +4.2/5.0
- Schools +4.2/10.0
- Livability +3.7/5.0
- Condition / age +2.5/5.0
- Appreciation +0.0/10.0
$77,400
🖨 Deal sheet 📄 Offer letter ✓ Due diligence
Listing remarks MLS
Vacant selling as-is. Newer roof, circular driveway, 3/2 with brick exterior. No flood zone. Enclosed garage for added space. One full bath and one half bath. Part of a 28 home pkg. Fixer upper.
Key facts
- Enclosed garage
- Brick exterior
- Newer roof
Tags
Neighborhood map
What this means for you Summary
Snapshot
- This is a 3-bed/1.5-bath single-family listed at $77k.
Deal economics
- At list price, monthly cash flow is $688 ($8k/yr) — positive.
- The deal already cash-flows at list — no discount required.
- Meets the 1% rule at list price ($2k rent vs $77k).
- Recommended offer: $68k (12.0% below list) — sets the bar for market timing.
- Cap rate 17.0% vs local median 4.9% in Gulfport — top-decile yield for the area; either an underpriced asset or a hidden risk that comps aren't pricing in. Stress-test before assuming the spread holds.
Location & tenants
- Location reads 73/100 on livability (#15 in MS) — a middle-class / working-renter tenant base. Strengths: cost of living A+, housing A+, health & safety A+; Watch: schools D, amenities F, commute F.
- Harrison County School District (rural): math 52% / reading 46% proficiency, ranked #14 of 130 in MS (top 11%) — families likely to look elsewhere, expect single-tenant / working-renter base with shorter leases; 62% free/reduced lunch — lower-income household profile, screen leases tightly.
- Market conditions: Rents rising fast (+7.0%/yr); 763 active listings in the ZIP; 10 comparable units currently listed for rent nearby; rentals lingering (median 44d on market — plan ~5-8 weeks vacancy on turnover, expect pricing pressure); 60% of comp listings sitting > 30 days — soft ceiling on asking rent; 2,194 units permitted in Harrison County in 2024 (0 in 5+ unit buildings).
Forward outlook
- Local home prices are declining (-3.0%/yr); year-one equity from $535 of loan paydown is wiped out by about $2k of value loss. Plan a longer hold.
- Harrison County population projected at +27% by 2050 — long-run rental-demand tailwind backs the buy-and-hold thesis.
- At projected returns (-3.0% appreciation + 7.0% rent growth), your $22k cash investment doubles in ~3 years — after that, you're playing with house money.
Negotiation context
- It's been on market 249 days — a 12% lower offer ($68k) is reasonable based on typical stale-listing flexibility.
- 4 sale attempts since 13y ago; this cycle's ask has dropped $9k (10%) from the opening price — seller is motivated, your offer sets the floor, not the list.
- Current owner paid $28k; list at $77k implies a 176% gain — meaningful room to come down on a strong offer.
Risks & watch-outs
- Climate carrying-cost: major flood risk; severe wind risk, 99% chance of damaging wind over 30y; extreme-heat days projected 7→23/yr by 2055 (HVAC capex compounding) — expect insurance premiums to compound above CPI over the hold.
Questions for the listing agent
- It's been on market 249 days. Have you received any prior offers? Is the seller open to a 12% concession, seller financing, or rate buy-down credit?
- Built in 1976 — when were the roof, HVAC, electrical panel, plumbing, and water heater last replaced?
- Why hasn't it sold? Are there any deal-killer items the seller is aware of (foundation, flood, title, zoning, code violations)?
- Is there a deadline driving the sale (1031 exchange, divorce, estate, relocation)? That informs how much negotiation room exists.
- Schools are D-rated, which usually means shorter tenancies and higher turnover. Who's the typical renter profile here, and what's been the actual vacancy rate?
- What's the average days-on-market for RENTAL listings here right now (not sales)? A rising rental-DOM trend means longer vacancies and softer asking-rent achievability than the comps imply.
- What's the recent tenant-quality profile in this submarket — average credit score on applications, eviction rate, late-payment / NSF rate, and stable-employment percentage? A property-management company in the area should have these aggregated.
- How much new for-sale + rental construction is in the pipeline within 1–3 miles? Heavy new supply typically softens prices + rents 12–24 months out; constrained supply supports both.
Investment metrics
- 1% rule
- 1.97% ✓
- Cap rate
- 16.95%
- Cash-on-cash
- 38.08%
- DSCR
- 2.69
- GRM
- 4.2
CMA / ARV
- ARV (median comp)
- $142,316
- List price
- $77,400
- Delta
- -45.61%
- Verdict
- UNDERPRICED
- Comps
- 20 within 1.0 mi
Show comp detail 12 sales within ~0.75 mi
| Address | Dist | Beds/Ba | Sqft | Sold | Price | $/sf | Match |
|---|---|---|---|---|---|---|---|
| 607 Temple Dr | 0.35mi | 3/2.0 | 1,450 (+4%) | 1mo | $95,000 | $66 | 75 |
| 2607 W Stevens Cir | 0.37mi | 3/1.5 | 1,429 (+2%) | 6mo | $139,000 | $97 | 74 |
| 2540 Tandy Dr | 0.04mi | 4/2.0 (+1) | 1,222 (-13%) | 2mo | $155,000 | $127 | 68 |
| 2513 Knox St | 0.35mi | 3/2.0 | 1,501 (+7%) | 2mo | $174,900 | $117 | 68 |
| 2627 W Angela Cir | 0.44mi | 3/1.5 | 1,278 (-9%) | 2mo | $124,900 | $98 | 64 |
| 2621 W Samuel St | 0.19mi | 3/1.5 | 1,215 (-13%) | 7mo | $160,000 | $132 | 63 |
| 12062 Jessica Cir | 0.67mi | 3/2.0 | 1,385 (-1%) | 4mo | $214,900 | $155 | 62 |
| 11333 Fairfield Ln | 0.60mi | 3/2.0 | 1,484 (+6%) | 4mo | $210,000 | $142 | 57 |
| 10604 E Bay Tree Dr | 0.46mi | 3/2.0 | 1,254 (-10%) | 7mo | $169,995 | $136 | 53 |
| 13004 Alta Vida Ct | 0.75mi | 4/2.0 (+1) | 1,339 (-4%) | 3mo | $214,900 | $160 | 48 |
| 10589 E Bay Tree Dr | 0.49mi | 3/2.0 | 1,192 (-15%) | 6mo | $152,200 | $128 | 45 |
| 7 Harvest Ln | 0.63mi | 3/2.0 | 1,230 (-12%) | 6mo | $175,000 | $142 | 44 |
Match score weights: distance 35% · size 25% · config 20% · recency 20%. Top-matched comps best support the ARV.
Projected returns pro-forma
-3.0% appreciation · 6.99% rent growth · sell at horizon
- IRR
- 38.5%
- Equity multiple
- 2.74×
- Total profit
- $37,623
- Equity at exit
- $11,541
- IRR
- 46.9%
- Equity multiple
- 6.42×
- Total profit
- $117,522
- Equity at exit
- $6,692
Cash invested: $21,672 (down + closing). Projections, not guarantees.
Landlord ↔ Tenant lean methodology
- Overall (STATE)
- 90 Strongly Landlord-Friendly
- State Mississippi
- 90 Strongly Landlord-Friendly · R+11
- County
- — inherits STATE
- City
- — inherits STATE
ZIP-level market 39503
- Home prices YoY
- -21.5%
- Rents YoY
- 7.0%
- Active inventory
- 763
- Price-to-rent
- 4.2×
Monthly cashflow live
- Estimated rent
- $1,522 high interval (Pro) →
- Mortgage (P&I)
- −$406
- Tax from tax record
- −$77 /mo · $921/yr
- Insurance
- −$32
- HOA
- −$0
- Vacancy / Maint / Mgmt
- −$320
- Net cashflow
- $688
Break-even live
UW: 25.0% down · 7.5% · 30yr · 1.5% tax · 5.0% vac · 8.0% maint · 8.0% mgmt
Financing live
Cash to close
- Down payment
- $19,350
- Closing costs
- $2,322
- Reserves months
- —
- Total cash needed
- —
Loan-product check · same deal, 3 products live
Conventional
25% down · 7.5% · 30yr
- Down + closing
- —
- Monthly P&I
- —
- Monthly cashflow
- —
- DSCR
- —
- Eligible?
- —
Personal DTI + credit; lowest rate.
DSCR
20% down · 8.5% · 30yr
- Down + closing
- —
- Monthly P&I
- —
- Monthly cashflow
- —
- DSCR
- —
- Eligible?
- —
No personal income docs; deal must DSCR.
Hard money
10% down · 12.0% · 12mo
- Down + closing
- —
- Monthly P&I
- —
- Monthly cashflow
- —
- DSCR
- —
- Eligible?
- —
Short-term bridge; refi at stabilization.
Rent comps 10 comps
| Address | Beds | Baths | Sqft | Rent | $/sqft | DOM | Units | Dist |
|---|---|---|---|---|---|---|---|---|
| 10669 E Bay Tree Dr Gulfport, MS | 3.0 | 2.0 | 1200 | $1,425 | $1.19 | 21d | 1 | 0.47mi |
| 10596 E Bay Tree Dr Gulfport, MS | 2.0 | 2.0 | 1047 | $1,200 | $1.15 | 44d | 1 | 0.49mi |
| 13181 Warren Dr Gulfport, MS | 3.0 | 2.0 | 1188 | $1,375 | $1.16 | 44d | 1 | 0.50mi |
| 11310 Fairfield Ln Gulfport, MS | 3.0 | 2.0 | 1084 | $1,625 | $1.50 | 44d | 1 | 0.55mi |
| 12271 Dedeaux Rd Gulfport, MS | 3.0 | 1.5 | 1462 | $1,350 | $0.92 | 44d | 1 | 0.56mi |
| 13242 Warren Dr Gulfport, MS | 2.0 | 2.0 | 1012 | $1,100 | $1.09 | 44d | 1 | 0.62mi |
| 12062 Jessica Cir Gulfport, MS | 3.0 | 2.0 | 1385 | $1,700 | $1.23 | 13d | 1 | 0.64mi |
| 11312 Jessica Dr Gulfport, MS | 3.0 | 2.0 | 1092 | $1,625 | $1.49 | 21d | 1 | 0.70mi |
| 12147 Prudie Cir Gulfport, MS | 3.0 | 2.0 | 1100 | $975 | $0.89 | 44d | 1 | 1.40mi |
| 12040 Highland Ave Gulfport, MS | 3.0 | 2.0 | 1019 | $950 | $0.93 | 13d | 1 | 1.46mi |
Listing history 11 events
-
2026-05-30statusdays on market $77,400 Pending 249 DOM
-
2026-05-07status Active 200-char remark
Show marketing remark (200 chars)
Vacant selling as-is. Newer roof, circular driveway, 3/2 with brick exterior. No flood zone. Enclosed garage for added space. One full bath and one half bath. Part of a 28 home pkg. Fixer upper.
-
2026-05-07status Pending 200-char remark
Show marketing remark (200 chars)
Vacant selling as-is. Newer roof, circular driveway, 3/2 with brick exterior. No flood zone. Enclosed garage for added space. One full bath and one half bath. Part of a 28 home pkg. Fixer upper.
-
2026-05-01price $77,400 200-char remark
Show marketing remark (200 chars)
Vacant selling as-is. Newer roof, circular driveway, 3/2 with brick exterior. No flood zone. Enclosed garage for added space. One full bath and one half bath. Part of a 28 home pkg. Fixer upper.
-
2025-09-22$86,000 Active 200-char remark
Show marketing remark (200 chars)
Vacant selling as-is. Newer roof, circular driveway, 3/2 with brick exterior. No flood zone. Enclosed garage for added space. One full bath and one half bath. Part of a 28 home pkg. Fixer upper.
-
2021-10-01historical
-
2019-12-06$79,000
-
2014-04-30soldstatus $28,000
-
2014-03-28soldstatus
-
2013-02-07$51,000
-
2004-12-17soldstatus
ⓘ Source: listings_history table (triggers on properties + properties_extension) + one-shot
backfill from property_details.listing_events for pre-trigger history.
Tax reassessment forecast MS · Resets to sale price
- Current annual tax
- $921 · $77/mo
- Projected year-2 tax
- $921 · $77/mo
- Expected delta
- $0/yr ($0/mo · 0.0%)
ⓘ Screening estimate from a state-policy table — verify with the county assessor before closing.
Climate risk First Street
- Flood 6/10 Major FEMA zone X (unshaded) · 70% chance over 30 yrs
- Wildfire 3/10 Moderate
- Heat 10/10 Extreme 7 d/yr ≥107°F today · 23 d/yr by 30 yrs out
- Wind 9/10 Extreme 99% chance of damaging wind over 30 yrs
- Air quality 1/10 Low 0 unhealthy d/yr today · 0 by 30 yrs out
Nearby sold comps map
Loading sold comps map…
Walkable amenities ~0.75 mi
Loading nearby amenities…
Taxation est. · year 1
- Rental income
- $18,266
- − Mortgage interest
- −$4,336
- − Property taxes
- −$921
- − Insurance
- −$387
- − Repairs & maintenance
- −$1,461
- − Management
- −$1,461
- − Depreciation
- −$2,252
- Taxable income
- $7,449
- Est. tax owed @ 24.0%
- −$1,788
- After-tax cash flow
- $6,464/yr
For passive investors: Depreciation is non-cash, so a rental often shows a tax loss while cash-flowing — sheltering income. Rental losses are passive: they offset passive income freely, and up to $25,000/yr can offset ordinary (W-2) income if you actively participate and your MAGI is under $100k (phasing out to $0 by $150k); unused losses carry forward. On sale, claimed depreciation is recaptured at up to 25%, and gains may owe capital-gains tax (a 1031 exchange can defer both). Figures are a year-1 estimate at your 24.0% rate — not tax advice; consult a CPA.
Schools (NCES district)
- District
- Harrison County School District
- NCES district ID
- 2801770
- Math proficiency
- 52% ▼ -4.00%
- Reading proficiency
- 46% ▼ -4.00%
- Median HH income
- $46,504
- Composite
- 41.66/100
- National rank
- #3419
- State rank
- #14 of 130 in MS
Livability — Gulfport
- Score
- 73/100
- State rank
- #15
- US rank
- #5010
Category grades
Schools grade is shown separately in the Schools card above.
Census & demographics
- Census place
- Gulfport, MS
- County
- Harrison County · 178,171 people
- Metro
- Gulfport-Biloxi, MS
- Population (ZIP)
- 55,059
- Household income
- $62,641
- Rent vs Own
- Severe rent burden
- 1686.0
Population outlook (Harrison County) Hauer SSP2
- Today (2025)
- 228,444 people
- By 2030
- 241,942 · +5.9%
- By 2040
- 267,531 · +17.1%
- By 2050
- 291,062 · +27.4%
- By 2075
- 346,711 · +51.8%
- By 2100
- 378,165 · +65.5%
Race, ethnicity, and origin ACS 2023
- Neighborhood character
- Diverse neighborhood (Simpson 0.58)
- Race & ethnicity
- White 58% Black 27% Two or more races 9% Hispanic / Latino 6% Asian 2%
- Hispanic origin (detail)
- Mexican 2% Puerto Rican 1%
- Common ancestry
- Lithuanian 5% Slovak 1% Portuguese 1%
- Foreign-born
- 3% · Canada
- Languages at home
- 95% English-only · Spanish 3%
Political lean MEDSL · Harrison
- 2024 margin
- Strong R (+28.9) · D 35.0% · R 63.9% · Other 1.1%
- 2008→2024 swing
- -2.9pp toward R · 2008: -26.0pp · 2024: -28.9pp
- All cycles
- 2024: R+28.9 2020: R+25.2 2016: R+30.7 2012: R+26.6 2008: R+26.0
Not yet ingested
- Civics
- —
Market trends
- HPI YoY
- ▼ -51.39%
- Current HPI
- 187.285
- Rent YoY
- ▲ 6.99%
- Metro
- Gulfport-Biloxi, MS
- State GDP YoY
- —
- F500 in state
- 0
Price history
+51.8% since first listed10 events — show timeline
- 2026-05-07 Relisted — MLSU
- 2026-05-07 Pending — MLSU
- 2026-05-01 Price Changed $77,400 MLSU
- 2025-09-22 Listed $86,000 MLSU
- 2021-10-01 Listing Removed — MLSU
- 2019-12-06 Listed $79,000 MLSU
- 2014-04-30 Sold (Public Records) $28,000 Public Records
- 2014-03-28 Sold (MLS) — MLSU
- 2013-02-07 Listed $51,000 MLSU
- 2004-12-17 Sold (Public Records) — Public Records
Property tax history
+6.5%/yrLatest (2025): $921 · +3.8% YoY. Source: county tax records.
Cash-flow waterfall
monthlySold comps — $/sqft
last 12 mo · ≤1 miLoading sold comps…