7830 NW 33rd St #308 · Davie, FL
Flood risk 4/10 · Minor
- FEMA flood zone
- X (shaded)
- Chance of flooding over 30 yrs
- 0.22%
- Est. flood insurance / yr
- $507 – $1,088
Fire risk 1/10 · Minimal
- Est. fire insurance / yr
- $947 – $1,759
Heat risk 10/10 · Severe
- Hot days now (above 105°F)
- 7 days/yr
- Hot days in 30 yrs
- 27 days/yr
Wind risk 10/10 · Severe
- Chance of severe wind over 30 yrs
- 99.0%
Air-quality risk 2/10 · Minimal
- Unhealthy air days now
- 2 days/yr
- Unhealthy air days in 30 yrs
- 2 days/yr
Risk factors via First Street. Map © Google.
Why this score? — see what drove the D grade
The composite is a weighted blend of 9 inputs, each scored 0–100. Each bar is that input's sub-score; the figure is the points it added to the 100-point composite (weight × sub-score).
- Cash flow +11.8/30.0
- ARV discount +7.5/15.0
- 1% rule +5.7/10.0
- Schools +4.1/10.0
- Livability +4.1/5.0
- DSCR +3.5/10.0
- Rent growth +2.8/5.0
- Condition / age +2.5/5.0
- Appreciation +0.0/10.0
$209,750
🖨 Deal sheet (PDF) 📄 Offer letter ✓ Due diligence
Listing remarks
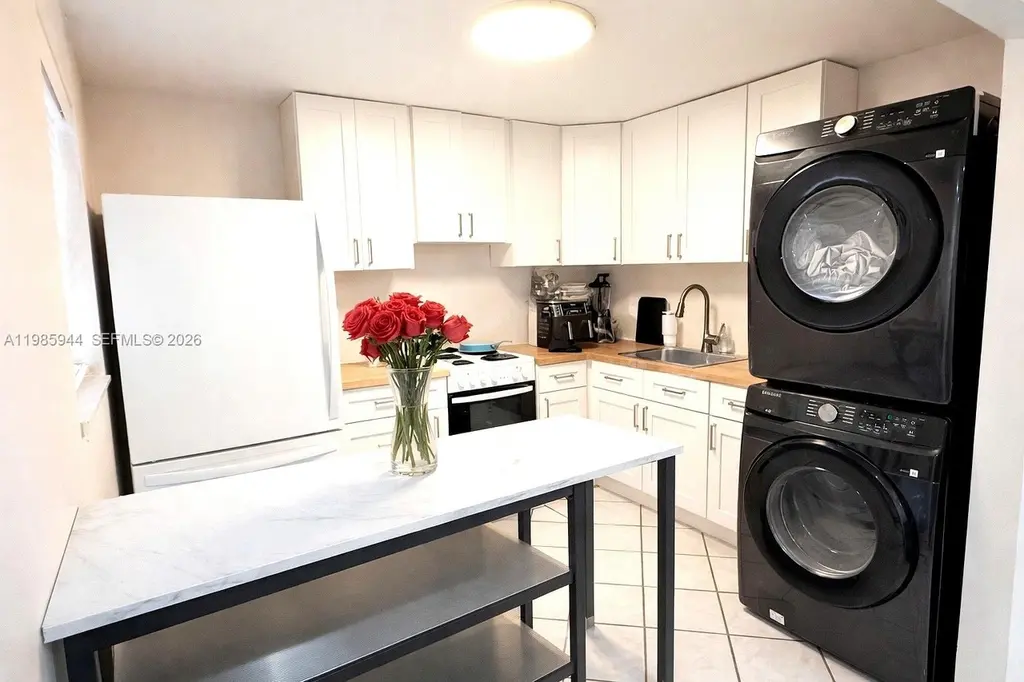
Photos coming soon! Move in ready 2 bed/2bath condo located on the second floor. This tastefully renovated unit features a new kitchen and appliances including an in unit washer and dryer hookups, new carpet in bedrooms and upgraded bathrooms. With a super low HOA of just $350/month and 2 assigned parking spaces this condo is perfect for both homeowners and investors. Rentals are allowed right away. Currently tenant occupied on a month to month basis. Don't miss this one!
Key facts
- New kitchen
- Rentals allowed
- Upgraded bathrooms
Tags
Property features AI
Finance
- Financial info: Pets allowed with restrictions
- HOA & community: Monthly association fee of $350; Association covers management, common areas, grounds and structural maintenance, parking, roof, sewer, trash, and water; Community amenities include barbecue and picnic area
Exterior
- Parking: Two or more parking spaces
- Home design: 2-story property; Entry on level 2; Attached property
- Construction: Block construction; Resale property
- Exterior features: Open balcony
Interior
- Kitchen: Electric range; Microwave; Refrigerator
- Flooring: Carpet; Tile
- Bathrooms: 2 full bathrooms
- Heating & cooling: Central heating (electric); Central air conditioning (electric)
- Interior features: Carpet and tile flooring; Additional interior features
- Laundry & utility: Washer and dryer
Neighborhood map
What this means for you Summary
Snapshot
- This is a 2-bed/2.0-bath condo listed at $210k.
Deal economics
- At list price, monthly cash flow is $-57 ($-688/yr) — negative.
- To cash-flow at today's rent, offer at most $200k (4.8% below list).
- Meets the 1% rule at list price ($2k rent vs $210k).
- Recommended offer: $191k (9.0% below list) — sets the bar for market timing.
- Cap rate 6.0% vs local median 3.4% in Davie — top-decile yield for the area; either an underpriced asset or a hidden risk that comps aren't pricing in. Stress-test before assuming the spread holds.
Location & tenants
- Location reads 82/100 on livability (#68 in FL, #1,159 nationally) — a professional / high-income tenant draw. Strengths: crime A+, housing A+, health & safety A+; Watch: cost of living D, amenities D-.
- Broward (suburban): math 42% / reading 53% proficiency, ranked #46 of 73 in FL (top 63%) — families likely to look elsewhere, expect single-tenant / working-renter base with shorter leases.
- Zoned schools: Nova Blanche Forman Elementary (math 35% / reading 55%, grade D-, #1,271 of 2,144 statewide, top 60%, 769 students, 72% FRL); Nova Middle School (math 44% / reading 53%, grade C-, #274 of 571 statewide, top 50%, 1,284 students, 68% FRL); Nova High School (math 22% / reading 56%, grade F, #312 of 667 statewide, top 48%, 2,227 students, 59% FRL) — zoned schools average 66% FRL vs 51% district-wide (15 pts higher); higher-poverty schools than district average — tighter screening recommended.
- Market conditions: Rents rising (+1.0%/yr); 338 active listings in the ZIP; 40 comparable units currently listed for rent nearby; rentals at typical pace (median 23d on market — plan ~3-4 weeks tenant-placement turnaround); solid renter incomes; 2,111 units permitted in Broward County in 2024 (1,265 in 5+ unit buildings).
- This rent runs 34% of the median local income ($80k/yr) — at the standard rent-burdened threshold; future hikes will face affordability resistance.
Forward outlook
- Local home prices are declining (-3.0%/yr); year-one equity from $1k of loan paydown is wiped out by about $6k of value loss. Plan a longer hold.
- Broward County population projected at +34% by 2050 — long-run rental-demand tailwind backs the buy-and-hold thesis.
Negotiation context
- It's been on market 94 days — a 9% lower offer ($191k) is reasonable based on typical stale-listing flexibility.
- 3 sale attempts with the ask held roughly flat each time — persistent listings suggest the price (not the market) is what's stuck; bring a comps-based counter.
- Current owner paid $117k; list at $210k implies a 79% gain — meaningful room to come down on a strong offer.
Risks & watch-outs
- Climate carrying-cost: severe wind risk, 99% chance of damaging wind over 30y; extreme-heat days projected 7→27/yr by 2055 (HVAC capex compounding) — expect insurance premiums to compound above CPI over the hold.
Questions for the listing agent
- What do current leases actually rent for vs. the listed asking? Can we see a recent rent roll and the last 12 months of T-12 income?
- It's been on market 94 days. Have you received any prior offers? Is the seller open to a 9% concession, seller financing, or rate buy-down credit?
- What does the HOA fee cover, when was the last increase, and are there any pending special assessments or reserve-fund shortfalls?
- Any open or pending special assessments — roof, HVAC, plumbing, elevator, façade? What's the per-unit balance and payoff schedule, and is the seller paying it off at close or rolling it to the buyer?
- Why hasn't it sold? Are there any deal-killer items the seller is aware of (foundation, flood, title, zoning, code violations)?
- Is there a deadline driving the sale (1031 exchange, divorce, estate, relocation)? That informs how much negotiation room exists.
- Schools are A-rated — typically a magnet for longer-tenancy family renters. What's the average tenant stay here, and is there a school-zone premium baked into asking?
- The area grade is low — what's the realistic commute time and amenity access for the typical tenant pool here? Any planned neighborhood developments (good or bad) we should know about?
- What's the average days-on-market for RENTAL listings here right now (not sales)? A rising rental-DOM trend means longer vacancies and softer asking-rent achievability than the comps imply.
- What's the recent tenant-quality profile in this submarket — average credit score on applications, eviction rate, late-payment / NSF rate, and stable-employment percentage? A property-management company in the area should have these aggregated.
- How much new apartment / multifamily construction is in the pipeline within 1–3 miles? Heavy new supply (>2% of stock underway) typically softens rents 12–24 months out; light construction supports rent growth.
Investment metrics
- 1% rule
- 1.07% ✓
- Cap rate
- 5.96%
- Cash-on-cash
- -1.17%
- DSCR
- 0.95
- GRM
- 7.8
CMA / ARV
No comps found within radius.
Projected returns pro-forma
-3.0% appreciation · 1.01% rent growth · sell at horizon
- IRR
- -20.9%
- Equity multiple
- 0.29×
- Total profit
- $-41,768
- Equity at exit
- $31,274
- IRR
- -21.1%
- Equity multiple
- 0.02×
- Total profit
- $-57,316
- Equity at exit
- $18,135
Cash invested: $58,730 (down + closing). Projections, not guarantees.
Landlord ↔ Tenant lean methodology
- Overall (STATE)
- 87 Strongly Landlord-Friendly
- State Florida
- 87 Strongly Landlord-Friendly · R+3
- County
- — inherits STATE
- City
- — inherits STATE
ZIP-level market 33024
- Rents YoY
- 1.0%
- Active inventory
- 338
- Price-to-rent
- 7.8×
Monthly cashflow live
- Estimated rent
- $2,237 high interval (Pro) →
- Mortgage (P&I)
- −$1,100
- Tax from tax record
- −$287 /mo · $3,445/yr
- Insurance
- −$87
- HOA
- −$350
- Vacancy / Maint / Mgmt
- −$470
- Net cashflow
- $-57
Break-even live
Sensitivity live
| Price | -10% $61 | -5% $2 | +0% $-57 | +5% $-117 | +10% $-176 |
|---|---|---|---|---|---|
| Rent | -10% $-234 | -5% $-146 | +0% $-57 | +5% $31 | +10% $119 |
| Rate | -1.0pp $48 | -0.5pp $-4 | base $-57 | +0.5pp $-112 | +1.0pp $-167 |
UW: 25.0% down · 7.5% · 30yr · 1.5% tax · 5.0% vac · 8.0% maint · 8.0% mgmt
Financing live
Cash to close
- Down payment
- $52,438
- Closing costs
- $6,292
- Reserves months
- —
- Total cash needed
- —
Loan-product check · same deal, 3 products live
Conventional
25% down · 7.5% · 30yr
- Down + closing
- —
- Monthly P&I
- —
- Monthly cashflow
- —
- DSCR
- —
- Eligible?
- —
Personal DTI + credit; lowest rate.
DSCR
20% down · 8.5% · 30yr
- Down + closing
- —
- Monthly P&I
- —
- Monthly cashflow
- —
- DSCR
- —
- Eligible?
- —
No personal income docs; deal must DSCR.
Hard money
10% down · 12.0% · 12mo
- Down + closing
- —
- Monthly P&I
- —
- Monthly cashflow
- —
- DSCR
- —
- Eligible?
- —
Short-term bridge; refi at stabilization.
Rent comps 40 comps
| Address | Beds | Baths | Sqft | Rent | $/sqft | DOM | Units | Dist |
|---|---|---|---|---|---|---|---|---|
| 3211 Sabal Palm Mnr #105 Hollywood, FL | 2.0 | 2.0 | 942 | $1,666 | $1.77 | 26d | 1 | 0.06mi |
| 3271 Sabal Palm Mnr #103 Hollywood, FL | 2.0 | 2.0 | 942 | $2,100 | $2.23 | 26d | 1 | 0.12mi |
| 3241 Sabal Palm Mnr #104 Hollywood, FL | 2.0 | 2.0 | 942 | $2,150 | $2.28 | 26d | 1 | 0.13mi |
| 3777 NW 78th Ave Hollywood, FL | 2.0–3.0 | 1.5–2.0 | 1050 | $2,000 | $1.90 | 0d | 2 | 0.23mi |
| 3300 El Jardin Dr Hollywood, FL | 2.0 | 1.0 | 864 | $2,000 | $2.31 | 26d | 1 | 0.34mi |
| 7851 Raleigh St Hollywood, FL | 3.0 | 2.0 | 1008 | $3,400 | $3.37 | 19d | 1 | 0.36mi |
| 7608 NW 38th Ct #14 Hollywood, FL | 2.0 | 2.0 | 831 | $2,450 | $2.95 | 26d | 1 | 0.37mi |
| 7541 Atlanta St #7541 Hollywood, FL | 3.0 | 2.0 | 1056 | $2,700 | $2.56 | 26d | 1 | 0.39mi |
| 2940 Solano Ave Hollywood, FL | 1.0–3.0 | 1.0–2.0 | 1077 | $2,920 | $2.71 | 3d | 1 | 0.40mi |
| 7610 Stirling Rd Unit 204C Hollywood, FL | 1.0 | 1.0 | 750 | $1,675 | $2.23 | 16d | 1 | 0.51mi |
| 7550 Stirling Rd Hollywood, FL | 1.0–2.0 | 1.0–2.0 | 872 | $2,295 | $2.63 | 0d | 6 | 0.52mi |
| 7610 Stirling Rd Hollywood, FL | 1.0 | 1.0 | 750 | $1,675 | $2.23 | 26d | 2 | 0.55mi |
| 2200 NW 78th Ave #105 Hollywood, FL | 2.0 | 2.0 | 815 | $2,250 | $2.76 | 26d | 1 | 0.62mi |
| 7025 Stirling Rd Davie, FL | 1.0–3.0 | 1.0–2.0 | 1044 | $2,696 | $2.58 | 4d | 17 | 0.63mi |
| 7760 NW 22nd St #103 Hollywood, FL | 2.0 | 2.0 | 815 | $2,300 | $2.82 | 13d | 1 | 0.63mi |
| 2203 N University Dr Pembroke Pines, FL | 2.0 | 2.0 | 1031 | $1,913 | $1.86 | 0d | 3 | 0.64mi |
| 2173 NW 78th Ave #204 Hollywood, FL | 2.0 | 2.0 | 822 | $2,250 | $2.74 | 5d | 1 | 0.65mi |
| 2173 NW 78th Ave #204 Hollywood, FL | 2.0 | 2.0 | 822 | $2,250 | $2.74 | 18d | 1 | 0.65mi |
| 7420 Stirling Rd Hollywood, FL | 2.0 | 2.0 | 925 | $2,195 | $2.37 | 6d | 1 | 0.67mi |
| 7400 Stirling Rd Hollywood, FL | 2.0 | 1.0 | 610 | $2,002 | $3.28 | 0d | 11 | 0.67mi |
| 2151 NW 77th Way #205 Hollywood, FL | 2.0 | 2.0 | 822 | $2,250 | $2.74 | 7d | 1 | 0.68mi |
| 2151 NW 77th Way #205 Hollywood, FL | 2.0 | 2.0 | 822 | $2,400 | $2.92 | 26d | 1 | 0.68mi |
| 7850 Pasadena Blvd Pembroke Pines, FL | 1.0–3.0 | 1.0–2.0 | 991 | $2,672 | $2.70 | 0d | 21 | 0.70mi |
| 2041 NW 81st Ave #427 Pembroke Pines, FL | 2.0 | 1.5 | 870 | $2,050 | $2.36 | 23d | 1 | 0.83mi |
| 200 Gate Rd #102 Hollywood, FL | 2.0 | 2.0 | 1015 | $1,850 | $1.82 | 26d | 1 | 0.93mi |
| 5500 S University Dr Fort Lauderdale, FL | 1.0–3.0 | 1.0–2.0 | 1016 | $2,592 | $2.55 | 0d | 18 | 0.97mi |
| 100 Gate Rd Unit 3-63 Hollywood, FL | 2.0 | 2.0 | 1000 | $2,300 | $2.30 | 16d | 1 | 0.98mi |
| 300 Berkley Rd #212 Hollywood, FL | 2.0 | 2.0 | 920 | $1,995 | $2.17 | 26d | 1 | 1.03mi |
| 301 Cambridge Rd #301 Hollywood, FL | 2.0 | 2.0 | 920 | $1,850 | $2.01 | 22d | 1 | 1.06mi |
| 251 Berkley Rd #209 Hollywood, FL | 1.0 | 1.5 | 650 | $1,600 | $2.46 | 4d | 1 | 1.12mi |
| 251 Berkley Rd #209 Hollywood, FL | 1.0 | 1.5 | 650 | $1,600 | $2.46 | 26d | 1 | 1.12mi |
| 6249 Garden Ct Davie, FL | 2.0 | 2.0 | 950 | $2,399 | $2.53 | 18d | 1 | 1.12mi |
| 6243 Garden Ct Davie, FL | 2.0 | 2.0 | 950 | $2,375 | $2.50 | 26d | 1 | 1.13mi |
| 7630 NW 15th St Pembroke Pines, FL | 2.0 | 1.0 | 897 | $2,700 | $3.01 | 26d | 1 | 1.15mi |
| 322 Briarwood Cir Unit 1-17 Hollywood, FL | 2.0 | 2.0 | 1030 | $2,500 | $2.43 | 15d | 1 | 1.15mi |
| 8350 Taft St Pembroke Pines, FL | 2.0 | 1.0 | 897 | $2,600 | $2.90 | 26d | 1 | 1.15mi |
| 200 Ashbury Rd #209 Hollywood, FL | 1.0 | 1.5 | 920 | $1,450 | $1.58 | 26d | 1 | 1.16mi |
| 7651 NW 14th St Unit 7651 Pembroke Pines, FL | 2.0 | 1.0 | 989 | $3,200 | $3.24 | 26d | 1 | 1.17mi |
| 100 Ashbury Rd Hollywood, FL | 1.0–2.0 | 1.5–2.0 | 840 | $2,400 | $2.86 | 22d | 2 | 1.27mi |
| 100 Ashbury Rd Hollywood, FL | 1.0–2.0 | 1.5–2.0 | 840 | $2,400 | $2.86 | 7d | 2 | 1.27mi |
HOA detail condo
- Monthly dues
- $350 · $4,200/yr
- Likely covers
- parking
- Assessments
- None detected in remarks — confirm with the listing agent.
Listing history 23 events
-
2026-06-21days on market $209,750 Active 94 DOM
-
2026-06-18days on market $209,750 Active 91 DOM
-
2026-06-17days on market $209,750 Active 90 DOM
-
2026-06-16days on market $209,750 Active 89 DOM
-
2026-06-15days on market $209,750 Active 88 DOM
-
2026-06-13days on market $209,750 Active 86 DOM
-
2026-06-09days on market $209,750 Active 82 DOM
-
2026-06-08days on market $209,750 Active 81 DOM
-
2026-06-07days on market $209,750 Active 80 DOM
-
2026-06-04days on market $209,750 Active 77 DOM
-
2026-06-03days on market $209,750 Active 76 DOM
-
2026-06-02days on market $209,750 Active 75 DOM
-
2026-06-01days on market $209,750 Active 74 DOM
-
2026-05-31days on market $209,750 Active 73 DOM
-
2026-03-19$209,750 Active
-
2026-02-23historical
-
2026-02-03$225,000 Active
-
2025-03-20historical $2,100
-
2025-03-03$2,100
-
2024-11-20soldstatus $117,000
-
1995-01-30soldstatus $39,000
-
1982-08-01soldstatus $55,600
-
1982-08-01soldstatus $55,600
ⓘ Source: listings_history table (triggers on properties + properties_extension) + one-shot
backfill from property_details.listing_events for pre-trigger history.
Tax reassessment forecast FL · Resets to sale price
- Current annual tax
- $3,445 · $287/mo
- Projected year-2 tax
- $3,445 · $287/mo
- Expected delta
- $0/yr ($0/mo · 0.0%)
ⓘ Screening estimate from a state-policy table — verify with the county assessor before closing.
Climate risk First Street
- Flood 4/10 Moderate FEMA zone X (shaded) · 22% chance over 30 yrs
- Wildfire 1/10 Low
- Heat 10/10 Extreme 7 d/yr ≥105°F today · 27 d/yr by 30 yrs out
- Wind 10/10 Extreme 99% chance of damaging wind over 30 yrs
- Air quality 2/10 Low 2 unhealthy d/yr today · 2 by 30 yrs out
Nearby sold comps map
Loading sold comps map…
Walkable amenities ~0.75 mi
Loading nearby amenities…
Taxation est. · year 1
- Rental income
- $26,841
- − Mortgage interest
- −$11,749
- − Property taxes
- −$3,445
- − Insurance
- −$1,049
- − Repairs & maintenance
- −$2,147
- − Management
- −$2,147
- − HOA
- −$4,200
- − Depreciation
- −$6,102
- Taxable loss
- −$3,998
- Est. tax savings @ 24.0%
- +$959
- After-tax cash flow
- $271/yr
For passive investors: Depreciation is non-cash, so a rental often shows a tax loss while cash-flowing — sheltering income. Rental losses are passive: they offset passive income freely, and up to $25,000/yr can offset ordinary (W-2) income if you actively participate and your MAGI is under $100k (phasing out to $0 by $150k); unused losses carry forward. On sale, claimed depreciation is recaptured at up to 25%, and gains may owe capital-gains tax (a 1031 exchange can defer both). Figures are a year-1 estimate at your 24.0% rate — not tax advice; consult a CPA.
Schools (NCES district)
- District
- Broward
- NCES district ID
- 1200180
- Math proficiency
- 42% ▼ -18.00%
- Reading proficiency
- 53% ▼ -5.00%
- Median HH income
- $52,139
- Composite
- 40.88/100
- National rank
- #3621
- State rank
- #46 of 73 in FL
Livability — Davie
- Score
- 82/100
- State rank
- #68
- US rank
- #1159
Category grades
Schools grade is shown separately in the Schools card above.
Census & demographics
- Census place
- Davie, FL
- County
- Broward County · 1,963,430 people
- City population
- 92,317
- Metro
- Miami-Fort Lauderdale-Pompano Beach, FL
- Population (ZIP)
- 76,585
- Household income
- $80,061
- Rent vs Own
- Severe rent burden
- 2813.0
Population outlook (Broward County) Hauer SSP2
- Today (2025)
- 2,207,033 people
- By 2030
- 2,360,704 · +7.0%
- By 2040
- 2,661,208 · +20.6%
- By 2050
- 2,946,698 · +33.5%
- By 2075
- 3,602,273 · +63.2%
- By 2100
- 3,970,984 · +79.9%
Race, ethnicity, and origin ACS 2023
- Neighborhood character
- Diverse neighborhood (Simpson 0.65)
- Race & ethnicity
- Hispanic / Latino 52% Two or more races 23% White 22% Black 17% Asian 4%
- Hispanic origin (detail)
- Mexican 3% Puerto Rican 7% Cuban 13% Dominican 5%
- Common ancestry
- Hispanic 4% Romanian 2% Estonian 1%
- Foreign-born
- 40% · Canada, Jamaica, Dominican Republic
- Languages at home
- 44% English-only · Spanish 46% French/Haitian/Cajun 5% Other Indo-European 3%
Political lean MEDSL · Broward
- 2024 margin
- D (+17.0) · D 58.0% · R 41.0%
- 2008→2024 swing
- -17.8pp toward R · 2008: 34.7pp · 2024: 17.0pp
- All cycles
- 2024: D+17.0 2020: D+29.8 2016: D+35.0 2012: D+34.9 2008: D+34.7
Not yet ingested
- Civics
- —
Market trends
- HPI YoY
- ▼ -442.20%
- Current HPI
- 464.3405
- Rent YoY
- ▲ 1.01%
- Metro
- Miami-Fort Lauderdale-Pompano Beach, FL
- State GDP YoY
- ▲ 3.28%
- F500 in state
- 36
Industry mix (Fortune 500 HQ in FL)
| Industry | F500 HQs | Revenue |
|---|---|---|
| Industrial Technology | 2 | $29B |
|
||
| Insurance | 2 | $17B |
|
||
| Retail | 1 | $60B |
|
||
| Technology Distribution | 1 | $58B |
|
||
| Homebuilding | 1 | $35B |
|
||
| Technology Manufacturing | 1 | $35B |
|
||
Price history
+277.2% since first listed9 events — show timeline
- 2026-03-19 Listed $209,750 MARMLS
- 2026-02-23 Listing Removed — MARMLS
- 2026-02-03 Listed $225,000 MARMLS
- 2025-03-20 Rental Removed $2,100 MARMLS
- 2025-03-03 Listed for Rent $2,100 MARMLS
- 2024-11-20 Sold (Public Records) $117,000 Public Records
- 1995-01-30 Sold (Public Records) $39,000 Public Records
- 1982-08-01 Sold (Public Records) $55,600 Public Records
- 1982-08-01 Sold (Public Records) $55,600 Public Records
Property tax history
+26.4%/yrLatest (2025): $3,445 · +833.5% YoY. Source: county tax records.
Cash-flow waterfall
monthlySold comps — $/sqft
last 12 mo · ≤1 miLoading sold comps…