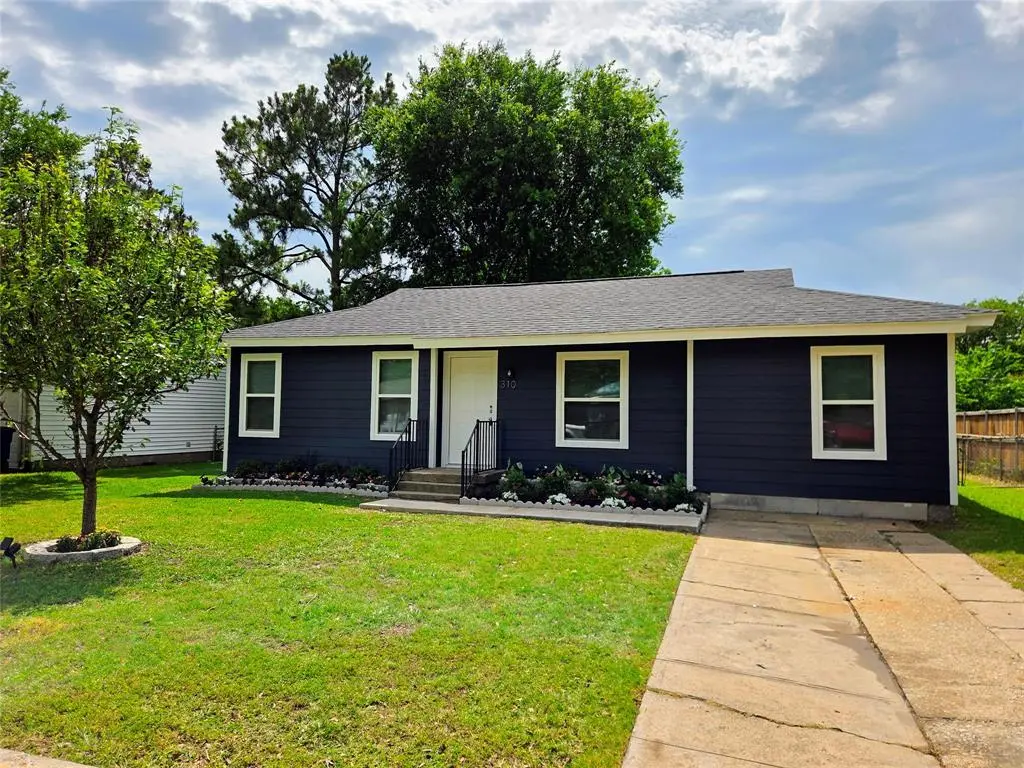
310 S 2nd St · Wylie, TX
Flood risk 1/10 · Minimal
- FEMA flood zone
- X (unshaded)
- Chance of flooding over 30 yrs
- 0.0%
- Est. flood insurance / yr
- $507 – $1,088
Fire risk 1/10 · Minimal
- Est. fire insurance / yr
- $1,222 – $2,270
Heat risk 7/10 · Major
- Hot days now (above 109°F)
- 7 days/yr
- Hot days in 30 yrs
- 22 days/yr
Wind risk 6/10 · Moderate
- Chance of severe wind over 30 yrs
- 27.0%
Air-quality risk 3/10 · Minor
- Unhealthy air days now
- 2 days/yr
- Unhealthy air days in 30 yrs
- 3 days/yr
Risk factors via First Street. Map © Google.
Why this score? — see what drove the F grade
The composite is a weighted blend of 9 inputs, each scored 0–100. Each bar is that input's sub-score; the figure is the points it added to the 100-point composite (weight × sub-score).
- Cash flow +7.4/30.0
- Schools +5.7/10.0
- Livability +3.5/5.0
- ARV discount +2.9/15.0
- Condition / age +2.5/5.0
- Rent growth +2.2/5.0
- 1% rule +1.9/10.0
- DSCR +1.6/10.0
- Appreciation +0.0/10.0
$250,000
🖨 Deal sheet (PDF) 📄 Offer letter ✓ Due diligence
Listing remarks
So Cute in the Heart of Wylie! Welcome to 310 S 2nd St, where 1950s charm meets a complete, top-to-bottom modern transformation. This isn't just a 'refresh'—this 3-bedroom, 2-bathroom home has been meticulously reconstructed offering the peace of mind of new warrantied systems. Every major system has been replaced for years of worry-free living. Complete new electrical system, new HVAC system with clean new ducting, new water heater and plumbing, plus lots more. On the exterior you'll find lasting concrete siding, energy-efficient double-pane vinyl windows, and an architectural shingle roof with a lifetime warranty. Step inside to a light floor plan featuring fresh designer paint and
Key facts
- New plumbing
- Concrete siding
- New water heater
Tags
Property features AI
Finance
- Other: Lot less than 0.5 acre (approx. 0.2 acre); Subdivision: Fairview Add; Directions: From 78, S on Ballard, E on Butler, S on 2nd.
- Financial info: Accepts Cash, Conventional, FHA, and VA financing; Treat as clear loan type; No second mortgage reported
- HOA & community: No association
Exterior
- Parking: On-site parking with concrete surface
- Security: Smoke detectors
- Utilities: City water; City sewer; Power available (electric)
- Home design: Single-family residence; One story; Residential property
- Construction: Built in 1964; Fiber cement siding; Composition roof; Pillar/Post/Pier foundation
- Exterior features: Alley access; City water; City sewer
Interior
- Kitchen: Dishwasher; Disposal; Electric range; Microwave
- Bedrooms: Primary bedroom (Level 1) — approx. 13 x 11; Bedroom (Level 1) — approx. 11 x 10; Bedroom (Level 1) — approx. 14 x 11
- Flooring: Ceramic tile; Luxury vinyl plank
- Bathrooms: 2 full bathrooms
- Heating & cooling: Central heating (electric); Central air conditioning (electric)
- Interior features: High-speed internet available; Pantry; Vented exhaust fan
- Laundry & utility: Washer hookup; Electric dryer hookup; Stacked washer/dryer area
Neighborhood map
What this means for you Summary
Snapshot
- This is a 2-bed/1.0-bath single-family listed at $250k.
Deal economics
- At list price, monthly cash flow is $-321 ($-4k/yr) — negative.
- To cash-flow at today's rent, offer at most $193k (22.7% below list).
- To meet the 1% rule (rent ≥ 1% of price), the offer needs to be $172k (31.3% below list).
- Recommended offer: $172k (31.3% below list) — sets the bar for 1% rule.
Location & tenants
- Location reads 69/100 on livability (#419 in TX) — a middle-class / working-renter tenant base. Strengths: crime A+, employment A+, housing A+; Watch: amenities F, commute F, health & safety F.
- Wylie ISD (suburban): math 64% / reading 63% proficiency, ranked #28 of 826 in TX (top 3%) — acceptable for families but not a draw, mixed tenant base, ~2y average lease.
- Zoned schools: R F Hartman El (math 62% / reading 62%, grade B, #321 of 4,322 statewide, top 8%, 541 students, 53% FRL) — zoned schools average 53% FRL vs 26% district-wide (28 pts higher); higher-poverty schools than district average — tighter screening recommended.
- Market conditions: Rents soft (-1.4%/yr); 704 active listings in the ZIP; high-income renter base; 19,194 units permitted in Collin County in 2024 (3,988 in 5+ unit buildings).
- This rent is only 17% of the median local income ($122k/yr) — well below the 30% rent-burden line; pricing power to push rent on renewal without tenant pushback.
Forward outlook
- Local home prices are declining (-3.0%/yr); year-one equity from $2k of loan paydown is wiped out by about $8k of value loss. Plan a longer hold.
- Collin County population projected at +60% by 2050 — long-run rental-demand tailwind backs the buy-and-hold thesis.
Negotiation context
- It's been on market 38 days — a 3% lower offer ($242k) is reasonable based on typical stale-listing flexibility.
Risks & watch-outs
- Climate carrying-cost: major wind risk, 27% chance of damaging wind over 30y; extreme-heat days projected 7→22/yr by 2055 (HVAC capex compounding) — expect insurance premiums to compound above CPI over the hold.
Questions for the listing agent
- What do current leases actually rent for vs. the listed asking? Can we see a recent rent roll and the last 12 months of T-12 income?
- It's been on market 38 days. Have you received any prior offers? Is the seller open to a 31% concession, seller financing, or rate buy-down credit?
- Built in 1964 — when were the roof, HVAC, electrical panel, plumbing, and water heater last replaced?
- Is there a deadline driving the sale (1031 exchange, divorce, estate, relocation)? That informs how much negotiation room exists.
- Schools are B-rated — typically a magnet for longer-tenancy family renters. What's the average tenant stay here, and is there a school-zone premium baked into asking?
- The area grade is low — what's the realistic commute time and amenity access for the typical tenant pool here? Any planned neighborhood developments (good or bad) we should know about?
- What's the average days-on-market for RENTAL listings here right now (not sales)? A rising rental-DOM trend means longer vacancies and softer asking-rent achievability than the comps imply.
- What's the recent tenant-quality profile in this submarket — average credit score on applications, eviction rate, late-payment / NSF rate, and stable-employment percentage? A property-management company in the area should have these aggregated.
- How much new for-sale + rental construction is in the pipeline within 1–3 miles? Heavy new supply typically softens prices + rents 12–24 months out; constrained supply supports both.
Investment metrics
- 1% rule
- 0.69% ✗
- Cap rate
- 4.75%
- Cash-on-cash
- -5.51%
- DSCR
- 0.76
- GRM
- 12.1
CMA / ARV
- ARV (on-the-fly)
- $226,860
- Comps found
- 12
Show comp detail 12 sales within ~0.75 mi
| Address | Dist | Beds/Ba | Sqft | Sold | Price | $/sf | Match |
|---|---|---|---|---|---|---|---|
| 328 S 1st St | 0.12mi | 3/1.5 (+1) | 1,015 (+2%) | 3mo | $215,000 | $212 | 82 |
| 320 S 3rd St | 0.08mi | 3/1.0 (+1) | 1,002 (+1%) | 18mo | $229,990 | $230 | 75 |
| 335 S 1st St | 0.14mi | 3/1.5 (+1) | 1,035 (+4%) | 8mo | $217,000 | $210 | 73 |
| 331 S First St | 0.12mi | 3/1.5 (+1) | 1,051 (+6%) | 15mo | $239,950 | $228 | 66 |
| 500 E Oak St | 0.32mi | 2/1.0 | 1,036 (+4%) | 15mo | $220,000 | $212 | 65 |
| 307 W Brown St | 0.59mi | 2/2.0 | 952 (-4%) | 2mo | $225,500 | $237 | 60 |
| 209 S Cottonbelt Ave | 0.55mi | 2/1.0 | 896 (-10%) | 9mo | $235,900 | $263 | 50 |
| 603 Valentine Ln | 0.66mi | 3/1.5 (+1) | 1,084 (+9%) | 3mo | $245,900 | $227 | 45 |
| 1003 Mardi Gras Ln | 0.59mi | 3/1.0 (+1) | 900 (-10%) | 9mo | $235,000 | $261 | 44 |
| 1002 Mardi Gras Ln | 0.61mi | 3/2.0 (+1) | 1,120 (+13%) | 9mo | $130,000 | $116 | 34 |
| 911 Memorial Dr | 0.53mi | 3/2.0 (+1) | 1,124 (+13%) | 14mo | $274,000 | $244 | 33 |
| 406 Willow Way | 0.64mi | 3/2.0 (+1) | 1,138 (+14%) | 5mo | $255,000 | $224 | 32 |
Match score weights: distance 35% · size 25% · config 20% · recency 20%. Top-matched comps best support the ARV.
Projected returns pro-forma
-3.0% appreciation · 0.0% rent growth · sell at horizon
- IRR
- -29.0%
- Equity multiple
- 0.06×
- Total profit
- $-66,004
- Equity at exit
- $37,276
- IRR
- -46.0%
- Equity multiple
- -0.48×
- Total profit
- $-103,278
- Equity at exit
- $21,615
Cash invested: $70,000 (down + closing). Projections, not guarantees.
Landlord ↔ Tenant lean methodology
- Overall (STATE)
- 87 Strongly Landlord-Friendly
- State Texas
- 87 Strongly Landlord-Friendly · R+5
- County
- — inherits STATE
- City
- — inherits STATE
ZIP-level market 75098
- Home prices YoY
- -24.5%
- Rents YoY
- -1.4%
- Active inventory
- 704
- Price-to-rent
- 12.1×
Monthly cashflow live
- Estimated rent
- $1,716 medium interval (Pro) →
- Mortgage (P&I)
- −$1,311
- Tax from tax record
- −$262 /mo · $3,144/yr
- Insurance
- −$104
- HOA
- −$0
- Vacancy / Maint / Mgmt
- −$360
- Net cashflow
- $-321
Break-even live
Sensitivity live
| Price | -10% $-180 | -5% $-250 | +0% $-321 | +5% $-392 | +10% $-463 |
|---|---|---|---|---|---|
| Rent | -10% $-457 | -5% $-389 | +0% $-321 | +5% $-253 | +10% $-186 |
| Rate | -1.0pp $-195 | -0.5pp $-258 | base $-321 | +0.5pp $-386 | +1.0pp $-452 |
UW: 25.0% down · 7.5% · 30yr · 1.5% tax · 5.0% vac · 8.0% maint · 8.0% mgmt
Financing live
Cash to close
- Down payment
- $62,500
- Closing costs
- $7,500
- Reserves months
- —
- Total cash needed
- —
Loan-product check · same deal, 3 products live
Conventional
25% down · 7.5% · 30yr
- Down + closing
- —
- Monthly P&I
- —
- Monthly cashflow
- —
- DSCR
- —
- Eligible?
- —
Personal DTI + credit; lowest rate.
DSCR
20% down · 8.5% · 30yr
- Down + closing
- —
- Monthly P&I
- —
- Monthly cashflow
- —
- DSCR
- —
- Eligible?
- —
No personal income docs; deal must DSCR.
Hard money
10% down · 12.0% · 12mo
- Down + closing
- —
- Monthly P&I
- —
- Monthly cashflow
- —
- DSCR
- —
- Eligible?
- —
Short-term bridge; refi at stabilization.
Listing history 15 events
-
2026-06-15status $250,000 Pending 38 DOM
-
2026-06-15days on market $250,000 Active Option Contract 38 DOM
-
2026-06-13days on market $250,000 Active Option Contract 36 DOM
-
2026-06-13days on market $250,000 Active Option Contract 35 DOM
-
2026-06-09days on market $250,000 Active Option Contract 32 DOM
-
2026-06-08days on market $250,000 Active Option Contract 31 DOM
-
2026-06-07statusdays on market $250,000 Active Option Contract 30 DOM
-
2026-06-04days on market $250,000 Active 27 DOM
-
2026-06-03days on market $250,000 Active 26 DOM
-
2026-06-02days on market $250,000 Active 25 DOM
-
2026-06-01days on market $250,000 Active 24 DOM
-
2026-05-31days on market $250,000 Active 23 DOM
-
2026-05-18historical Active Option Contract
-
2026-05-08$250,000 Active
-
2025-09-29soldstatus
ⓘ Source: listings_history table (triggers on properties + properties_extension) + one-shot
backfill from property_details.listing_events for pre-trigger history.
Tax reassessment forecast TX · Resets to sale price
- Current annual tax
- $3,144 · $262/mo
- Projected year-2 tax
- $4,575 · $381/mo
- Expected delta
- +$1,431/yr (+$119/mo · 45.5%)
ⓘ Screening estimate from a state-policy table — verify with the county assessor before closing.
Climate risk First Street
- Flood 1/10 Low FEMA zone X (unshaded) · 0% chance over 30 yrs
- Wildfire 1/10 Low
- Heat 7/10 Severe 7 d/yr ≥109°F today · 22 d/yr by 30 yrs out
- Wind 6/10 Major 27% chance of damaging wind over 30 yrs
- Air quality 3/10 Moderate 2 unhealthy d/yr today · 3 by 30 yrs out
Nearby sold comps map
Loading sold comps map…
Walkable amenities ~0.75 mi
Loading nearby amenities…
Taxation est. · year 1
- Rental income
- $20,598
- − Mortgage interest
- −$14,004
- − Property taxes
- −$3,144
- − Insurance
- −$1,250
- − Repairs & maintenance
- −$1,648
- − Management
- −$1,648
- − Depreciation
- −$7,273
- Taxable loss
- −$8,369
- Est. tax savings @ 24.0%
- +$2,009
- After-tax cash flow
- $-1,846/yr
For passive investors: Depreciation is non-cash, so a rental often shows a tax loss while cash-flowing — sheltering income. Rental losses are passive: they offset passive income freely, and up to $25,000/yr can offset ordinary (W-2) income if you actively participate and your MAGI is under $100k (phasing out to $0 by $150k); unused losses carry forward. On sale, claimed depreciation is recaptured at up to 25%, and gains may owe capital-gains tax (a 1031 exchange can defer both). Figures are a year-1 estimate at your 24.0% rate — not tax advice; consult a CPA.
Schools (NCES district)
- District
- Wylie ISD
- NCES district ID
- 4846530
- Math proficiency
- 64% ▼ -9.00%
- Reading proficiency
- 63% ▼ -3.00%
- Median HH income
- $84,145
- Composite
- 57.25/100
- National rank
- #1091
- State rank
- #28 of 826 in TX
Livability — Wylie
- Score
- 69/100
- State rank
- #419
- US rank
- #8623
Category grades
Schools grade is shown separately in the Schools card above.
Census & demographics
- Census place
- Wylie, TX
- County
- Collin County · 1,159,394 people
- City population
- 69,325
- Metro
- Dallas-Fort Worth-Arlington, TX
- Population (ZIP)
- 69,325
- Household income
- $122,089
- Rent vs Own
- Severe rent burden
- 996.0
Population outlook (Collin County) Hauer SSP2
- Today (2025)
- 1,210,074 people
- By 2030
- 1,358,201 · +12.2%
- By 2040
- 1,654,061 · +36.7%
- By 2050
- 1,937,359 · +60.1%
- By 2075
- 2,567,039 · +112.1%
- By 2100
- 2,952,048 · +144.0%
Race, ethnicity, and origin ACS 2023
- Neighborhood character
- Diverse neighborhood (Simpson 0.67)
- Race & ethnicity
- White 51% Hispanic / Latino 19% Two or more races 15% Black 13% Asian 11%
- Hispanic origin (detail)
- Mexican 12%
- Common ancestry
- Slovak 2% Lithuanian 2% Serbian 2%
- Foreign-born
- 21% · Canada, Vietnam, China
- Languages at home
- 70% English-only · Spanish 14% Other Indo-European 4% Vietnamese 2%
Political lean MEDSL · Collin
- 2024 margin
- R (+11.1) · D 43.1% · R 54.3% · Other 2.6%
- 2008→2024 swing
- +14.4pp toward D · 2008: -25.6pp · 2024: -11.1pp
- All cycles
- 2024: R+11.1 2020: R+4.3 2016: R+17.0 2012: R+31.6 2008: R+25.6
Not yet ingested
- Civics
- —
Market trends
- HPI YoY
- ▼ -84.91%
- Current HPI
- 261.9973
- Rent YoY
- ▼ -1.39%
- Metro
- Dallas-Fort Worth-Arlington, TX
- State GDP YoY
- ▲ 3.95%
- F500 in state
- 110
Industry mix (Fortune 500 HQ in TX)
| Industry | F500 HQs | Revenue |
|---|---|---|
| Energy | 16 | $1,198B |
|
||
| Technology | 5 | $198B |
|
||
| Engineering / Construction | 4 | $72B |
|
||
| Energy Services | 3 | $60B |
|
||
| Utilities | 3 | $41B |
|
||
| Healthcare | 2 | $330B |
|
||
Price history
3 events — show timeline
- 2026-05-18 Contingent — NTREIS
- 2026-05-08 Listed $250,000 NTREIS
- 2025-09-29 Sold (Public Records) — Public Records
Property tax history
+3.8%/yrLatest (2025): $3,144 · -7.6% YoY. Source: county tax records.
Cash-flow waterfall
monthlySold comps — $/sqft
last 12 mo · ≤1 miLoading sold comps…