 Multi-family
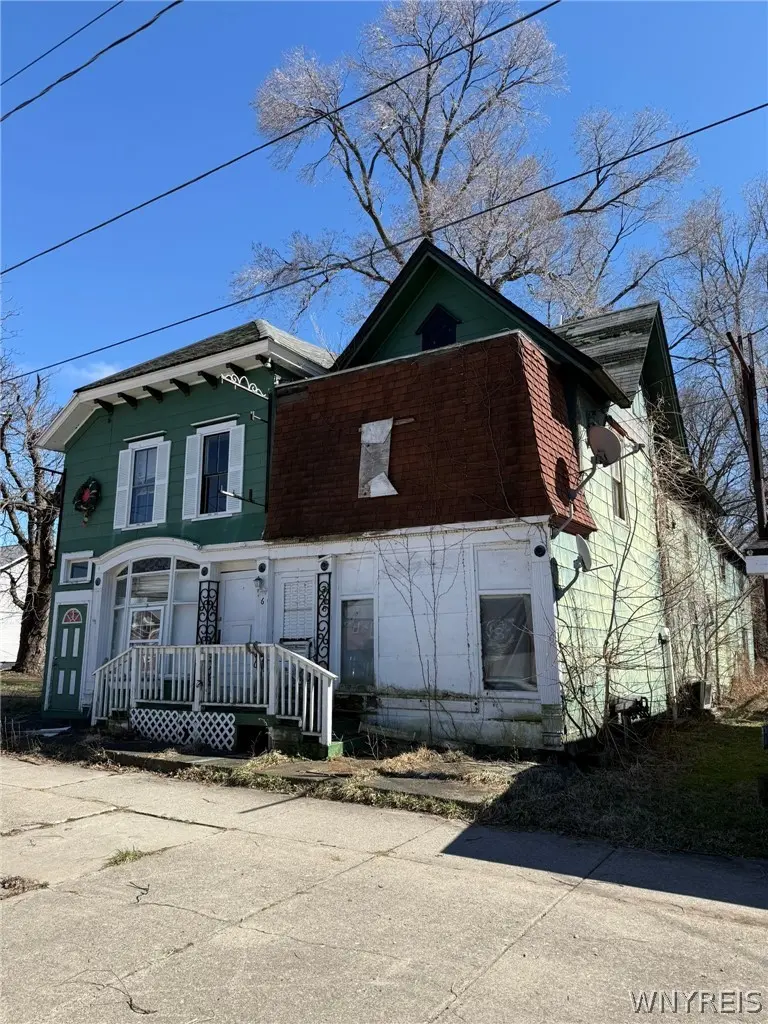
36 W Main St · Ripley, NY
Flood risk No data
- FEMA flood zone
- —
- Chance of flooding over 30 yrs
- —
- Est. flood insurance / yr
- —
Fire risk No data
- Est. fire insurance / yr
- —
Heat risk No data
- Hot days now (above threshold)
- —
- Hot days in 30 yrs
- —
Wind risk No data
- Chance of severe wind over 30 yrs
- —
Air-quality risk No data
- Unhealthy air days now
- —
- Unhealthy air days in 30 yrs
- —
Risk factors via First Street. Map © Google.
Why this score? — see what drove the C- grade
The composite is a weighted blend of 9 inputs, each scored 0–100. Each bar is that input's sub-score; the figure is the points it added to the 100-point composite (weight × sub-score).
- Cash flow +15.0/30.0
- Appreciation +8.0/10.0
- ARV discount +7.5/15.0
- 1% rule +5.0/10.0
- DSCR +5.0/10.0
- Schools +3.6/10.0
- Livability +2.9/5.0
- Rent growth +2.5/5.0
- Condition / age +2.5/5.0
$19,900
🖨 Deal sheet 📄 Offer letter ✓ Due diligence
Multi-family units
County records classify this as Multi-Family (2-4 Unit). Listing-text estimate: 1 unit. estimate disagrees with records
Listing remarks
MUST SEE!! Investor special! Phenomenal opportunity to transform this landmark property right in the heart of Ripley. Building needs complete rehab and is in SEVERE disrepair with need of SIGNIFICANT work; enter at your own risk and no showings after dark. Property to be sold in completely as-is condition. Enjoy the SERENITY this location offers, conveniently located on a peaceful street with country surroundings and close to the I-90. Considerable potential and perfect for building new or recreational purposes with water, electric, and sewer already at the street. Low taxes, great schools, and close to ALL conveniences!
Key facts
- Landmark property
- Country surroundings
- Complete rehab
Tags
Property features AI
Finance
- Financial info: Tenants pay all utilities; Operating expenses: see remarks
Exterior
- Parking: Concrete parking
- Utilities: Public water connected
- Home design: Two-story building; Existing structure
- Construction: Wood siding construction; Shingle roof
- Exterior features: Rectangular lot with approximate dimensions 44 x 123
Interior
- Bedrooms: Three 1-bedroom units
- Bathrooms: Two full bathrooms and one half bathroom (building total)
- Heating & cooling: Heating: See remarks
- Interior features: Resale property
Neighborhood map
What this means for you Summary
Snapshot
- This is a 3-bed/2.0-bath multifamily listed at $20k.
Deal economics
- At list price, monthly cash flow is $868 ($10k/yr) — positive.
- The deal already cash-flows at list — no discount required.
- Meets the 1% rule at list price ($1k rent vs $20k).
- Recommended offer: $19k (3.0% below list) — sets the bar for market timing.
Location & tenants
- Location reads 58/100 on livability (#1,055 in NY) — a working-class tenant base; expect higher turnover. Strengths: cost of living A+, housing A+; Watch: employment C-, schools D-, crime F.
- Ripley Central School District (rural): math 35% / reading 45% proficiency, ranked #651 of 755 in NY (top 86%) — families likely to look elsewhere, expect single-tenant / working-renter base with shorter leases.
- Market conditions: 14 active listings in the ZIP; 127 units permitted in Chautauqua County in 2024 (0 in 5+ unit buildings).
Forward outlook
- In year one you build about $1k of equity ($138 loan paydown + $1k appreciation (6.0% local appreciation)).
- Chautauqua County population projected at -22% by 2050 — secular population decline; favor cash flow + early exit over multi-decade hold.
- At projected returns (6.0% appreciation + 3.0% rent growth), your $6k cash investment doubles in ~1 year — after that, you're playing with house money.
Negotiation context
- It's been on market 55 days — a 3% lower offer ($19k) is reasonable based on typical stale-listing flexibility.
- 2 sale attempts since 26y ago with the ask held roughly flat each time — persistent listings suggest the price (not the market) is what's stuck; bring a comps-based counter.
Risks & watch-outs
- Watch-outs: built in 1900 — expect roof / HVAC / electrical / plumbing capex.
Questions for the listing agent
- It's been on market 55 days. Have you received any prior offers? Is the seller open to a 3% concession, seller financing, or rate buy-down credit?
- Built in 1900 — when were the roof, HVAC, electrical panel, plumbing, and water heater last replaced?
- Is there a deadline driving the sale (1031 exchange, divorce, estate, relocation)? That informs how much negotiation room exists.
- Schools are D-rated, which usually means shorter tenancies and higher turnover. Who's the typical renter profile here, and what's been the actual vacancy rate?
- Crime grade is F in this area — have there been break-ins, vandalism, or insurance claims at this property in the last 3 years? What carrier currently insures it and at what premium?
- What's the average days-on-market for RENTAL listings here right now (not sales)? A rising rental-DOM trend means longer vacancies and softer asking-rent achievability than the comps imply.
- What's the recent tenant-quality profile in this submarket — average credit score on applications, eviction rate, late-payment / NSF rate, and stable-employment percentage? A property-management company in the area should have these aggregated.
- How much new apartment / multifamily construction is in the pipeline within 1–3 miles? Heavy new supply (>2% of stock underway) typically softens rents 12–24 months out; light construction supports rent growth.
Investment metrics
- 1% rule
- 6.40% ✓
- Cap rate
- 58.65%
- Cash-on-cash
- 186.98%
- DSCR
- 9.32
- GRM
- 1.3
CMA / ARV
- ARV (median comp)
- $48,632
- List price
- $19,900
- Delta
- -59.08%
- Verdict
- UNDERPRICED
- Comps
- 1 within 2.0 mi
Projected returns pro-forma
5.97% appreciation · 3.0% rent growth · sell at horizon
- IRR
- —
- Equity multiple
- 11.95×
- Total profit
- $61,031
- Equity at exit
- $12,478
- IRR
- —
- Equity multiple
- 25.46×
- Total profit
- $136,268
- Equity at exit
- $22,599
Cash invested: $5,572 (down + closing). Projections, not guarantees.
Landlord ↔ Tenant lean methodology
- Overall (STATE)
- 15 Strongly Tenant-Friendly
- State New York
- 15 Strongly Tenant-Friendly · D+10
- County
- — inherits STATE
- City
- — inherits STATE
ZIP-level market 14775
- Home prices YoY
- 1.6%
- Active inventory
- 14
- Price-to-rent
- 1.3×
Monthly cashflow live
- Estimated rent
- $1,273 medium interval (Pro) →
- Mortgage (P&I)
- −$104
- Tax est. 1.5%
- −$25 /mo · $298/yr
- Insurance
- −$8
- HOA
- −$0
- Vacancy / Maint / Mgmt
- −$267
- Net cashflow
- $868
Break-even live
UW: 25.0% down · 7.5% · 30yr · 1.5% tax · 5.0% vac · 8.0% maint · 8.0% mgmt
Financing live
Cash to close
- Down payment
- $4,975
- Closing costs
- $597
- Reserves months
- —
- Total cash needed
- —
Loan-product check · same deal, 3 products live
Conventional
25% down · 7.5% · 30yr
- Down + closing
- —
- Monthly P&I
- —
- Monthly cashflow
- —
- DSCR
- —
- Eligible?
- —
Personal DTI + credit; lowest rate.
DSCR
20% down · 8.5% · 30yr
- Down + closing
- —
- Monthly P&I
- —
- Monthly cashflow
- —
- DSCR
- —
- Eligible?
- —
No personal income docs; deal must DSCR.
Hard money
10% down · 12.0% · 12mo
- Down + closing
- —
- Monthly P&I
- —
- Monthly cashflow
- —
- DSCR
- —
- Eligible?
- —
Short-term bridge; refi at stabilization.
Listing history 16 events
-
2026-06-18days on market $19,900 Active 55 DOM
-
2026-06-17days on market $19,900 Active 54 DOM
-
2026-06-16days on market $19,900 Active 53 DOM
-
2026-06-15days on market $19,900 Active 52 DOM
-
2026-06-13days on market $19,900 Active 50 DOM
-
2026-06-12days on market $19,900 Active 49 DOM
-
2026-06-09days on market $19,900 Active 46 DOM
-
2026-06-08days on market $19,900 Active 45 DOM
-
2026-06-07days on market $19,900 Active 44 DOM
-
2026-06-05days on market $19,900 Active 42 DOM
-
2026-06-04days on market $19,900 Active 40 DOM
-
2026-06-02days on market $19,900 Active 39 DOM
-
2026-06-01days on market $19,900 Active 38 DOM
-
2026-05-31days on market $19,900 Active 37 DOM
-
2026-04-24$19,900 Active 628-char remark
-
2000-12-09$43,000
ⓘ Source: listings_history table (triggers on properties + properties_extension) + one-shot
backfill from property_details.listing_events for pre-trigger history.
Nearby sold comps map
Loading sold comps map…
Walkable amenities ~0.75 mi
Loading nearby amenities…
Taxation est. · year 1
- Rental income
- $15,277
- − Mortgage interest
- −$1,115
- − Property taxes
- −$298
- − Insurance
- −$100
- − Repairs & maintenance
- −$1,222
- − Management
- −$1,222
- − Depreciation
- −$579
- Taxable income
- $10,741
- Est. tax owed @ 24.0%
- −$2,578
- After-tax cash flow
- $7,841/yr
For passive investors: Depreciation is non-cash, so a rental often shows a tax loss while cash-flowing — sheltering income. Rental losses are passive: they offset passive income freely, and up to $25,000/yr can offset ordinary (W-2) income if you actively participate and your MAGI is under $100k (phasing out to $0 by $150k); unused losses carry forward. On sale, claimed depreciation is recaptured at up to 25%, and gains may owe capital-gains tax (a 1031 exchange can defer both). Figures are a year-1 estimate at your 24.0% rate — not tax advice; consult a CPA.
Schools (NCES district)
- District
- Ripley Central School District
- NCES district ID
- 3624660
- Math proficiency
- 35% ▼ -5.00%
- Reading proficiency
- 45% ▲ 5.00%
- Median HH income
- $39,212
- Composite
- 35.87/100
- National rank
- #9595
- State rank
- #651 of 755 in NY
Livability — Ripley
- Score
- 58/100
- State rank
- #1055
- US rank
- #21016
Category grades
Schools grade is shown separately in the Schools card above.
Census & demographics
- Census place
- Ripley, NY
- Population (ZIP)
- 2,272
Population outlook (Chautauqua County) Hauer SSP2
- Today (2025)
- 123,454 people
- By 2030
- 118,509 · -4.0%
- By 2040
- 107,311 · -13.1%
- By 2050
- 96,703 · -21.7%
- By 2075
- 76,757 · -37.8%
- By 2100
- 60,984 · -50.6%
Race, ethnicity, and origin ACS 2023
- Neighborhood character
- Predominantly White (95%)
- Race & ethnicity
- White 95% Hispanic / Latino 4% Two or more races 3%
- Common ancestry
- Romanian 5% Slovak 3% Lithuanian 2%
- Foreign-born
- 2% · Canada, China
- Languages at home
- 95% English-only · Spanish 2% Chinese 1% French/Haitian/Cajun 1%
Political lean MEDSL · Chautauqua
- 2024 margin
- Strong R (+22.0) · D 39.0% · R 61.0%
- 2008→2024 swing
- -22.9pp toward R · 2008: 0.9pp · 2024: -22.0pp
- All cycles
- 2024: R+22.0 2020: R+19.8 2016: R+24.6 2012: R+8.2 2008: D+0.9
Not yet ingested
- Civics
- —
Market trends
- HPI YoY
- ▲ 5.97%
- Current HPI
- 385.9794
- Rent YoY
- —
- Metro
- —
- State GDP YoY
- ▲ 2.60%
- F500 in state
- 92
Industry mix (Fortune 500 HQ in NY)
| Industry | F500 HQs | Revenue |
|---|---|---|
| Financial Services | 10 | $950B |
|
||
| Consumer Goods | 9 | $162B |
|
||
| Insurance | 4 | $225B |
|
||
| Telecommunications | 2 | $144B |
|
||
| Pharmaceuticals | 2 | $112B |
|
||
| Media / Entertainment | 2 | $69B |
|
||
Price history
-53.7% since first listed2 events — show timeline
- 2026-04-24 Listed $19,900 WNYREIS
- 2000-12-09 Listed $43,000 UNYREIS
Property tax history
-5.9%/yrLatest (2025): $1,490 · +0.2% YoY. Source: county tax records.
Cash-flow waterfall
monthlySold comps — $/sqft
last 12 mo · ≤1 miLoading sold comps…