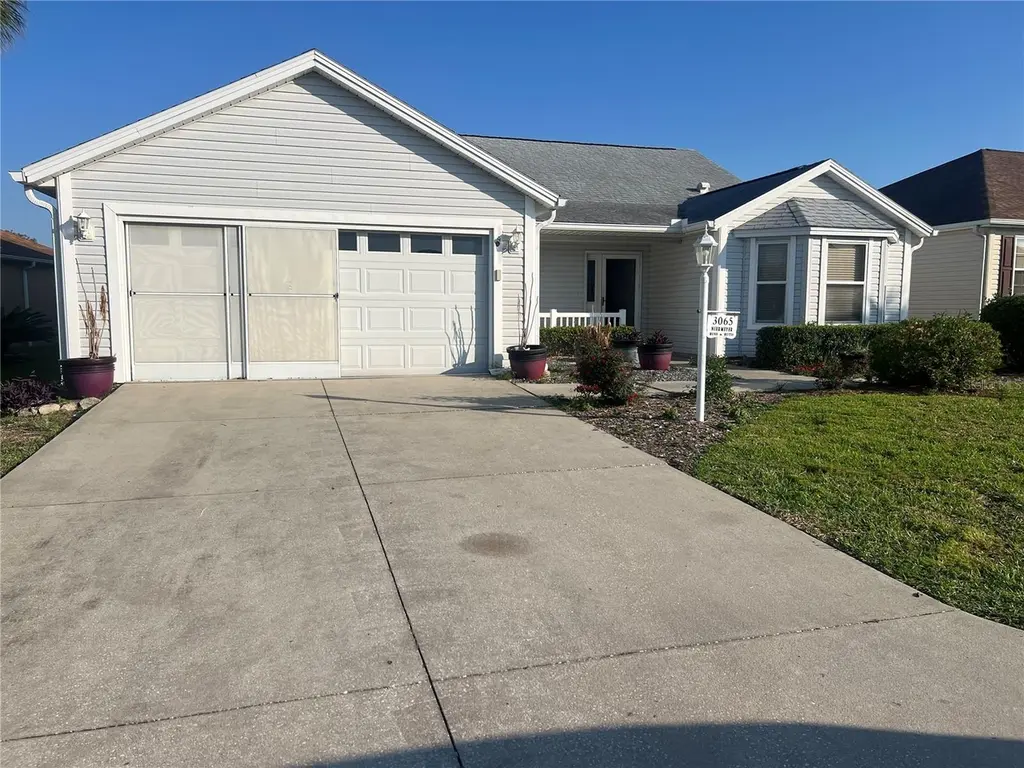
3065 Batally Ct · The Villages, FL
Flood risk 1/10 · Minimal
- FEMA flood zone
- X (unshaded)
- Chance of flooding over 30 yrs
- 0.0%
- Est. flood insurance / yr
- $507 – $1,088
Fire risk 4/10 · Minor
- Est. fire insurance / yr
- $947 – $1,759
Heat risk 9/10 · Severe
- Hot days now (above 109°F)
- 7 days/yr
- Hot days in 30 yrs
- 22 days/yr
Wind risk 9/10 · Severe
- Chance of severe wind over 30 yrs
- 99.0%
Air-quality risk 3/10 · Minor
- Unhealthy air days now
- 2 days/yr
- Unhealthy air days in 30 yrs
- 3 days/yr
Risk factors via First Street. Map © Google.
Why this score? — see what drove the C grade
The composite is a weighted blend of 9 inputs, each scored 0–100. Each bar is that input's sub-score; the figure is the points it added to the 100-point composite (weight × sub-score).
- Cash flow +18.5/30.0
- ARV discount +15.0/15.0
- DSCR +5.8/10.0
- Schools +5.2/10.0
- 1% rule +5.1/10.0
- Rent growth +3.5/5.0
- Livability +3.5/5.0
- Condition / age +2.5/5.0
- Appreciation +0.0/10.0
$299,000
🖨 Deal sheet 📄 Offer letter ✓ Due diligence
Listing remarks
GREAT PROPERTY FOR AN INVESTOR IN VERY DESIREABLE AREA (GLENBROOK)
Key facts
- 5,700 sq ft lot
- 2 garage spots
- Built 2000
Neighborhood map
What this means for you Summary
Snapshot
- This is a 3-bed/2.0-bath single-family listed at $299k.
Deal economics
- At list price, monthly cash flow is $287 ($3k/yr) — positive.
- The deal already cash-flows at list — no discount required.
- Meets the 1% rule at list price ($3k rent vs $299k).
- Cap rate 7.4% vs local median 5.0% in The Villages — top-decile yield for the area; either an underpriced asset or a hidden risk that comps aren't pricing in. Stress-test before assuming the spread holds.
Location & tenants
- Location reads 70/100 on livability (#431 in FL) — a middle-class / working-renter tenant base. Strengths: schools A+, crime A+, housing A; Watch: amenities F, commute F, health & safety F.
- Sumter (rural): math 61% / reading 61% proficiency, ranked #11 of 73 in FL (top 15%) — acceptable for families but not a draw, mixed tenant base, ~2y average lease.
- Market conditions: Rents rising (+3.9%/yr); 550 active listings in the ZIP; 14 comparable units currently listed for rent nearby; rentals at typical pace (median 21d on market — plan ~3-4 weeks tenant-placement turnaround); 3,961 units permitted in Sumter County in 2024 (248 in 5+ unit buildings).
- At $3,014/mo this rent would consume 49% of the median local household income ($74k/yr) (locally 987% of renters already pay >50% of income on rent) — very limited rent-growth headroom before tenants either downsize or default.
Forward outlook
- Local home prices are declining (-3.0%/yr); year-one equity from $2k of loan paydown is wiped out by about $9k of value loss. Plan a longer hold.
- Sumter County population projected at +45% by 2050 — long-run rental-demand tailwind backs the buy-and-hold thesis.
Negotiation context
- Only 0 days on market — expect competitive offers; lowballing is unlikely to land.
Risks & watch-outs
- Climate carrying-cost: severe wind risk, 99% chance of damaging wind over 30y; extreme-heat days projected 7→22/yr by 2055 (HVAC capex compounding) — expect insurance premiums to compound above CPI over the hold.
Questions for the listing agent
- What does the HOA fee cover, when was the last increase, and are there any pending special assessments or reserve-fund shortfalls?
- Is there a deadline driving the sale (1031 exchange, divorce, estate, relocation)? That informs how much negotiation room exists.
- Schools are A-rated — typically a magnet for longer-tenancy family renters. What's the average tenant stay here, and is there a school-zone premium baked into asking?
- What's the average days-on-market for RENTAL listings here right now (not sales)? A rising rental-DOM trend means longer vacancies and softer asking-rent achievability than the comps imply.
- What's the recent tenant-quality profile in this submarket — average credit score on applications, eviction rate, late-payment / NSF rate, and stable-employment percentage? A property-management company in the area should have these aggregated.
- How much new for-sale + rental construction is in the pipeline within 1–3 miles? Heavy new supply typically softens prices + rents 12–24 months out; constrained supply supports both.
Investment metrics
- 1% rule
- 1.01% ✓
- Cap rate
- 7.44%
- Cash-on-cash
- 4.11%
- DSCR
- 1.18
- GRM
- 8.3
CMA / ARV
- ARV (on-the-fly)
- $386,918
- Comps found
- 12
Show comp detail 12 sales within ~0.75 mi
| Address | Dist | Beds/Ba | Sqft | Sold | Price | $/sf | Match |
|---|---|---|---|---|---|---|---|
| 3065 Batally Ct | 0.00mi | 3/2.0 | 1,906 (0%) | 1mo | $275,000 | $144 | 99 |
| 1252 Weaton Ct | 0.25mi | 3/2.0 | 1,905 (-0%) | 2mo | $330,000 | $173 | 87 |
| 2967 Saint Thomas Ln | 0.15mi | 3/2.0 | 2,032 (+7%) | 2mo | $460,000 | $226 | 80 |
| 1404 Valparaiso St | 0.66mi | 3/2.0 | 1,892 (-1%) | 2mo | $335,000 | $177 | 66 |
| 1426 LA Hermosa Dr | 0.67mi | 3/2.0 | 1,892 (-1%) | 3mo | $412,500 | $218 | 65 |
| 3328 Archer Ave | 0.56mi | 3/2.0 | 1,812 (-5%) | 3mo | $415,000 | $229 | 63 |
| 1564 Oak Forest Dr | 0.56mi | 3/2.0 | 2,016 (+6%) | 2mo | $410,000 | $203 | 62 |
| 3089 Burbank Ln | 0.30mi | 3/2.0 | 1,653 (-13%) | 2mo | $410,000 | $248 | 62 |
| 1277 Northbrook Pl | 0.34mi | 3/2.0 | 1,653 (-13%) | 1mo | $308,000 | $186 | 61 |
| 1422 Segovia Pl | 0.63mi | 3/2.0 | 2,044 (+7%) | 0mo | $377,224 | $185 | 58 |
| 1075 Napier Ct | 0.73mi | 3/2.0 | 1,767 (-7%) | 1mo | $525,000 | $297 | 52 |
| 2630 Caribe Dr | 0.64mi | 3/2.0 | 1,674 (-12%) | 2mo | $320,000 | $191 | 48 |
Match score weights: distance 35% · size 25% · config 20% · recency 20%. Top-matched comps best support the ARV.
Projected returns pro-forma
-3.0% appreciation · 3.92% rent growth · sell at horizon
- IRR
- -8.8%
- Equity multiple
- 0.67×
- Total profit
- $-27,293
- Equity at exit
- $44,582
- IRR
- 1.9%
- Equity multiple
- 1.14×
- Total profit
- $11,798
- Equity at exit
- $25,852
Cash invested: $83,720 (down + closing). Projections, not guarantees.
Landlord ↔ Tenant lean methodology
- Overall (STATE)
- 87 Strongly Landlord-Friendly
- State Florida
- 87 Strongly Landlord-Friendly · R+3
- County
- — inherits STATE
- City
- — inherits STATE
ZIP-level market 32162
- Home prices YoY
- -6.9%
- Rents YoY
- 3.9%
- Active inventory
- 550
- Price-to-rent
- 8.3×
Monthly cashflow live
- Estimated rent
- $3,014 high interval (Pro) →
- Mortgage (P&I)
- −$1,568
- Tax from tax record
- −$197 /mo · $2,369/yr
- Insurance
- −$125
- HOA
- −$204
- Vacancy / Maint / Mgmt
- −$633
- Net cashflow
- $287
Break-even live
UW: 25.0% down · 7.5% · 30yr · 1.5% tax · 5.0% vac · 8.0% maint · 8.0% mgmt
Financing live
Cash to close
- Down payment
- $74,750
- Closing costs
- $8,970
- Reserves months
- —
- Total cash needed
- —
Loan-product check · same deal, 3 products live
Conventional
25% down · 7.5% · 30yr
- Down + closing
- —
- Monthly P&I
- —
- Monthly cashflow
- —
- DSCR
- —
- Eligible?
- —
Personal DTI + credit; lowest rate.
DSCR
20% down · 8.5% · 30yr
- Down + closing
- —
- Monthly P&I
- —
- Monthly cashflow
- —
- DSCR
- —
- Eligible?
- —
No personal income docs; deal must DSCR.
Hard money
10% down · 12.0% · 12mo
- Down + closing
- —
- Monthly P&I
- —
- Monthly cashflow
- —
- DSCR
- —
- Eligible?
- —
Short-term bridge; refi at stabilization.
Rent comps 14 comps
| Address | Beds | Baths | Sqft | Rent | $/sqft | DOM | Units | Dist |
|---|---|---|---|---|---|---|---|---|
| 3057 Saint Thomas Ln The Villages, FL | 3.0 | 2.0 | 2044 | $2,850 | $1.39 | 21d | 1 | 0.06mi |
| 888 Radclife Berea Pl The Villages, FL | 2.0 | 2.0 | 1288 | $4,200 | $3.26 | 21d | 1 | 0.49mi |
| 971 Kingmont Ter The Villages, FL | 3.0 | 2.0 | 1392 | $3,400 | $2.44 | 21d | 1 | 0.53mi |
| 3301 Archer Ave The Villages, FL | 2.0 | 2.0 | 2117 | $5,000 | $2.36 | 21d | 1 | 0.60mi |
| 3545 Idlewood Loop The Villages, FL | 2.0 | 2.0 | 1240 | $4,500 | $3.63 | 21d | 1 | 0.89mi |
| 3260 Atwell Ave The Villages, FL | 3.0 | 2.0 | 1392 | $2,500 | $1.80 | 21d | 1 | 0.93mi |
| 12580 NE 49th Dr Oxford, FL | 3.0 | 2.0 | 1940 | $2,400 | $1.24 | 21d | 1 | 1.05mi |
| 6367 NE 118th Ave The Villages, FL | 3.0–4.0 | 2.0–2.5 | 1645 | $1,925 | $1.17 | 21d | 10 | 1.08mi |
| 12362 NE 50th Vw Oxford, FL | 4.0 | 4.0 | 1929 | $2,300 | $1.19 | 21d | 1 | 1.17mi |
| 12388 NE 48th Loop Oxford, FL | 3.0 | 2.0 | 1426 | $1,700 | $1.19 | 21d | 1 | 1.34mi |
| 424 Bowman Ter The Villages, FL | 3.0 | 2.0 | 2000 | $5,400 | $2.70 | 21d | 1 | 1.40mi |
| 17713 SE 95th Cir Summerfield, FL | 3.0 | 2.0 | 1450 | $2,000 | $1.38 | 21d | 1 | 1.46mi |
| 8544 SE 177th Bartram Loop The Villages, FL | 2.0 | 2.0 | 1265 | $1,900 | $1.50 | 21d | 1 | 1.49mi |
| 2126 Sansores St Lady Lake, FL | 3.0 | 2.0 | 1748 | $3,700 | $2.12 | 21d | 1 | 1.49mi |
HOA detail
- Monthly dues
- $204 · $2,448/yr
Listing history 2 events
-
2026-03-28$299,000
-
2026-03-28historical
ⓘ Source: listings_history table (triggers on properties + properties_extension) + one-shot
backfill from property_details.listing_events for pre-trigger history.
Tax reassessment forecast FL · Resets to sale price
- Current annual tax
- $2,369 · $197/mo
- Projected year-2 tax
- $2,482 · $207/mo
- Expected delta
- +$113/yr (+$9/mo · 4.8%)
ⓘ Screening estimate from a state-policy table — verify with the county assessor before closing.
Climate risk First Street
- Flood 1/10 Low FEMA zone X (unshaded) · 0% chance over 30 yrs
- Wildfire 4/10 Moderate
- Heat 9/10 Extreme 7 d/yr ≥109°F today · 22 d/yr by 30 yrs out
- Wind 9/10 Extreme 99% chance of damaging wind over 30 yrs
- Air quality 3/10 Moderate 2 unhealthy d/yr today · 3 by 30 yrs out
Nearby sold comps map
Loading sold comps map…
Walkable amenities ~0.75 mi
Loading nearby amenities…
Taxation est. · year 1
- Rental income
- $36,167
- − Mortgage interest
- −$16,749
- − Property taxes
- −$2,369
- − Insurance
- −$1,495
- − Repairs & maintenance
- −$2,893
- − Management
- −$2,893
- − HOA
- −$2,448
- − Depreciation
- −$8,698
- Taxable loss
- −$1,378
- Est. tax savings @ 24.0%
- +$331
- After-tax cash flow
- $3,775/yr
For passive investors: Depreciation is non-cash, so a rental often shows a tax loss while cash-flowing — sheltering income. Rental losses are passive: they offset passive income freely, and up to $25,000/yr can offset ordinary (W-2) income if you actively participate and your MAGI is under $100k (phasing out to $0 by $150k); unused losses carry forward. On sale, claimed depreciation is recaptured at up to 25%, and gains may owe capital-gains tax (a 1031 exchange can defer both). Figures are a year-1 estimate at your 24.0% rate — not tax advice; consult a CPA.
Schools (NCES district)
- District
- Sumter
- NCES district ID
- 1201800
- Math proficiency
- 61% ▼ -4.00%
- Reading proficiency
- 61% ▼ -2.00%
- Median HH income
- $48,240
- Composite
- 51.74/100
- National rank
- #1682
- State rank
- #11 of 73 in FL
Livability — The Villages
- Score
- 70/100
- State rank
- #431
- US rank
- #7363
Category grades
Schools grade is shown separately in the Schools card above.
Census & demographics
- Census place
- The Villages, FL
- County
- Sumter County · 110,591 people
- City population
- 83,973
- Metro
- The Villages, FL
- Population (ZIP)
- 55,424
- Household income
- $74,119
- Rent vs Own
- Severe rent burden
- 987.0
Population outlook (Sumter County) Hauer SSP2
- Today (2025)
- 161,172 people
- By 2030
- 180,083 · +11.7%
- By 2040
- 209,892 · +30.2%
- By 2050
- 234,186 · +45.3%
- By 2075
- 284,602 · +76.6%
- By 2100
- 317,039 · +96.7%
Race, ethnicity, and origin ACS 2023
- Neighborhood character
- Predominantly White (95%)
- Race & ethnicity
- White 95% Two or more races 2% Hispanic / Latino 2% Asian 1% Black 1%
- Common ancestry
- Romanian 7% Slovak 4% Lithuanian 4%
- Foreign-born
- 5% · Canada
- Languages at home
- 96% English-only · Spanish 1% Tagalog/Filipino 1%
Political lean MEDSL · Sumter
- 2024 margin
- Solid R (+37.6) · D 30.9% · R 68.6%
- 2008→2024 swing
- -10.6pp toward R · 2008: -27.0pp · 2024: -37.6pp
- All cycles
- 2024: R+37.6 2020: R+36.1 2016: R+39.2 2012: R+34.9 2008: R+27.0
Not yet ingested
- Civics
- —
Market trends
- HPI YoY
- ▼ -16.16%
- Current HPI
- 218.1956
- Rent YoY
- ▲ 3.92%
- Metro
- The Villages, FL
- State GDP YoY
- ▲ 3.28%
- F500 in state
- 36
Industry mix (Fortune 500 HQ in FL)
| Industry | F500 HQs | Revenue |
|---|---|---|
| Industrial Technology | 2 | $29B |
|
||
| Insurance | 2 | $17B |
|
||
| Retail | 1 | $60B |
|
||
| Technology Distribution | 1 | $58B |
|
||
| Homebuilding | 1 | $35B |
|
||
| Technology Manufacturing | 1 | $35B |
|
||
Price history
2 events — show timeline
- 2026-03-28 Listing Removed — Stellar MLS as Distributed by MLS Grid
- 2026-03-28 Listed $299,000 Stellar MLS as Distributed by MLS Grid
Property tax history
+1.6%/yrLatest (2025): $2,369 · +1.3% YoY. Source: county tax records.
Cash-flow waterfall
monthlySold comps — $/sqft
last 12 mo · ≤1 miLoading sold comps…