 Triplex
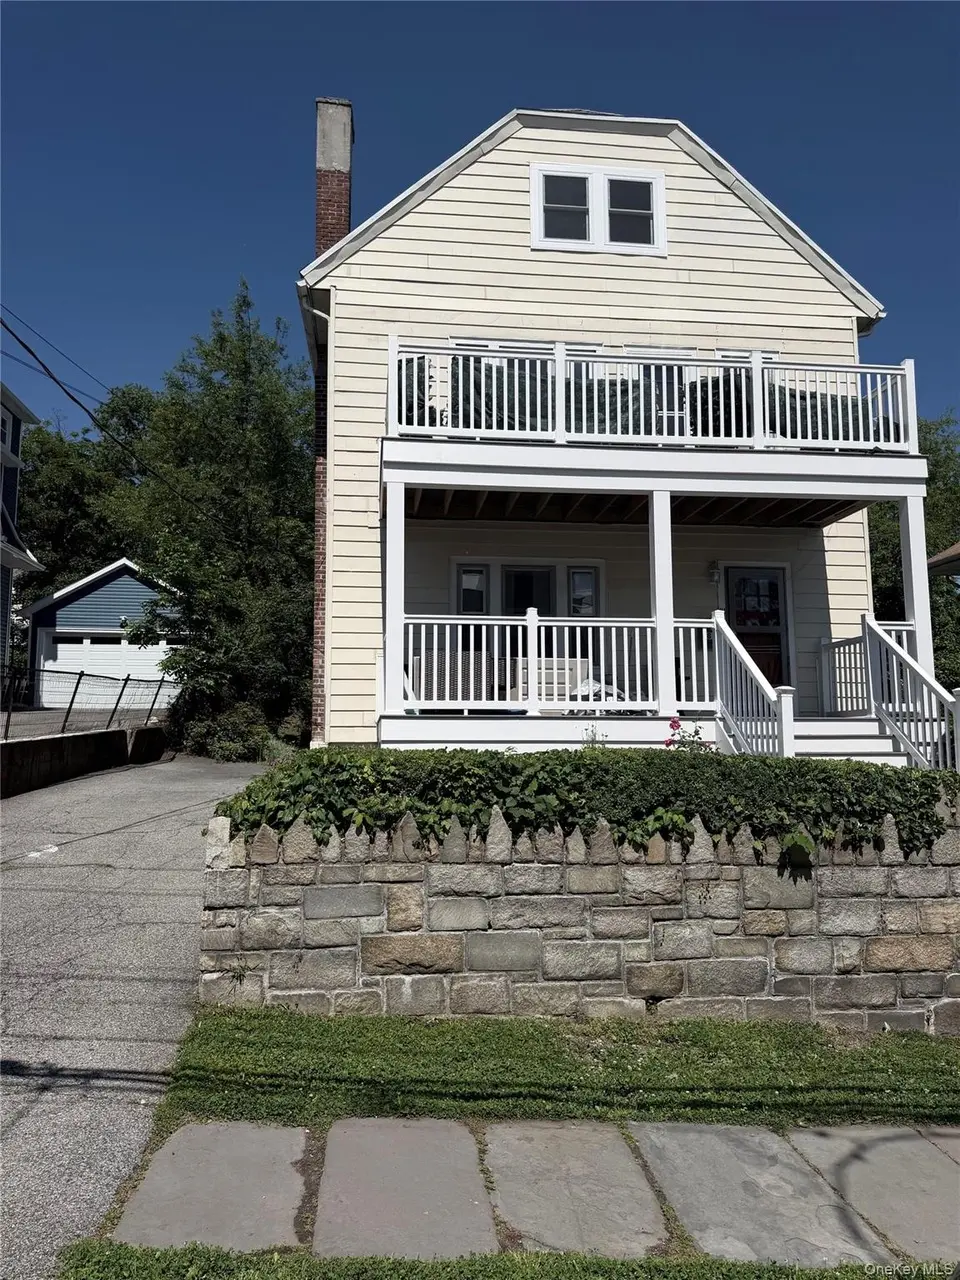
81 Waring Pl · Yonkers, NY
Flood risk 1/10 · Minimal
- FEMA flood zone
- X (unshaded)
- Chance of flooding over 30 yrs
- 0.0%
- Est. flood insurance / yr
- $507 – $1,088
Fire risk 1/10 · Minimal
- Est. fire insurance / yr
- $691 – $1,283
Heat risk 6/10 · Moderate
- Hot days now (above 99°F)
- 7 days/yr
- Hot days in 30 yrs
- 15 days/yr
Wind risk 6/10 · Moderate
- Chance of severe wind over 30 yrs
- 27.0%
Air-quality risk 3/10 · Minor
- Unhealthy air days now
- 3 days/yr
- Unhealthy air days in 30 yrs
- 4 days/yr
Risk factors via First Street. Map © Google.
Why this score? — see what drove the C+ grade
The composite is a weighted blend of 9 inputs, each scored 0–100. Each bar is that input's sub-score; the figure is the points it added to the 100-point composite (weight × sub-score).
- Cash flow +29.3/30.0
- DSCR +10.0/10.0
- 1% rule +6.9/10.0
- Schools +4.1/10.0
- Livability +3.4/5.0
- ARV discount +2.5/15.0
- Rent growth +2.5/5.0
- Condition / age +2.5/5.0
- Appreciation +0.0/10.0
$800,000
🖨 Deal sheet (PDF) 📄 Offer letter ✓ Due diligence
Multi-family units
County records classify this as Multi-Family (2-4 Unit). Listing-text estimate: 3 units. confirmed
Listing remarks MLS
No Expenses Listed As All Units Are Vacant. Great Investment Proper Move-in Condition, All Hardwood Floors Mint Cond. Has C. O. For 3fa Nice Well Maintained House On Take-pride Street. Anxious Owner.
Key facts
- Three gas meters
- Well maintained
- Separately metered
Tags
Property features AI
Finance
- Financial info: Property type is a triplex
Exterior
- Parking: Three total parking spaces; Driveway parking; On-street parking
- Security: Security lights; Security system; Smoke detectors; Video cameras
- Utilities: Con-Edison electric service; Public sewer; Cable connected; Electricity connected; Natural gas connected; Trash collection (public); Water connected
- Home design: Triplex
- Construction: Vinyl siding
- Exterior features: Balcony; Outdoor lighting; Mailbox; Rain gutters; Back yard; Front yard; Garden; Near golf course; Near public transit; Near shops; Near schools
Interior
- Kitchen: Eat-in kitchen (appliances not specified)
- Bedrooms: Two 3-bedroom units; One 1-bedroom unit
- Bathrooms: Three full bathrooms
- Heating & cooling: Radiant heating; No central cooling
- Interior features: First-floor bedroom; Eat-in kitchen; High-speed internet available; Primary bathroom; Washer/dryer hookup; Deck
- Laundry & utility: Washer/dryer hookup
Neighborhood map
What this means for you Summary
Snapshot
- This is a 3 × 3-bed/?-bath units multifamily listed at $800k.
Deal economics
- At list price, monthly cash flow is $3k ($34k/yr) — positive. Per door: $934/mo.
- The deal already cash-flows at list — no discount required.
- Meets the 1% rule at list price ($9k rent vs $800k).
- Cap rate 10.5% vs local median 5.3% in Yonkers — top-decile yield for the area; either an underpriced asset or a hidden risk that comps aren't pricing in. Stress-test before assuming the spread holds.
Location & tenants
- Location reads 68/100 on livability (#528 in NY) — a middle-class / working-renter tenant base. Strengths: employment A, commute B; Watch: amenities F, cost of living F.
- Yonkers City School District (suburban): math 41% / reading 54% proficiency, ranked #413 of 590 in NY (top 70%) — families likely to look elsewhere, expect single-tenant / working-renter base with shorter leases; 64% free/reduced lunch — lower-income household profile, screen leases tightly.
- Zoned schools: Yonkers Early Childhood Academy (327 students, 72% FRL); Yonkers Middle School (math 17% / reading 37%, grade F, #587 of 729 statewide, top 81%, 601 students, 88% FRL); Yonkers High School (math 92% / reading 88%, grade A+, #238 of 1,100 statewide, top 23%, 1,060 students, 76% FRL) — zoned schools average 79% FRL vs 64% district-wide (15 pts higher); higher-poverty schools than district average — tighter screening recommended.
- Market conditions: 75 active listings in the ZIP; solid renter incomes; 954 units permitted in Westchester County in 2024 (649 in 5+ unit buildings).
- At $9,497/mo this rent would consume 127% of the median local household income ($90k/yr) (locally 1216% of renters already pay >50% of income on rent) — very limited rent-growth headroom before tenants either downsize or default.
Forward outlook
- Local home prices are declining (-3.0%/yr); year-one equity from $6k of loan paydown is wiped out by about $24k of value loss. Plan a longer hold.
- Westchester County population projected at +10% by 2050 — modest demand growth; plan on rents tracking national, not racing it.
- At projected returns (-3.0% appreciation + 3.0% rent growth), your $224k cash investment doubles in ~8 years — after that, you're playing with house money.
Negotiation context
- Only 11 days on market — expect competitive offers; lowballing is unlikely to land.
- 2 sale attempts since 30y ago with the ask held roughly flat each time — persistent listings suggest the price (not the market) is what's stuck; bring a comps-based counter.
- Current owner paid $200k; list at $800k implies a 300% gain — meaningful room to come down on a strong offer.
Risks & watch-outs
- Watch-outs: built in 1908 — expect roof / HVAC / electrical / plumbing capex.
- Climate carrying-cost: major wind risk, 27% chance of damaging wind over 30y; extreme-heat days projected 7→15/yr by 2055 (HVAC capex compounding) — expect insurance premiums to compound above CPI over the hold.
Questions for the listing agent
- Can we see the unit-by-unit rent roll, current vacancy, and any below-market leases? What's the average tenancy length?
- What capital expenditures (roof, boiler, parking lot, exteriors) have been made in the last 5 years, and what's planned in the next 2?
- Built in 1908 — when were the roof, HVAC, electrical panel, plumbing, and water heater last replaced?
- Is there a deadline driving the sale (1031 exchange, divorce, estate, relocation)? That informs how much negotiation room exists.
- What's the average days-on-market for RENTAL listings here right now (not sales)? A rising rental-DOM trend means longer vacancies and softer asking-rent achievability than the comps imply.
- What's the recent tenant-quality profile in this submarket — average credit score on applications, eviction rate, late-payment / NSF rate, and stable-employment percentage? A property-management company in the area should have these aggregated.
- How much new apartment / multifamily construction is in the pipeline within 1–3 miles? Heavy new supply (>2% of stock underway) typically softens rents 12–24 months out; light construction supports rent growth.
Investment metrics
- 1% rule
- 1.19% ✓
- Cap rate
- 10.50%
- Cash-on-cash
- 15.01%
- DSCR
- 1.67
- GRM
- 7.0
CMA / ARV
- ARV (on-the-fly)
- $720,000
- Comps found
- 4
Show comp detail 4 sales within ~0.75 mi
| Address | Dist | Beds/Ba | Sqft | Sold | Price | $/sf | Match |
|---|---|---|---|---|---|---|---|
| 203 Woodland Ave | 0.44mi | 7/3.0 (-1) | 2,534 (+1%) | 7mo | $770,000 | $304 | 66 |
| 179 Woodland Ave | 0.39mi | 7/3.0 (-1) | 2,400 (-4%) | 16mo | $555,000 | $231 | 56 |
| 338 Ashburton Ave | 0.69mi | 8/3.0 | 2,187 (-12%) | 6mo | $630,000 | $288 | 42 |
| 24 Union Pl | 0.55mi | 9/3.0 (+1) | 2,826 (+13%) | 20mo | $650,000 | $230 | 31 |
Match score weights: distance 35% · size 25% · config 20% · recency 20%. Top-matched comps best support the ARV.
Projected returns pro-forma
-3.0% appreciation · 3.0% rent growth · sell at horizon
- IRR
- 5.6%
- Equity multiple
- 1.22×
- Total profit
- $48,509
- Equity at exit
- $119,283
- IRR
- 15.0%
- Equity multiple
- 2.21×
- Total profit
- $270,614
- Equity at exit
- $69,169
Cash invested: $224,000 (down + closing). Projections, not guarantees.
Landlord ↔ Tenant lean methodology
- Overall (CITY)
- 5 Strongly Tenant-Friendly
- State New York
- 15 Strongly Tenant-Friendly · D+10
- County
- — inherits STATE
- City Yonkers
- 5 Strongly Tenant-Friendly · D+20
ZIP-level market 10703
- Home prices YoY
- -13.2%
- Active inventory
- 75
- Price-to-rent
- 21.1×
Monthly cashflow live
- Estimated rent
- $9,497 high interval (Pro) →
- Mortgage (P&I)
- −$4,195
- Tax from tax record
- −$171 /mo · $2,055/yr
- Insurance
- −$333
- HOA
- −$0
- Vacancy / Maint / Mgmt
- −$1,994
- Net cashflow
- $2,803
Break-even live
Sensitivity live
| Price | -10% $3,256 | -5% $3,029 | +0% $2,803 | +5% $2,576 | +10% $2,350 |
|---|---|---|---|---|---|
| Rent | -10% $2,053 | -5% $2,428 | +0% $2,803 | +5% $3,178 | +10% $3,553 |
| Rate | -1.0pp $3,206 | -0.5pp $3,006 | base $2,803 | +0.5pp $2,595 | +1.0pp $2,385 |
3-unit breakdown (identical units grouped — click to expand)
| Units | Beds | Baths | Est. rent |
|---|---|---|---|
| 3× units | 3 | — | $9,498 |
| #1 | 3 | — | $3,166 |
| #2 | 3 | — | $3,166 |
| #3 | 3 | — | $3,166 |
| Total (3 units) | $9,497 | ||
UW: 25.0% down · 7.5% · 30yr · 1.5% tax · 5.0% vac · 8.0% maint · 8.0% mgmt
Financing live
Cash to close
- Down payment
- $200,000
- Closing costs
- $24,000
- Reserves months
- —
- Total cash needed
- —
Loan-product check · same deal, 3 products live
Conventional
25% down · 7.5% · 30yr
- Down + closing
- —
- Monthly P&I
- —
- Monthly cashflow
- —
- DSCR
- —
- Eligible?
- —
Personal DTI + credit; lowest rate.
DSCR
20% down · 8.5% · 30yr
- Down + closing
- —
- Monthly P&I
- —
- Monthly cashflow
- —
- DSCR
- —
- Eligible?
- —
No personal income docs; deal must DSCR.
Hard money
10% down · 12.0% · 12mo
- Down + closing
- —
- Monthly P&I
- —
- Monthly cashflow
- —
- DSCR
- —
- Eligible?
- —
Short-term bridge; refi at stabilization.
Listing history 8 events
-
2026-06-13statusdays on market $800,000 Pending 11 DOM
-
2026-06-09days on market $800,000 Active 8 DOM
-
2026-06-08days on market $800,000 Active 7 DOM
-
2026-06-07days on market $800,000 Active 6 DOM
-
2026-06-04days on market $800,000 Active 3 DOM
-
2026-06-03days on market $800,000 Active 2 DOM
-
2026-06-02remarks 699-char remark
-
2026-06-02$800,000 Active 1 DOM
ⓘ Source: listings_history table (triggers on properties + properties_extension) + one-shot
backfill from property_details.listing_events for pre-trigger history.
Tax reassessment forecast NY · Partial reset (capped growth)
- Current annual tax
- $2,055 · $171/mo
- Projected year-2 tax
- $7,787 · $649/mo
- Expected delta
- +$5,733/yr (+$478/mo · 279.0%)
ⓘ Screening estimate from a state-policy table — verify with the county assessor before closing.
Climate risk First Street
- Flood 1/10 Low FEMA zone X (unshaded) · 0% chance over 30 yrs
- Wildfire 1/10 Low
- Heat 6/10 Major 7 d/yr ≥99°F today · 15 d/yr by 30 yrs out
- Wind 6/10 Major 27% chance of damaging wind over 30 yrs
- Air quality 3/10 Moderate 3 unhealthy d/yr today · 4 by 30 yrs out
Nearby sold comps map
Loading sold comps map…
Walkable amenities ~0.75 mi
Loading nearby amenities…
Taxation est. · year 1
- Rental income
- $113,964
- − Mortgage interest
- −$44,812
- − Property taxes
- −$2,055
- − Insurance
- −$4,000
- − Repairs & maintenance
- −$9,117
- − Management
- −$9,117
- − Depreciation
- −$23,273
- Taxable income
- $21,590
- Est. tax owed @ 24.0%
- −$5,182
- After-tax cash flow
- $28,452/yr
For passive investors: Depreciation is non-cash, so a rental often shows a tax loss while cash-flowing — sheltering income. Rental losses are passive: they offset passive income freely, and up to $25,000/yr can offset ordinary (W-2) income if you actively participate and your MAGI is under $100k (phasing out to $0 by $150k); unused losses carry forward. On sale, claimed depreciation is recaptured at up to 25%, and gains may owe capital-gains tax (a 1031 exchange can defer both). Figures are a year-1 estimate at your 24.0% rate — not tax advice; consult a CPA.
Schools (NCES district)
- District
- Yonkers City School District
- NCES district ID
- 3631920
- Math proficiency
- 41% ▼ -1.00%
- Reading proficiency
- 54% ▲ 14.00%
- Median HH income
- $58,042
- Composite
- 41.43/100
- National rank
- #3471
- State rank
- #413 of 590 in NY
Livability — Yonkers
- Score
- 68/100
- State rank
- #528
- US rank
- #9394
Category grades
Schools grade is shown separately in the Schools card above.
Census & demographics
- Census place
- Yonkers, NY
- County
- Westchester County · 709,332 people
- City population
- 212,407
- Metro
- New York-Newark-Jersey City, NY-NJ-PA
- Population (ZIP)
- 22,586
- Household income
- $89,773
- Rent vs Own
- Severe rent burden
- 1216.0
Population outlook (Westchester County) Hauer SSP2
- Today (2025)
- 1,028,035 people
- By 2030
- 1,051,636 · +2.3%
- By 2040
- 1,098,520 · +6.9%
- By 2050
- 1,136,044 · +10.5%
- By 2075
- 1,196,925 · +16.4%
- By 2100
- 1,175,147 · +14.3%
Race, ethnicity, and origin ACS 2023
- Neighborhood character
- Diverse neighborhood (Simpson 0.69)
- Race & ethnicity
- Hispanic / Latino 43% White 30% Black 19% Two or more races 16% Asian 5%
- Hispanic origin (detail)
- Mexican 5% Puerto Rican 9% Dominican 13%
- Common ancestry
- Romanian 4% Russian 2% Subsaharan African 1%
- Foreign-born
- 32% · Canada, Jamaica, China
- Languages at home
- 50% English-only · Spanish 37% Other Indo-European 5% Russian/Polish/Slavic 2%
Political lean MEDSL · Westchester
- 2024 margin
- Strong D (+26.3) · D 63.1% · R 36.9%
- 2008→2024 swing
- -1.3pp toward R · 2008: 27.6pp · 2024: 26.3pp
- All cycles
- 2024: D+26.3 2020: D+36.3 2016: D+32.8 2012: D+22.2 2008: D+27.6
Not yet ingested
- Civics
- —
Market trends
- HPI YoY
- ▼ -47.22%
- Current HPI
- 311.0396
- Rent YoY
- —
- Metro
- New York-Newark-Jersey City, NY-NJ-PA
- State GDP YoY
- ▲ 2.60%
- F500 in state
- 92
Industry mix (Fortune 500 HQ in NY)
| Industry | F500 HQs | Revenue |
|---|---|---|
| Financial Services | 10 | $950B |
|
||
| Consumer Goods | 9 | $162B |
|
||
| Insurance | 4 | $225B |
|
||
| Telecommunications | 2 | $144B |
|
||
| Pharmaceuticals | 2 | $112B |
|
||
| Media / Entertainment | 2 | $69B |
|
||
Price history
+300.0% since first listed5 events — show timeline
- 2026-05-29 Listed $800,000 OneKey® MLS as Distributed by MLS Grid
- 1996-12-06 Sold (Public Records) $200,000 Public Records
- 1996-11-26 Price Changed $229,000 HGMLS
- 1996-11-26 Sold (MLS) $200,000 HGMLS
- 1996-08-06 Listed $200,000 HGMLS
Property tax history
-22.0%/yrLatest (2025): $2,055 · +0.7% YoY. Source: county tax records.
Cash-flow waterfall
monthlySold comps — $/sqft
last 12 mo · ≤1 miLoading sold comps…