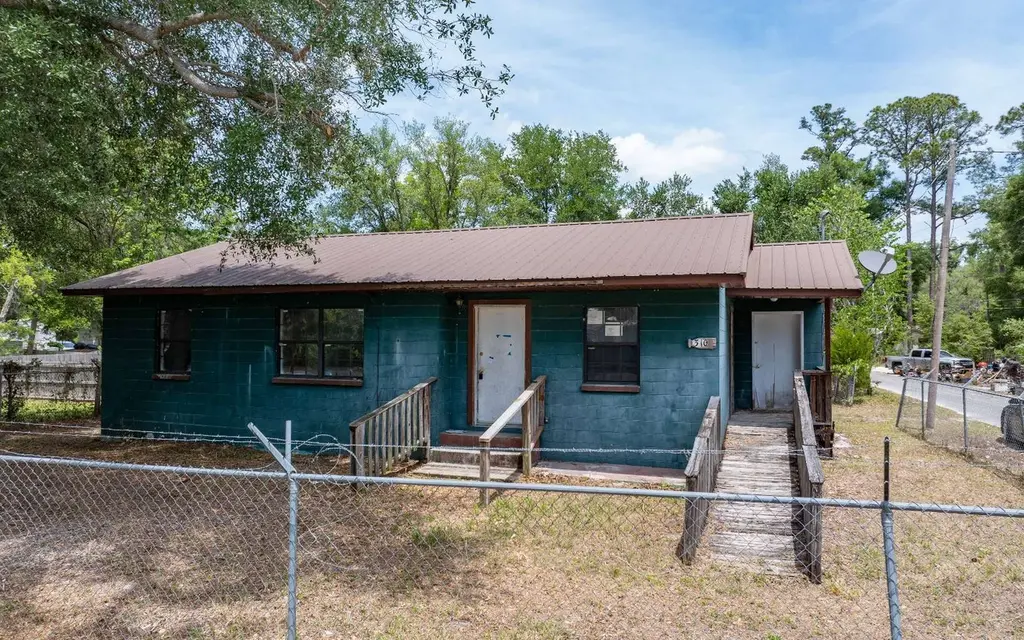
310 SW Taylor Ave · Mayo, FL
Flood risk 1/10 · Minimal
- FEMA flood zone
- X (unshaded)
- Chance of flooding over 30 yrs
- 0.0%
- Est. flood insurance / yr
- $507 – $1,088
Fire risk 8/10 · Major
- Est. fire insurance / yr
- $947 – $1,759
Heat risk 8/10 · Major
- Hot days now (above 108°F)
- 7 days/yr
- Hot days in 30 yrs
- 20 days/yr
Wind risk 9/10 · Severe
- Chance of severe wind over 30 yrs
- 99.0%
Air-quality risk 4/10 · Minor
- Unhealthy air days now
- 4 days/yr
- Unhealthy air days in 30 yrs
- 7 days/yr
Risk factors via First Street. Map © Google.
Why this score? — see what drove the B+ grade
The composite is a weighted blend of 9 inputs, each scored 0–100. Each bar is that input's sub-score; the figure is the points it added to the 100-point composite (weight × sub-score).
- Cash flow +30.0/30.0
- 1% rule +10.0/10.0
- DSCR +10.0/10.0
- Appreciation +8.4/10.0
- ARV discount +7.5/15.0
- Schools +5.5/10.0
- Livability +3.2/5.0
- Rent growth +2.5/5.0
- Condition / age +2.5/5.0
$68,700
🖨 Deal sheet 📄 Offer letter ✓ Due diligence
Listing remarks
Opportunity awaits at this 3-bedroom, 1-bath home located in the heart of Mayo, FL. Built in 1981, this property offers just over 1,000 sqft on a corner lot. Great option for investors, flippers, or buyers ready to bring their vision to life. Inside, you’ll find a functional layout and plenty of potential for renovation and customization. Convenient access to local amenities, schools, and everyday essentials. Whether you're searching for your next project or an affordable opportunity to create something of your own, this property is full of possibilities. Offers will be entertained after property has been exposed on the MLS for 7 calendar days. All contracts and offers are subject to
Key facts
- 6,970 sq ft lot
- 3 garage spots
- Built 1981
Property features AI
Exterior
- Parking: 3-car garage
- Home design: Single-story residential property; Corner lot
- Construction: Block construction; Metal roof
- Exterior features: Chain link fencing; Metal roof; Shed(s) on property
Interior
- Flooring: Vinyl
- Bathrooms: 1 full bathroom
- Heating & cooling: Central electric heating; Central air conditioning; Ceiling fan(s)
- Interior features: Vinyl flooring; Ceiling fan(s); Central air conditioning; Central electric heating
Neighborhood map
What this means for you Summary
Snapshot
- This is a 3-bed/1.0-bath single-family listed at $69k.
Deal economics
- At list price, monthly cash flow is $334 ($4k/yr) — positive.
- The deal already cash-flows at list — no discount required.
- Meets the 1% rule at list price ($1k rent vs $69k).
- Recommended offer: $67k (3.0% below list) — sets the bar for market timing.
- Cap rate 12.1% vs local median 2.0% in Mayo — top-decile yield for the area; either an underpriced asset or a hidden risk that comps aren't pricing in. Stress-test before assuming the spread holds.
Location & tenants
- Location reads 63/100 on livability (#740 in FL) — a middle-class / working-renter tenant base. Strengths: cost of living A+, health & safety A+, crime A; Watch: amenities F, commute F, employment F.
- Lafayette (rural): math 73% / reading 57% proficiency, ranked #6 of 73 in FL (top 8%) — acceptable for families but not a draw, mixed tenant base, ~2y average lease.
- Market conditions: 78 active listings in the ZIP; 42 units permitted in Lafayette County in 2024 (0 in 5+ unit buildings).
Forward outlook
- In year one you build about $5k of equity ($475 loan paydown + $5k appreciation (6.9% local appreciation)).
- At projected returns (6.9% appreciation + 3.0% rent growth), your $19k cash investment doubles in ~3 years — after that, you're playing with house money.
- By year 7, paydown + projected appreciation supports a ~$35k cash-out refi (75% LTV) — recoverable capital for the next deal without selling this one.
Negotiation context
- It's been on market 58 days — a 3% lower offer ($67k) is reasonable based on typical stale-listing flexibility.
- 2 sale attempts since 2y ago; this cycle's ask has dropped $16k (19%) from the opening price — seller is motivated, your offer sets the floor, not the list.
Risks & watch-outs
- Watch-outs: property tax is 2.8% of price.
- Climate carrying-cost: severe wind risk, 99% chance of damaging wind over 30y; severe wildfire risk; extreme-heat days projected 7→20/yr by 2055 (HVAC capex compounding) — expect insurance premiums to compound above CPI over the hold.
Questions for the listing agent
- It's been on market 58 days. Have you received any prior offers? Is the seller open to a 3% concession, seller financing, or rate buy-down credit?
- Property tax is high relative to price — has the assessment been appealed recently, and will the sale trigger a re-assessment?
- Is there a deadline driving the sale (1031 exchange, divorce, estate, relocation)? That informs how much negotiation room exists.
- What's the average days-on-market for RENTAL listings here right now (not sales)? A rising rental-DOM trend means longer vacancies and softer asking-rent achievability than the comps imply.
- What's the recent tenant-quality profile in this submarket — average credit score on applications, eviction rate, late-payment / NSF rate, and stable-employment percentage? A property-management company in the area should have these aggregated.
- How much new for-sale + rental construction is in the pipeline within 1–3 miles? Heavy new supply typically softens prices + rents 12–24 months out; constrained supply supports both.
Investment metrics
- 1% rule
- 1.63% ✓
- Cap rate
- 12.13%
- Cash-on-cash
- 20.83%
- DSCR
- 1.93
- GRM
- 5.1
CMA / ARV
- ARV (on-the-fly)
- $138,600
- Comps found
- 1
Show comp detail 1 sale within ~0.75 mi
| Address | Dist | Beds/Ba | Sqft | Sold | Price | $/sf | Match |
|---|---|---|---|---|---|---|---|
| 324 SW Monroe Ave | 0.34mi | 2/1.0 (-1) | 1,148 (+9%) | 13mo | $151,000 | $132 | 53 |
Match score weights: distance 35% · size 25% · config 20% · recency 20%. Top-matched comps best support the ARV.
Projected returns pro-forma
6.89% appreciation · 3.0% rent growth · sell at horizon
- IRR
- 34.5%
- Equity multiple
- 3.33×
- Total profit
- $44,843
- Equity at exit
- $47,097
- IRR
- 31.4%
- Equity multiple
- 6.96×
- Total profit
- $114,604
- Equity at exit
- $89,005
Cash invested: $19,236 (down + closing). Projections, not guarantees.
Landlord ↔ Tenant lean methodology
- Overall (STATE)
- 87 Strongly Landlord-Friendly
- State Florida
- 87 Strongly Landlord-Friendly · R+3
- County
- — inherits STATE
- City
- — inherits STATE
ZIP-level market 32066
- Home prices YoY
- 2.3%
- Active inventory
- 78
- Price-to-rent
- 5.1×
Monthly cashflow live
- Estimated rent
- $1,116 medium interval (Pro) →
- Mortgage (P&I)
- −$360
- Tax from tax record
- −$159 /mo · $1,909/yr
- Insurance
- −$29
- HOA
- −$0
- Vacancy / Maint / Mgmt
- −$234
- Net cashflow
- $334
Break-even live
UW: 25.0% down · 7.5% · 30yr · 1.5% tax · 5.0% vac · 8.0% maint · 8.0% mgmt
Financing live
Cash to close
- Down payment
- $17,175
- Closing costs
- $2,061
- Reserves months
- —
- Total cash needed
- —
Loan-product check · same deal, 3 products live
Conventional
25% down · 7.5% · 30yr
- Down + closing
- —
- Monthly P&I
- —
- Monthly cashflow
- —
- DSCR
- —
- Eligible?
- —
Personal DTI + credit; lowest rate.
DSCR
20% down · 8.5% · 30yr
- Down + closing
- —
- Monthly P&I
- —
- Monthly cashflow
- —
- DSCR
- —
- Eligible?
- —
No personal income docs; deal must DSCR.
Hard money
10% down · 12.0% · 12mo
- Down + closing
- —
- Monthly P&I
- —
- Monthly cashflow
- —
- DSCR
- —
- Eligible?
- —
Short-term bridge; refi at stabilization.
Listing history 21 events
-
2026-06-18days on market $68,700 Active 58 DOM
-
2026-06-17days on market $68,700 Active 57 DOM
-
2026-06-16days on market $68,700 Active 56 DOM
-
2026-06-15days on market $68,700 Active 55 DOM
-
2026-06-13days on market $68,700 Active 53 DOM
-
2026-06-12days on market $68,700 Active 52 DOM
-
2026-06-09days on market $68,700 Active 49 DOM
-
2026-06-08days on market $68,700 Active 48 DOM
-
2026-06-07days on market $68,700 Active 47 DOM
-
2026-06-07pricedays on market $68,700 Active 46 DOM
-
2026-06-04days on market $80,750 Active 43 DOM
-
2026-06-02days on market $80,750 Active 42 DOM
-
2026-06-01days on market $80,750 Active 41 DOM
-
2026-05-31days on market $80,750 Active 40 DOM
-
2026-05-31days on market $80,750 Active 39 DOM
-
2026-05-20price $80,750
-
2026-04-22$85,000 Active
-
2025-01-14historical
-
2024-12-26price $66,500
-
2024-11-18price $90,250
-
2024-11-18$95,000 Active
ⓘ Source: listings_history table (triggers on properties + properties_extension) + one-shot
backfill from property_details.listing_events for pre-trigger history.
Tax reassessment forecast FL · Resets to sale price
- Current annual tax
- $1,909 · $159/mo
- Projected year-2 tax
- $1,909 · $159/mo
- Expected delta
- $0/yr ($0/mo · 0.0%)
ⓘ Screening estimate from a state-policy table — verify with the county assessor before closing.
Climate risk First Street
- Flood 1/10 Low FEMA zone X (unshaded) · 0% chance over 30 yrs
- Wildfire 8/10 Severe
- Heat 8/10 Severe 7 d/yr ≥108°F today · 20 d/yr by 30 yrs out
- Wind 9/10 Extreme 99% chance of damaging wind over 30 yrs
- Air quality 4/10 Moderate 4 unhealthy d/yr today · 7 by 30 yrs out
Nearby sold comps map
Loading sold comps map…
Walkable amenities ~0.75 mi
Loading nearby amenities…
Taxation est. · year 1
- Rental income
- $13,397
- − Mortgage interest
- −$3,848
- − Property taxes
- −$1,909
- − Insurance
- −$344
- − Repairs & maintenance
- −$1,072
- − Management
- −$1,072
- − Depreciation
- −$1,999
- Taxable income
- $3,154
- Est. tax owed @ 24.0%
- −$757
- After-tax cash flow
- $3,251/yr
For passive investors: Depreciation is non-cash, so a rental often shows a tax loss while cash-flowing — sheltering income. Rental losses are passive: they offset passive income freely, and up to $25,000/yr can offset ordinary (W-2) income if you actively participate and your MAGI is under $100k (phasing out to $0 by $150k); unused losses carry forward. On sale, claimed depreciation is recaptured at up to 25%, and gains may owe capital-gains tax (a 1031 exchange can defer both). Figures are a year-1 estimate at your 24.0% rate — not tax advice; consult a CPA.
Schools (NCES district)
- District
- Lafayette
- NCES district ID
- 1201020
- Math proficiency
- 73% ▲ 2.00%
- Reading proficiency
- 57% ▼ -1.00%
- Median HH income
- $42,317
- Composite
- 54.57/100
- National rank
- #1341
- State rank
- #6 of 73 in FL
Livability — Mayo
- Score
- 63/100
- State rank
- #740
- US rank
- #15981
Category grades
Schools grade is shown separately in the Schools card above.
Census & demographics
- Census place
- Mayo, FL
- Population (ZIP)
- 6,881
Population outlook (Lafayette County) Hauer SSP2
- Today (2025)
- 8,368 people
- By 2030
- 8,360 · -0.1%
- By 2040
- 8,367 · +-0.0%
- By 2050
- 8,285 · -1.0%
- By 2075
- 7,623 · -8.9%
- By 2100
- 6,186 · -26.1%
Race, ethnicity, and origin ACS 2023
- Neighborhood character
- Predominantly White (69%)
- Race & ethnicity
- White 69% Black 20% Hispanic / Latino 10% Two or more races 4%
- Hispanic origin (detail)
- Mexican 6% Cuban 2%
- Common ancestry
- Iranian 1% Slovak 1% Hispanic 1%
- Foreign-born
- 5% · Canada, Jamaica
- Languages at home
- 92% English-only · Spanish 8%
Political lean MEDSL · Lafayette
- 2024 margin
- Solid R (+76.0) · D 11.7% · R 87.8%
- 2008→2024 swing
- -15.4pp toward R · 2008: -60.6pp · 2024: -76.0pp
- All cycles
- 2024: R+76.0 2020: R+71.6 2016: R+67.5 2012: R+58.3 2008: R+60.6
Not yet ingested
- Civics
- —
Market trends
- HPI YoY
- ▲ 6.89%
- Current HPI
- 309.4384
- Rent YoY
- —
- Metro
- —
- State GDP YoY
- ▲ 3.28%
- F500 in state
- 36
Industry mix (Fortune 500 HQ in FL)
| Industry | F500 HQs | Revenue |
|---|---|---|
| Industrial Technology | 2 | $29B |
|
||
| Insurance | 2 | $17B |
|
||
| Retail | 1 | $60B |
|
||
| Technology Distribution | 1 | $58B |
|
||
| Homebuilding | 1 | $35B |
|
||
| Technology Manufacturing | 1 | $35B |
|
||
Price history
-15.0% since first listed6 events — show timeline
- 2026-05-20 Price Changed $80,750 NFMLS
- 2026-04-22 Listed $85,000 NFMLS
- 2025-01-14 Listing Removed — CATRS
- 2024-12-26 Price Changed $66,500 CATRS
- 2024-11-18 Price Changed $90,250 CATRS
- 2024-11-18 Listed $95,000 CATRS
Property tax history
+19.1%/yrLatest (2025): $1,909 · +6.5% YoY. Source: county tax records.
Cash-flow waterfall
monthlySold comps — $/sqft
last 12 mo · ≤1 miLoading sold comps…