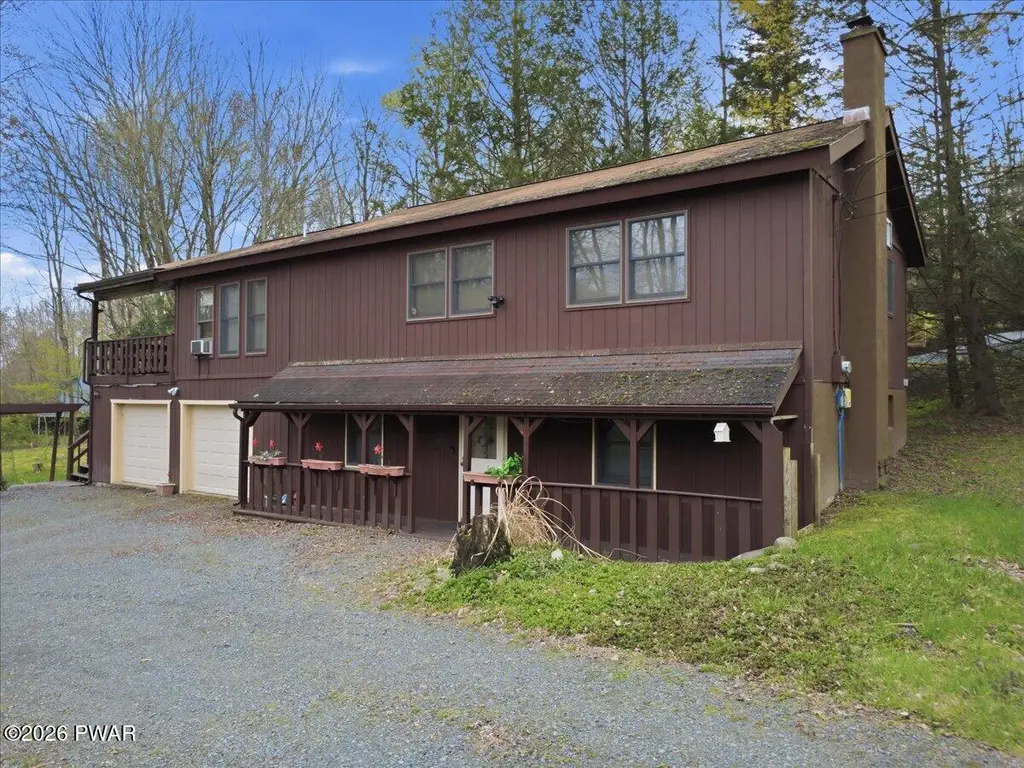
2374 Crest View Rd · Lake, PA
Flood risk No data
- FEMA flood zone
- —
- Chance of flooding over 30 yrs
- —
- Est. flood insurance / yr
- —
Fire risk No data
- Est. fire insurance / yr
- —
Heat risk No data
- Hot days now (above threshold)
- —
- Hot days in 30 yrs
- —
Wind risk No data
- Chance of severe wind over 30 yrs
- —
Air-quality risk No data
- Unhealthy air days now
- —
- Unhealthy air days in 30 yrs
- —
Risk factors via First Street. Map © Google.
Why this score? — see what drove the D+ grade
The composite is a weighted blend of 9 inputs, each scored 0–100. Each bar is that input's sub-score; the figure is the points it added to the 100-point composite (weight × sub-score).
- ARV discount +15.0/15.0
- Appreciation +10.0/10.0
- Cash flow +7.4/30.0
- Schools +4.4/10.0
- 1% rule +3.0/10.0
- Rent growth +2.5/5.0
- Livability +2.5/5.0
- Condition / age +2.5/5.0
- DSCR +1.6/10.0
$295,900
🖨 Deal sheet 📄 Offer letter ✓ Due diligence
Listing remarks
Welcome to this charming 3 bedroom, 2 bathroom home located in The Hideout, just a short walk from beautiful Brooks Lake. Perfectly positioned to enjoy peaceful lake views and the surrounding natural beauty, this home offers the ideal blend of privacy, space, and community amenities. Inside, you'll find warm wood paneling, vaulted ceilings, and an abundance of natural light pouring through large windows, creating a bright and inviting atmosphere throughout the main living areas. The spacious living room flows into the kitchen and dining area, making it a great space for entertaining or relaxing after a day at the lake. A bright four-season room adds even more living space and is perfect for
Key facts
- Four-season room
- Mother-in-law suite
- Lake views
Tags
Property features AI
Finance
- Other: Property located on a privately maintained paved road; Lot is cleared, mostly level with few trees, approximately 0.32 acre; Directions available for gated community entry (The Hideout)
- HOA & community: Homeowners association with annual and one-time fees (annual fee listed); Community amenities include gated entry, clubhouse, tennis courts, pool, playground, park, lake access, golf, fitness center, fishing, trails, marina, picnic areas, and more
Exterior
- Parking: Has garage; Direct access; Driveway; Circular driveway; Additional garage structures
- Security: 24-hour security; Security gate; Security guard; Gated community with guard
- Utilities: Public water; Public sewer
- Home design: Single-family residence; Two levels; Residential property; Has view of Brooks Lake
- Construction: Wood siding; Shingle/composition roof; Built with foundation and full basement (partially finished)
- Exterior features: Balcony; Rain gutters; Exterior lighting; Courtyard; Covered deck/patio
Interior
- Kitchen: Dishwasher; Microwave; Electric range; Refrigerator
- Flooring: Carpet; Vinyl; Wood
- Bathrooms: 2 full bathrooms
- Heating & cooling: Baseboard heat; Propane and electric heating sources; Ceiling fans for cooling
- Interior features: Cathedral ceilings; Natural woodwork; Kitchen island; High ceilings; Eat-in kitchen; Ceiling fans
- Laundry & utility: Washer; Dryer; Laundry closet on lower level; Partially finished walk-out/walk-up basement
Neighborhood map
What this means for you Summary
Snapshot
- This is a 3-bed/2.0-bath single-family listed at $296k.
Deal economics
- At list price, monthly cash flow is $-375 ($-5k/yr) — negative.
- To cash-flow at today's rent, offer at most $242k (18.4% below list).
- To meet the 1% rule (rent ≥ 1% of price), the offer needs to be $236k (20.3% below list).
- Recommended offer: $236k (20.3% below list) — sets the bar for 1% rule.
Location & tenants
- Location reads: area grade D — affects rentability + tenant quality, not the cash-flow math above.
- Western Wayne SD (rural): math 39% / reading 63% proficiency, ranked #165 of 539 in PA (top 31%) — acceptable for families but not a draw, mixed tenant base, ~2y average lease.
- Market conditions: 337 active listings in the ZIP; 177 units permitted in Wayne County in 2024 (0 in 5+ unit buildings).
Forward outlook
- In year one you build about $32k of equity ($2k loan paydown + $30k appreciation (10.0% local appreciation)).
- Wayne County population projected at -17% by 2050 — secular population decline; favor cash flow + early exit over multi-decade hold.
- By year 2, paydown + projected appreciation supports a ~$51k cash-out refi (75% LTV) — recoverable capital for the next deal without selling this one.
Negotiation context
- It's been on market 55 days — a 3% lower offer ($287k) is reasonable based on typical stale-listing flexibility.
Questions for the listing agent
- What do current leases actually rent for vs. the listed asking? Can we see a recent rent roll and the last 12 months of T-12 income?
- It's been on market 55 days. Have you received any prior offers? Is the seller open to a 20% concession, seller financing, or rate buy-down credit?
- What does the HOA fee cover, when was the last increase, and are there any pending special assessments or reserve-fund shortfalls?
- Is there a deadline driving the sale (1031 exchange, divorce, estate, relocation)? That informs how much negotiation room exists.
- The area grade is low — what's the realistic commute time and amenity access for the typical tenant pool here? Any planned neighborhood developments (good or bad) we should know about?
- What's the average days-on-market for RENTAL listings here right now (not sales)? A rising rental-DOM trend means longer vacancies and softer asking-rent achievability than the comps imply.
- What's the recent tenant-quality profile in this submarket — average credit score on applications, eviction rate, late-payment / NSF rate, and stable-employment percentage? A property-management company in the area should have these aggregated.
- How much new for-sale + rental construction is in the pipeline within 1–3 miles? Heavy new supply typically softens prices + rents 12–24 months out; constrained supply supports both.
Investment metrics
- 1% rule
- 0.80% ✗
- Cap rate
- 4.77%
- Cash-on-cash
- -5.44%
- DSCR
- 0.76
- GRM
- 10.5
CMA / ARV
- ARV (median comp)
- $361,056
- List price
- $295,900
- Delta
- -18.05%
- Verdict
- UNDERPRICED
- Comps
- 20 within 1.0 mi
Show comp detail 12 sales within ~0.75 mi
| Address | Dist | Beds/Ba | Sqft | Sold | Price | $/sf | Match |
|---|---|---|---|---|---|---|---|
| 41 Crest View Rd | 0.04mi | 3/3.0 | 2,108 (+1%) | 13mo | $315,000 | $149 | 82 |
| 29 Tanglewood Ln | 0.14mi | 3/3.0 | 1,987 (-5%) | 1mo | $540,000 | $272 | 81 |
| 171 Ridgeview Dr | 0.26mi | 4/2.5 (+1) | 2,314 (+11%) | 4mo | $370,000 | $160 | 60 |
| 69 Woodview Ter | 0.42mi | 3/2.5 | 1,841 (-12%) | 4mo | $260,000 | $141 | 55 |
| 1618 Ridgeview Dr | 0.43mi | 3/2.0 | 2,318 (+11%) | 10mo | $240,000 | $104 | 53 |
| 411 Lakeview Dr W | 0.71mi | 3/3.0 | 2,059 (-1%) | 10mo | $299,000 | $145 | 53 |
| 77 Brookfield Rd | 0.59mi | 3/3.0 | 1,957 (-6%) | 10mo | $240,000 | $123 | 50 |
| 106 Ridgeview Dr | 0.43mi | 3/2.0 | 2,318 (+11%) | 15mo | $238,000 | $103 | 49 |
| 50 Woodhill Ln | 0.69mi | 4/3.0 (+1) | 2,184 (+5%) | 10mo | $355,000 | $163 | 43 |
| 8 Brentwood Ct Lot 1019 | 0.74mi | 3/2.5 | 2,261 (+8%) | 8mo | $352,000 | $156 | 43 |
| 49 Brookfield Rd | 0.71mi | 4/3.0 (+1) | 1,850 (-11%) | 6mo | $390,000 | $211 | 34 |
| 49 Woodhill Ln | 0.67mi | 4/2.0 (+1) | 2,345 (+12%) | 13mo | $365,000 | $156 | 32 |
Match score weights: distance 35% · size 25% · config 20% · recency 20%. Top-matched comps best support the ARV.
Projected returns pro-forma
10.0% appreciation · 3.0% rent growth · sell at horizon
- IRR
- 20.4%
- Equity multiple
- 2.66×
- Total profit
- $137,396
- Equity at exit
- $266,570
- IRR
- 18.6%
- Equity multiple
- 6.11×
- Total profit
- $423,723
- Equity at exit
- $574,869
Cash invested: $82,852 (down + closing). Projections, not guarantees.
Landlord ↔ Tenant lean methodology
- Overall (STATE)
- 62 Landlord-Friendly
- State Pennsylvania
- 62 Landlord-Friendly · EVEN
- County
- — inherits STATE
- City
- — inherits STATE
ZIP-level market 18436
- Home prices YoY
- 16.9%
- Active inventory
- 337
- Price-to-rent
- 10.5×
Monthly cashflow live
- Estimated rent
- $2,359 medium interval (Pro) →
- Mortgage (P&I)
- −$1,552
- Tax est. 1.5%
- −$370 /mo · $4,438/yr
- Insurance
- −$123
- HOA
- −$194
- Vacancy / Maint / Mgmt
- −$495
- Net cashflow
- $-375
Break-even live
UW: 25.0% down · 7.5% · 30yr · 1.5% tax · 5.0% vac · 8.0% maint · 8.0% mgmt
Financing live
Cash to close
- Down payment
- $73,975
- Closing costs
- $8,877
- Reserves months
- —
- Total cash needed
- —
Loan-product check · same deal, 3 products live
Conventional
25% down · 7.5% · 30yr
- Down + closing
- —
- Monthly P&I
- —
- Monthly cashflow
- —
- DSCR
- —
- Eligible?
- —
Personal DTI + credit; lowest rate.
DSCR
20% down · 8.5% · 30yr
- Down + closing
- —
- Monthly P&I
- —
- Monthly cashflow
- —
- DSCR
- —
- Eligible?
- —
No personal income docs; deal must DSCR.
Hard money
10% down · 12.0% · 12mo
- Down + closing
- —
- Monthly P&I
- —
- Monthly cashflow
- —
- DSCR
- —
- Eligible?
- —
Short-term bridge; refi at stabilization.
HOA detail
- Monthly dues
- $194 · $2,328/yr
Listing history 17 events
-
2026-06-18days on market $295,900 Active 55 DOM
-
2026-06-17days on market $295,900 Active 54 DOM
-
2026-06-16days on market $295,900 Active 53 DOM
-
2026-06-15days on market $295,900 Active 52 DOM
-
2026-06-14days on market $295,900 Active 50 DOM
-
2026-06-13days on market $295,900 Active 49 DOM
-
2026-06-10days on market $295,900 Active 47 DOM
-
2026-06-09days on market $295,900 Active 46 DOM
-
2026-06-08days on market $295,900 Active 45 DOM
-
2026-06-07days on market $295,900 Active 44 DOM
-
2026-06-03days on market $295,900 Active 40 DOM
-
2026-06-02days on market $295,900 Active 39 DOM
-
2026-06-01days on market $295,900 Active 38 DOM
-
2026-05-31days on market $295,900 Active 37 DOM
-
2026-05-30days on market $295,900 Active 36 DOM
-
2026-05-16price $295,900 1864-char remark
-
2026-04-24$309,900 Active 1864-char remark
ⓘ Source: listings_history table (triggers on properties + properties_extension) + one-shot
backfill from property_details.listing_events for pre-trigger history.
Nearby sold comps map
Loading sold comps map…
Walkable amenities ~0.75 mi
Loading nearby amenities…
Taxation est. · year 1
- Rental income
- $28,305
- − Mortgage interest
- −$16,575
- − Property taxes
- −$4,438
- − Insurance
- −$1,480
- − Repairs & maintenance
- −$2,264
- − Management
- −$2,264
- − HOA
- −$2,328
- − Depreciation
- −$8,608
- Taxable loss
- −$9,652
- Est. tax savings @ 24.0%
- +$2,317
- After-tax cash flow
- $-2,189/yr
For passive investors: Depreciation is non-cash, so a rental often shows a tax loss while cash-flowing — sheltering income. Rental losses are passive: they offset passive income freely, and up to $25,000/yr can offset ordinary (W-2) income if you actively participate and your MAGI is under $100k (phasing out to $0 by $150k); unused losses carry forward. On sale, claimed depreciation is recaptured at up to 25%, and gains may owe capital-gains tax (a 1031 exchange can defer both). Figures are a year-1 estimate at your 24.0% rate — not tax advice; consult a CPA.
Schools (NCES district)
- District
- Western Wayne SD
- NCES district ID
- 4226070
- Math proficiency
- 39% ▼ -12.00%
- Reading proficiency
- 63% ▼ -6.00%
- Median HH income
- $51,358
- Composite
- 43.65/100
- National rank
- #2964
- State rank
- #165 of 539 in PA
Livability — Lake
No livability data for this city. (Only ~50 U.S. cities are tracked.)
Census & demographics
- Census place
- The Hideout, PA
- Population (ZIP)
- 13,225
Population outlook (Wayne County) Hauer SSP2
- Today (2025)
- 47,924 people
- By 2030
- 46,191 · -3.6%
- By 2040
- 42,815 · -10.7%
- By 2050
- 39,873 · -16.8%
- By 2075
- 34,556 · -27.9%
- By 2100
- 28,358 · -40.8%
Race, ethnicity, and origin ACS 2023
- Neighborhood character
- Predominantly White (95%)
- Race & ethnicity
- White 95% Two or more races 3% Hispanic / Latino 2%
- Common ancestry
- Romanian 9% Scotch-Irish 2% Iranian 2%
- Foreign-born
- 4%
- Languages at home
- 95% English-only · French/Haitian/Cajun 2% Russian/Polish/Slavic 1% Spanish 1%
Political lean MEDSL · Wayne
- 2024 margin
- Solid R (+37.1) · D 31.1% · R 68.2%
- 2008→2024 swing
- -24.8pp toward R · 2008: -12.3pp · 2024: -37.1pp
- All cycles
- 2024: R+37.1 2020: R+33.6 2016: R+39.7 2012: R+20.9 2008: R+12.3
Not yet ingested
- Civics
- —
Market trends
- HPI YoY
- ▲ 47.95%
- Current HPI
- 331.9645
- Rent YoY
- —
- Metro
- —
- State GDP YoY
- ▲ 1.68%
- F500 in state
- 34
Industry mix (Fortune 500 HQ in PA)
| Industry | F500 HQs | Revenue |
|---|---|---|
| Healthcare | 2 | $309B |
|
||
| Insurance | 2 | $27B |
|
||
| Telecommunications / Media | 1 | $124B |
|
||
| Industrial Distribution | 1 | $22B |
|
||
| Financial Services | 1 | $20B |
|
||
| Chemicals / Materials | 1 | $18B |
|
||
Price history
-4.5% since first listed2 events — show timeline
- 2026-05-16 Price Changed $295,900 PWMLS
- 2026-04-24 Listed $309,900 PWMLS
Cash-flow waterfall
monthlySold comps — $/sqft
last 12 mo · ≤1 miLoading sold comps…