6300 E 2nd Ave #72 · Spokane Valley, WA
Flood risk 1/10 · Minimal
- FEMA flood zone
- X (unshaded)
- Chance of flooding over 30 yrs
- 0.0%
- Est. flood insurance / yr
- $507 – $1,088
Fire risk 6/10 · Moderate
- Est. fire insurance / yr
- $604 – $1,122
Heat risk 3/10 · Minor
- Hot days now (above 93°F)
- 7 days/yr
- Hot days in 30 yrs
- 15 days/yr
Wind risk 1/10 · Minimal
- Chance of severe wind over 30 yrs
- —
Air-quality risk 9/10 · Severe
- Unhealthy air days now
- 17 days/yr
- Unhealthy air days in 30 yrs
- 17 days/yr
Risk factors via First Street. Map © Google.
Why this score? — see what drove the C+ grade
The composite is a weighted blend of 9 inputs, each scored 0–100. Each bar is that input's sub-score; the figure is the points it added to the 100-point composite (weight × sub-score).
- Cash flow +30.0/30.0
- 1% rule +10.0/10.0
- DSCR +10.0/10.0
- Schools +4.6/10.0
- Livability +4.2/5.0
- Rent growth +3.4/5.0
- Condition / age +2.5/5.0
- ARV discount +0.0/15.0
- Appreciation +0.0/10.0
$50,000
🖨 Deal sheet 📄 Offer letter ✓ Due diligence
Listing remarks
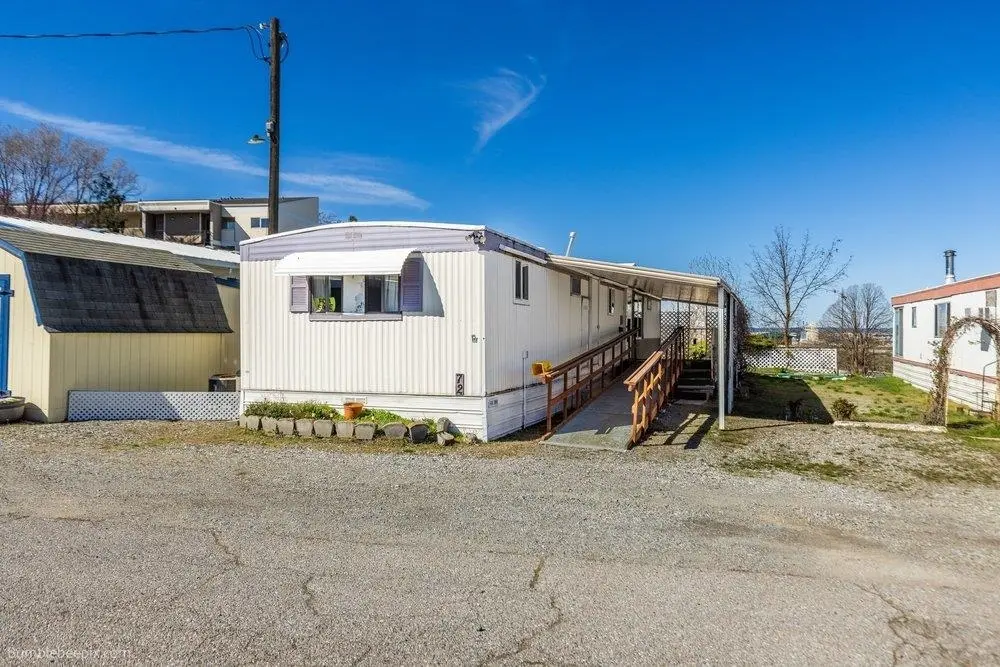
Single-wide home offering 2 bedrooms, 2 bathrooms, and 840 square feet of functional living space. The layout features an open living area with vaulted ceilings, along with a kitchen that provides ample cabinet storage and connects to a dedicated dining nook. The floor plan includes two primary suites, each with built-in storage, generous closet space, and a private en-suite bathroom with walk-in shower. Outside, the property includes a covered ramp for accessibility, a covered patio, and a garden bed area. Located in Valley Breeze Park, a 55+ community, offering an opportunity for affordable homeownership.
Key facts
- Open living area
- Vaulted ceilings
- Built-in storage
Tags
Property features AI
Finance
- Other: Living area 840 (from public records)
- Financial info: Land lease amount: $575 per month
- HOA & community: Located in a senior community (Valley Breeze); Monthly land lease
Exterior
- Parking: Carport
- Home design: Manufactured home; Single-story (manufactured house); Lamplighter make
- Construction: Steel frame construction; Metal roof; Built with manufactured house structure
- Exterior features: Level, open lot with garden; Paved road and city street frontage
Interior
- Kitchen: Range; Refrigerator
- Bedrooms: 2 bedrooms
- Heating & cooling: Natural gas forced air heating
- Interior features: Utility room; Crawl space basement; Skirted foundation; Ramp to main level (accessibility feature)
- Laundry & utility: Washer; Dryer
Neighborhood map
What this means for you Summary
Snapshot
- This is a 2-bed/1.0-bath manufactured listed at $50k.
Deal economics
- At list price, monthly cash flow is $797 ($10k/yr) — positive.
- The deal already cash-flows at list — no discount required.
- Meets the 1% rule at list price ($1k rent vs $50k).
- Recommended offer: $49k (1.5% below list) — sets the bar for market timing.
- Cap rate 25.4% vs local median 3.0% in Spokane Valley — top-decile yield for the area; either an underpriced asset or a hidden risk that comps aren't pricing in. Stress-test before assuming the spread holds.
Location & tenants
- Location reads 85/100 on livability (#31 in WA, #512 nationally) — a professional / high-income tenant draw. Strengths: amenities A+, commute A+, housing A+; Watch: crime D+.
- Spokane School District (urban): math 47% / reading 58% proficiency, ranked #136 of 291 in WA (top 47%) — acceptable for families but not a draw, mixed tenant base, ~2y average lease.
- Zoned schools: Ferris High School (1,631 students, 48% FRL) — zoned schools at 48% FRL track the district average.
- Market conditions: Rents rising (+3.5%/yr); 187 active listings in the ZIP; 10 comparable units currently listed for rent nearby; rentals at typical pace (median 24d on market — plan ~3-4 weeks tenant-placement turnaround); 3,608 units permitted in Spokane County in 2024 (1,792 in 5+ unit buildings).
Forward outlook
- Local home prices are declining (-3.0%/yr); year-one equity from $346 of loan paydown is wiped out by about $2k of value loss. Plan a longer hold.
- Spokane County population projected at +13% by 2050 — modest demand growth; plan on rents tracking national, not racing it.
- At projected returns (-3.0% appreciation + 3.5% rent growth), your $14k cash investment doubles in ~2 years — after that, you're playing with house money.
Negotiation context
- It's been on market 27 days — a 2% lower offer ($49k) is reasonable based on typical stale-listing flexibility.
- 2 sale attempts with the ask held roughly flat each time — persistent listings suggest the price (not the market) is what's stuck; bring a comps-based counter.
Risks & watch-outs
- Climate carrying-cost: major wildfire risk — expect insurance premiums to compound above CPI over the hold.
Questions for the listing agent
- Built in 1973 — when were the roof, HVAC, electrical panel, plumbing, and water heater last replaced?
- Is there a deadline driving the sale (1031 exchange, divorce, estate, relocation)? That informs how much negotiation room exists.
- Schools are B-rated — typically a magnet for longer-tenancy family renters. What's the average tenant stay here, and is there a school-zone premium baked into asking?
- Crime grade is D in this area — have there been break-ins, vandalism, or insurance claims at this property in the last 3 years? What carrier currently insures it and at what premium?
- What's the average days-on-market for RENTAL listings here right now (not sales)? A rising rental-DOM trend means longer vacancies and softer asking-rent achievability than the comps imply.
- What's the recent tenant-quality profile in this submarket — average credit score on applications, eviction rate, late-payment / NSF rate, and stable-employment percentage? A property-management company in the area should have these aggregated.
- How much new for-sale + rental construction is in the pipeline within 1–3 miles? Heavy new supply typically softens prices + rents 12–24 months out; constrained supply supports both.
Investment metrics
- 1% rule
- 2.76% ✓
- Cap rate
- 25.42%
- Cash-on-cash
- 68.30%
- DSCR
- 4.04
- GRM
- 3.0
CMA / ARV
- ARV (on-the-fly)
- $42,840
- Comps found
- 7
Show comp detail 7 sales within ~0.75 mi
| Address | Dist | Beds/Ba | Sqft | Sold | Price | $/sf | Match |
|---|---|---|---|---|---|---|---|
| 6300 E 2nd Ave #101 | 0.00mi | 2/1.0 | 720 (-14%) | 1mo | $63,000 | $88 | 75 |
| 5820 E 4th Ave #10 | 0.36mi | 2/1.0 | 784 (-7%) | 3mo | $39,950 | $51 | 70 |
| 6300 E 2nd Ave #126 | 0.00mi | 3/1.0 (+1) | 924 (+10%) | 12mo | $40,000 | $43 | 68 |
| 5820 E 4th Ave #31 | 0.38mi | 3/1.0 (+1) | 784 (-7%) | 1mo | $39,500 | $50 | 65 |
| 6300 E 2nd Ave #98 | 0.00mi | 3/2.0 (+1) | 924 (+10%) | 13mo | $55,000 | $60 | 64 |
| 6300 E 2nd Ave Trlr 129 | 0.00mi | 2/1.0 | 952 (+13%) | 21mo | $25,450 | $27 | 60 |
| 6821 E 7th Ave | 0.44mi | 2/2.0 | 900 (+7%) | 10mo | $120,000 | $133 | 56 |
Match score weights: distance 35% · size 25% · config 20% · recency 20%. Top-matched comps best support the ARV.
Projected returns pro-forma
-3.0% appreciation · 3.49% rent growth · sell at horizon
- IRR
- 68.2%
- Equity multiple
- 4.09×
- Total profit
- $43,319
- Equity at exit
- $7,455
- IRR
- 72.5%
- Equity multiple
- 8.56×
- Total profit
- $105,860
- Equity at exit
- $4,323
Cash invested: $14,000 (down + closing). Projections, not guarantees.
Landlord ↔ Tenant lean methodology
- Overall (STATE)
- 28 Tenant-Leaning
- State Washington
- 28 Tenant-Leaning · D+8
- County
- — inherits STATE
- City
- — inherits STATE
ZIP-level market 99212
- Rents YoY
- 3.5%
- Active inventory
- 187
- Price-to-rent
- 3.0×
Monthly cashflow live
- Estimated rent
- $1,381 high interval (Pro) →
- Mortgage (P&I)
- −$262
- Tax from tax record
- −$12 /mo · $138/yr
- Insurance
- −$21
- HOA
- −$0
- Vacancy / Maint / Mgmt
- −$290
- Net cashflow
- $797
Break-even live
UW: 25.0% down · 7.5% · 30yr · 1.5% tax · 5.0% vac · 8.0% maint · 8.0% mgmt
Financing live
Cash to close
- Down payment
- $12,500
- Closing costs
- $1,500
- Reserves months
- —
- Total cash needed
- —
Loan-product check · same deal, 3 products live
Conventional
25% down · 7.5% · 30yr
- Down + closing
- —
- Monthly P&I
- —
- Monthly cashflow
- —
- DSCR
- —
- Eligible?
- —
Personal DTI + credit; lowest rate.
DSCR
20% down · 8.5% · 30yr
- Down + closing
- —
- Monthly P&I
- —
- Monthly cashflow
- —
- DSCR
- —
- Eligible?
- —
No personal income docs; deal must DSCR.
Hard money
10% down · 12.0% · 12mo
- Down + closing
- —
- Monthly P&I
- —
- Monthly cashflow
- —
- DSCR
- —
- Eligible?
- —
Short-term bridge; refi at stabilization.
Rent comps 10 comps
| Address | Beds | Baths | Sqft | Rent | $/sqft | DOM | Units | Dist |
|---|---|---|---|---|---|---|---|---|
| 402 S Eastern Rd Spokane Valley, WA | 1.0–2.0 | 1.0 | 715 | $1,095 | $1.53 | 14d | 3 | 0.15mi |
| 6121 E 6th Ave Spokane Valley, WA | 1.0 | 1.0 | 585 | $1,150 | $1.97 | 23d | 1 | 0.20mi |
| 6020 E 4th Ave Spokane Valley, WA | 1.0–2.0 | 1.0–2.0 | 735 | $1,695 | $2.30 | 14d | 5 | 0.25mi |
| 6017 E 6th Ave Unit M104 Spokane Valley, WA | 2.0 | 1.0 | 777 | $1,600 | $2.06 | 14d | 1 | 0.30mi |
| 5004 E 1st Ave Spokane Valley, WA | 2.0 | 1.0 | 900 | $1,250 | $1.39 | 14d | 1 | 0.82mi |
| 225 S Dearborn Rd Unit 4 Spokane Valley, WA | 2.0 | 1.0 | 560 | $1,150 | $2.05 | 23d | 1 | 1.12mi |
| 4405 E 5th Ave Spokane Valley, WA | 2.0 | 1.0 | 650 | $1,175 | $1.81 | 14d | 2 | 1.17mi |
| 4405 E 5th Ave Unit 36 Spokane Valley, WA | 2.0 | 1.0 | 640 | $1,150 | $1.80 | 23d | 1 | 1.20mi |
| 916 N Ella Rd Apt 55 Spokane Valley, WA | 2.0 | 1.5 | 950 | $1,450 | $1.53 | 43d | 1 | 1.22mi |
| 916 N Ella Rd Unit 16 Spokane Valley, WA | 2.0 | 1.0 | 750 | $1,200 | $1.60 | 43d | 1 | 1.22mi |
Listing history 17 events
-
2026-06-18days on market $50,000 Active 27 DOM
-
2026-06-17days on market $50,000 Active 26 DOM
-
2026-06-16days on market $50,000 Active 25 DOM
-
2026-06-15days on market $50,000 Active 24 DOM
-
2026-06-14days on market $50,000 Active 22 DOM
-
2026-06-10days on market $50,000 Active 19 DOM
-
2026-06-09days on market $50,000 Active 18 DOM
-
2026-06-08days on market $50,000 Active 17 DOM
-
2026-06-07days on market $50,000 Active 16 DOM
-
2026-06-03days on market $50,000 Active 12 DOM
-
2026-06-02days on market $50,000 Active 11 DOM
-
2026-06-01days on market $50,000 Active 10 DOM
-
2026-05-31days on market $50,000 Active 9 DOM
-
2026-05-31days on market $50,000 Active 8 DOM
-
2026-05-22historical
-
2026-05-22$50,000 Active
-
2026-04-07$50,000 Active
ⓘ Source: listings_history table (triggers on properties + properties_extension) + one-shot
backfill from property_details.listing_events for pre-trigger history.
Tax reassessment forecast WA · Resets to sale price
- Current annual tax
- $138 · $12/mo
- Projected year-2 tax
- $490 · $41/mo
- Expected delta
- +$352/yr (+$29/mo · 254.4%)
ⓘ Screening estimate from a state-policy table — verify with the county assessor before closing.
Climate risk First Street
- Flood 1/10 Low FEMA zone X (unshaded) · 0% chance over 30 yrs
- Wildfire 6/10 Major
- Heat 3/10 Moderate 7 d/yr ≥93°F today · 15 d/yr by 30 yrs out
- Wind 1/10 Low
- Air quality 9/10 Extreme 17 unhealthy d/yr today · 17 by 30 yrs out
Nearby sold comps map
Loading sold comps map…
Walkable amenities ~0.75 mi
Loading nearby amenities…
Taxation est. · year 1
- Rental income
- $16,577
- − Mortgage interest
- −$2,801
- − Property taxes
- −$138
- − Insurance
- −$250
- − Repairs & maintenance
- −$1,326
- − Management
- −$1,326
- − Depreciation
- −$1,455
- Taxable income
- $9,281
- Est. tax owed @ 24.0%
- −$2,228
- After-tax cash flow
- $7,334/yr
For passive investors: Depreciation is non-cash, so a rental often shows a tax loss while cash-flowing — sheltering income. Rental losses are passive: they offset passive income freely, and up to $25,000/yr can offset ordinary (W-2) income if you actively participate and your MAGI is under $100k (phasing out to $0 by $150k); unused losses carry forward. On sale, claimed depreciation is recaptured at up to 25%, and gains may owe capital-gains tax (a 1031 exchange can defer both). Figures are a year-1 estimate at your 24.0% rate — not tax advice; consult a CPA.
Schools (NCES district)
- District
- Spokane School District
- NCES district ID
- 5308250
- Math proficiency
- 47% ▲ 1.00%
- Reading proficiency
- 58% ▲ 1.00%
- Median HH income
- $43,187
- Composite
- 46.1/100
- National rank
- #5477
- State rank
- #136 of 291 in WA
Livability — Spokane Valley
- Score
- 85/100
- State rank
- #31
- US rank
- #512
Category grades
Schools grade is shown separately in the Schools card above.
Census & demographics
- Census place
- Spokane Valley, WA
- County
- Spokane County · 496,401 people
- City population
- 129,511
- Metro
- Spokane-Spokane Valley, WA
- Population (ZIP)
- 21,707
- Household income
- $67,049
- Rent vs Own
- Severe rent burden
- 842.0
Population outlook (Spokane County) Hauer SSP2
- Today (2025)
- 531,314 people
- By 2030
- 549,278 · +3.4%
- By 2040
- 577,822 · +8.8%
- By 2050
- 598,188 · +12.6%
- By 2075
- 630,744 · +18.7%
- By 2100
- 622,360 · +17.1%
Race, ethnicity, and origin ACS 2023
- Neighborhood character
- Predominantly White (86%)
- Race & ethnicity
- White 86% Two or more races 8% Hispanic / Latino 6%
- Hispanic origin (detail)
- Mexican 4%
- Common ancestry
- Portuguese 4% Slovak 3% Lithuanian 3%
- Foreign-born
- 4% · Canada
- Languages at home
- 95% English-only · Russian/Polish/Slavic 3% Spanish 2%
Political lean MEDSL · Spokane
- 2024 margin
- Toss-up / Even · D 46.0% · R 51.0% · Other 3.0%
- 2008→2024 swing
- -3.8pp toward R · 2008: -1.1pp · 2024: -5.0pp
- All cycles
- 2024: R+5.0 2020: R+4.3 2016: R+8.3 2012: R+6.3 2008: R+1.1
Not yet ingested
- Civics
- —
Market trends
- HPI YoY
- ▼ -316.37%
- Current HPI
- 361.41
- Rent YoY
- ▲ 3.49%
- Metro
- Spokane-Spokane Valley, WA
- State GDP YoY
- ▲ 4.65%
- F500 in state
- 22
Industry mix (Fortune 500 HQ in WA)
| Industry | F500 HQs | Revenue |
|---|---|---|
| Retail | 2 | $269B |
|
||
| Technology / Retail | 1 | $638B |
|
||
| Technology | 1 | $245B |
|
||
| Telecommunications | 1 | $38B |
|
||
| Food / Beverage | 1 | $36B |
|
||
| Automotive / Trucks | 1 | $34B |
|
||
Price history
+0.0% since first listed3 events — show timeline
- 2026-05-22 Listed $50,000 SPOKANEMLS as Distributed by MLS Grid
- 2026-05-22 Listing Removed — SPOKANEMLS as Distributed by MLS Grid
- 2026-04-07 Listed $50,000 SPOKANEMLS as Distributed by MLS Grid
Property tax history
+8.9%/yrLatest (2026): $138 · +16.7% YoY. Source: county tax records.
Cash-flow waterfall
monthlySold comps — $/sqft
last 12 mo · ≤1 miLoading sold comps…