 🏗️ New Construction
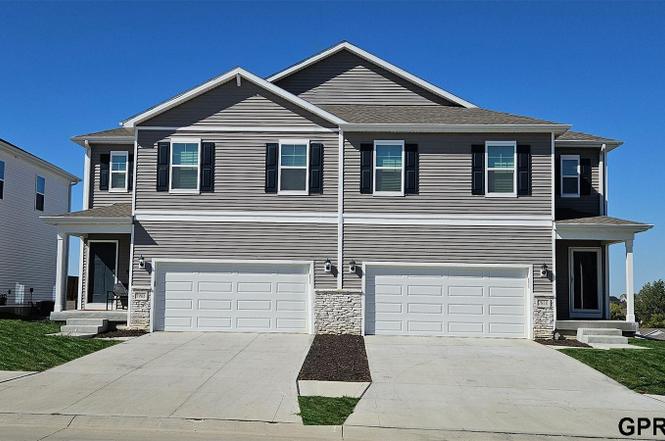
7804 N 169 St · Omaha, NE
Flood risk No data
- FEMA flood zone
- —
- Chance of flooding over 30 yrs
- —
- Est. flood insurance / yr
- —
Fire risk No data
- Est. fire insurance / yr
- —
Heat risk No data
- Hot days now (above threshold)
- —
- Hot days in 30 yrs
- —
Wind risk No data
- Chance of severe wind over 30 yrs
- —
Air-quality risk No data
- Unhealthy air days now
- —
- Unhealthy air days in 30 yrs
- —
Risk factors via First Street. Map © Google.
Why this score? — see what drove the D grade
The composite is a weighted blend of 9 inputs, each scored 0–100. Each bar is that input's sub-score; the figure is the points it added to the 100-point composite (weight × sub-score).
- Cash flow +11.1/30.0
- ARV discount +7.5/15.0
- Schools +6.1/10.0
- Livability +4.2/5.0
- Rent growth +4.0/5.0
- 1% rule +3.5/10.0
- DSCR +3.2/10.0
- Condition / age +2.5/5.0
- Appreciation +0.0/10.0
$314,990
🖨 Deal sheet (PDF) 📄 Offer letter ✓ Due diligence
Listing remarks
Welcome home to the Emerson in Majestic Pointe Twinhomes - a two-story duplex offering 1,767 sq. ft. of thoughtfully designed living space with 4 bedrooms and 2.5 baths. Perfect for a variety of lifestyles, the main level showcases an open-concept layout with a spacious living room, cozy electric fireplace, and large windows for natural light. The kitchen flows seamlessly into the dining area and includes white cabinetry, stainless steel appliances, a walk-in pantry, and a large center island. A guest bathroom, coat closet, and access to the attached 2-car garage complete the main floor. Upstairs, the private primary suite sits at the rear of the home and features a walk-in shower, dual sin
Key facts
- Walk-in closet
- Gourmet kitchen
- Electric fireplace
Tags
Property features AI
Finance
- Other: Property type: Residential townhouse; Living area 1,767 (above grade); Lot approximately 0.097 acres (about 35 x 121), up to 1/4 acre
- HOA & community: Homeowners association with an annual fee of $675
Exterior
- Parking: Attached covered garage with 2 spaces
- Utilities: Public water
- Home design: Townhouse (attached); Two levels; Model: Emerson; Under construction (new construction); Facing/entry level not specified
- Construction: Built in 2025; Concrete perimeter foundation; Builder: DR HORTON
- Exterior features: Patio; Deck; Walk-out unfinished basement
Interior
- Kitchen: Range; Dishwasher; Microwave
- Bedrooms: Master bedroom on 2nd floor; Additional bedrooms on 2nd floor
- Bathrooms: Three bathrooms total: one full, one three-quarter, one half; Main level bathroom present; Below-grade bathroom present
- Heating & cooling: Natural gas forced-air heating; Central air conditioning
- Interior features: Electric fireplace (one)
Neighborhood map
What this means for you Summary
Snapshot
- This is a 4-bed/2.5-bath other listed at $315k.
Deal economics
- At list price, monthly cash flow is $-128 ($-2k/yr) — negative.
- To cash-flow at today's rent, offer at most $296k (5.9% below list).
- To meet the 1% rule (rent ≥ 1% of price), the offer needs to be $266k (15.4% below list).
- Recommended offer: $266k (15.4% below list) — sets the bar for 1% rule.
- Cap rate 5.8% vs local median 3.6% in Omaha — top-decile yield for the area; either an underpriced asset or a hidden risk that comps aren't pricing in. Stress-test before assuming the spread holds.
Location & tenants
- Location reads 84/100 on livability (#7 in NE, #663 nationally) — a professional / high-income tenant draw. Strengths: amenities A+, commute A+, cost of living A+; Watch: crime F.
- Bennington Public Schools (rural): math 67% / reading 67% proficiency, ranked #3 of 111 in NE (top 3%) — acceptable for families but not a draw, mixed tenant base, ~2y average lease; only 6% free/reduced lunch — higher-income household profile.
- Zoned schools: Bennington Elementary School (math 77% / reading 72%, grade A, #20 of 502 statewide, top 5%, 403 students, 17% FRL); Bennington South Middle School (510 students, 9% FRL); Bennington High School (math 66% / reading 70%, grade B, #21 of 261 statewide, top 8%, 1,002 students, 14% FRL).
- Market conditions: Rents rising fast (+5.9%/yr); 464 active listings in the ZIP; 7 comparable units currently listed for rent nearby; rentals leasing fast (median 4d on market — plan ~1-2 weeks tenant-placement turnaround); high-income renter base; 4,539 units permitted in Douglas County in 2024 (2,583 in 5+ unit buildings).
Forward outlook
- Local home prices are declining (-3.0%/yr); year-one equity from $2k of loan paydown is wiped out by about $9k of value loss. Plan a longer hold.
- Douglas County population projected at +28% by 2050 — long-run rental-demand tailwind backs the buy-and-hold thesis.
Negotiation context
- It's been on market 133 days — a 12% lower offer ($277k) is reasonable based on typical stale-listing flexibility.
Questions for the listing agent
- What do current leases actually rent for vs. the listed asking? Can we see a recent rent roll and the last 12 months of T-12 income?
- It's been on market 133 days. Have you received any prior offers? Is the seller open to a 15% concession, seller financing, or rate buy-down credit?
- What does the HOA fee cover, when was the last increase, and are there any pending special assessments or reserve-fund shortfalls?
- Why hasn't it sold? Are there any deal-killer items the seller is aware of (foundation, flood, title, zoning, code violations)?
- Is there a deadline driving the sale (1031 exchange, divorce, estate, relocation)? That informs how much negotiation room exists.
- Crime grade is F in this area — have there been break-ins, vandalism, or insurance claims at this property in the last 3 years? What carrier currently insures it and at what premium?
- The area grade is low — what's the realistic commute time and amenity access for the typical tenant pool here? Any planned neighborhood developments (good or bad) we should know about?
- What's the average days-on-market for RENTAL listings here right now (not sales)? A rising rental-DOM trend means longer vacancies and softer asking-rent achievability than the comps imply.
- What's the recent tenant-quality profile in this submarket — average credit score on applications, eviction rate, late-payment / NSF rate, and stable-employment percentage? A property-management company in the area should have these aggregated.
- How much new for-sale + rental construction is in the pipeline within 1–3 miles? Heavy new supply typically softens prices + rents 12–24 months out; constrained supply supports both.
Investment metrics
- 1% rule
- 0.85% ✗
- Cap rate
- 5.80%
- Cash-on-cash
- -1.75%
- DSCR
- 0.92
- GRM
- 9.9
CMA / ARV
No comps found within radius.
Projected returns pro-forma
-3.0% appreciation · 5.88% rent growth · sell at horizon
- IRR
- -15.9%
- Equity multiple
- 0.42×
- Total profit
- $-51,210
- Equity at exit
- $46,966
- IRR
- -3.0%
- Equity multiple
- 0.77×
- Total profit
- $-20,256
- Equity at exit
- $27,235
Cash invested: $88,197 (down + closing). Projections, not guarantees.
Landlord ↔ Tenant lean methodology
- Overall (STATE)
- 83 Strongly Landlord-Friendly
- State Nebraska
- 83 Strongly Landlord-Friendly · R+13
- County
- — inherits STATE
- City
- — inherits STATE
ZIP-level market 68007
- Home prices YoY
- -19.4%
- Rents YoY
- 5.9%
- Active inventory
- 464
- Price-to-rent
- 9.9×
Monthly cashflow live
- Estimated rent
- $2,664 high interval (Pro) →
- Mortgage (P&I)
- −$1,652
- Tax est. 1.5%
- −$394 /mo · $4,725/yr
- Insurance
- −$131
- HOA
- −$56
- Vacancy / Maint / Mgmt
- −$559
- Net cashflow
- $-128
Break-even live
Sensitivity live
| Price | -10% $89 | -5% $-20 | +0% $-128 | +5% $-237 | +10% $-346 |
|---|---|---|---|---|---|
| Rent | -10% $-339 | -5% $-234 | +0% $-128 | +5% $-23 | +10% $82 |
| Rate | -1.0pp $30 | -0.5pp $-48 | base $-128 | +0.5pp $-210 | +1.0pp $-293 |
UW: 25.0% down · 7.5% · 30yr · 1.5% tax · 5.0% vac · 8.0% maint · 8.0% mgmt
Financing live
Cash to close
- Down payment
- $78,748
- Closing costs
- $9,450
- Reserves months
- —
- Total cash needed
- —
Loan-product check · same deal, 3 products live
Conventional
25% down · 7.5% · 30yr
- Down + closing
- —
- Monthly P&I
- —
- Monthly cashflow
- —
- DSCR
- —
- Eligible?
- —
Personal DTI + credit; lowest rate.
DSCR
20% down · 8.5% · 30yr
- Down + closing
- —
- Monthly P&I
- —
- Monthly cashflow
- —
- DSCR
- —
- Eligible?
- —
No personal income docs; deal must DSCR.
Hard money
10% down · 12.0% · 12mo
- Down + closing
- —
- Monthly P&I
- —
- Monthly cashflow
- —
- DSCR
- —
- Eligible?
- —
Short-term bridge; refi at stabilization.
Rent comps 7 comps
| Address | Beds | Baths | Sqft | Rent | $/sqft | DOM | Units | Dist |
|---|---|---|---|---|---|---|---|---|
| 7308 N 167th Ave Bennington, NE | 4.0 | 3.0 | 2213 | $3,000 | $1.36 | 3d | 1 | 0.35mi |
| 16333 Potter St Bennington, NE | 3.0 | 2.0 | 1618 | $3,200 | $1.98 | 3d | 1 | 0.50mi |
| 17451 Tucker St Bennington, NE | 3.0 | 3.5 | 2442 | $3,100 | $1.27 | 25d | 1 | 0.66mi |
| 8903 N 167th St Bennington, NE | 3.0 | 2.5 | 1511 | $2,500 | $1.65 | 3d | 1 | 0.73mi |
| 6220 N 160th Ave Omaha, NE | 1.0–3.0 | 1.0–2.5 | 1137 | $2,690 | $2.36 | 3d | 13 | 1.31mi |
| 15304 Bondesson St Bennington, NE | 3.0 | 2.0 | 1256 | $2,000 | $1.59 | 23d | 1 | 1.33mi |
| 15303 Willit St Bennington, NE | 3.0 | 2.0 | 1345 | $2,200 | $1.64 | 45d | 1 | 1.35mi |
HOA detail
- Monthly dues
- $56 · $672/yr
- Likely covers
- electric
Listing history 7 events
-
2026-04-16status Pending
-
2026-04-09price $314,990
-
2026-03-12price $319,990
-
2026-02-10price $328,990
-
2026-01-15price $323,990
-
2025-12-04$318,990 New
-
2024-12-11soldstatus $425,000
ⓘ Source: listings_history table (triggers on properties + properties_extension) + one-shot
backfill from property_details.listing_events for pre-trigger history.
Nearby sold comps map
Loading sold comps map…
Walkable amenities ~0.75 mi
Loading nearby amenities…
Taxation est. · year 1
- Rental income
- $31,965
- − Mortgage interest
- −$17,644
- − Property taxes
- −$4,725
- − Insurance
- −$1,575
- − Repairs & maintenance
- −$2,557
- − Management
- −$2,557
- − HOA
- −$672
- − Depreciation
- −$9,163
- Taxable loss
- −$6,929
- Est. tax savings @ 24.0%
- +$1,663
- After-tax cash flow
- $121/yr
For passive investors: Depreciation is non-cash, so a rental often shows a tax loss while cash-flowing — sheltering income. Rental losses are passive: they offset passive income freely, and up to $25,000/yr can offset ordinary (W-2) income if you actively participate and your MAGI is under $100k (phasing out to $0 by $150k); unused losses carry forward. On sale, claimed depreciation is recaptured at up to 25%, and gains may owe capital-gains tax (a 1031 exchange can defer both). Figures are a year-1 estimate at your 24.0% rate — not tax advice; consult a CPA.
Schools (NCES district)
- District
- Bennington Public Schools
- NCES district ID
- 3103990
- Math proficiency
- 67% ▼ -6.00%
- Reading proficiency
- 67% ▼ -7.00%
- Median HH income
- $87,771
- Composite
- 60.5/100
- National rank
- #843
- State rank
- #3 of 111 in NE
Livability — Omaha
- Score
- 84/100
- State rank
- #7
- US rank
- #663
Category grades
Schools grade is shown separately in the Schools card above.
Census & demographics
- County
- Douglas County · 538,646 people
- City population
- 552,986
- Metro
- Omaha-Council Bluffs, NE-IA
- Population (ZIP)
- 19,536
- Household income
- $141,042
- Rent vs Own
- Severe rent burden
- 107.0
Population outlook (Douglas County) Hauer SSP2
- Today (2025)
- 625,245 people
- By 2030
- 661,613 · +5.8%
- By 2040
- 732,395 · +17.1%
- By 2050
- 801,988 · +28.3%
- By 2075
- 968,637 · +54.9%
- By 2100
- 1,101,871 · +76.2%
Race, ethnicity, and origin ACS 2023
- Neighborhood character
- Predominantly White (84%)
- Race & ethnicity
- White 84% Hispanic / Latino 6% Two or more races 5% Black 4% Asian 2%
- Hispanic origin (detail)
- Mexican 3%
- Common ancestry
- Iranian 4% Romanian 4% Italian 3%
- Foreign-born
- 3% · Canada
- Languages at home
- 94% English-only · Spanish 3% Other Indo-European 1% Russian/Polish/Slavic 1%
Political lean MEDSL · Douglas
- 2024 margin
- D (+10.2) · D 54.4% · R 44.2% · Other 1.4%
- 2008→2024 swing
- +5.5pp toward D · 2008: 4.6pp · 2024: 10.2pp
- All cycles
- 2024: D+10.2 2020: D+11.3 2016: D+1.4 2012: R+4.3 2008: D+4.6
Not yet ingested
- Civics
- —
Market trends
- HPI YoY
- ▼ -60.06%
- Current HPI
- 250.3443
- Rent YoY
- ▲ 5.88%
- Metro
- Omaha-Council Bluffs, NE-IA
- State GDP YoY
- ▲ 0.68%
- F500 in state
- 2
Industry mix (Fortune 500 HQ in NE)
| Industry | F500 HQs | Revenue |
|---|---|---|
| Conglomerate | 1 | $371B |
|
||
Price history
-25.9% since first listed7 events — show timeline
- 2026-04-16 Pending — GPRMLS
- 2026-04-09 Price Changed $314,990 GPRMLS
- 2026-03-12 Price Changed $319,990 GPRMLS
- 2026-02-10 Price Changed $328,990 GPRMLS
- 2026-01-15 Price Changed $323,990 GPRMLS
- 2025-12-04 Listed $318,990 GPRMLS
- 2024-12-11 Sold (Public Records) $425,000 Public Records
Property tax history
+129.9%/yrLatest (2025): $551 · +95.6% YoY. Source: county tax records.
Cash-flow waterfall
monthlySold comps — $/sqft
last 12 mo · ≤1 miLoading sold comps…