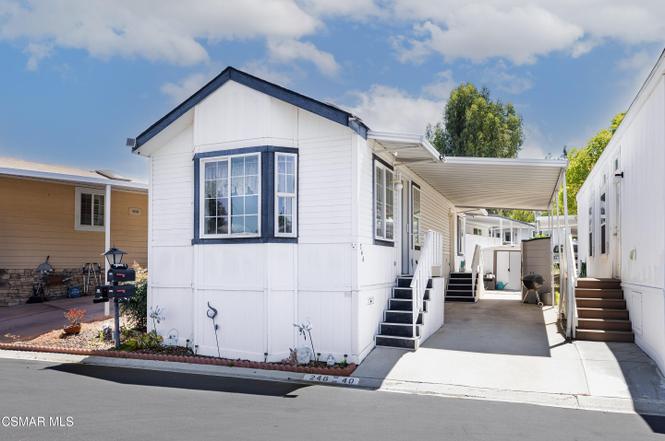
246 Dinsmore Dr #40 · Thousand Oaks, CA
Flood risk 1/10 · Minimal
- FEMA flood zone
- X (unshaded)
- Chance of flooding over 30 yrs
- 0.0%
- Est. flood insurance / yr
- $507 – $1,088
Fire risk 7/10 · Major
- Est. fire insurance / yr
- $659 – $1,223
Heat risk 3/10 · Minor
- Hot days now (above 100°F)
- 7 days/yr
- Hot days in 30 yrs
- 18 days/yr
Wind risk 1/10 · Minimal
- Chance of severe wind over 30 yrs
- —
Air-quality risk 4/10 · Minor
- Unhealthy air days now
- 5 days/yr
- Unhealthy air days in 30 yrs
- 5 days/yr
Risk factors via First Street. Map © Google.
Why this score? — see what drove the C- grade
The composite is a weighted blend of 9 inputs, each scored 0–100. Each bar is that input's sub-score; the figure is the points it added to the 100-point composite (weight × sub-score).
- Cash flow +25.1/30.0
- DSCR +8.2/10.0
- 1% rule +6.6/10.0
- Schools +6.0/10.0
- Livability +3.5/5.0
- Rent growth +2.5/5.0
- Condition / age +2.5/5.0
- ARV discount +0.0/15.0
- Appreciation +0.0/10.0
$249,950
🖨 Deal sheet (PDF) 📄 Offer letter ✓ Due diligence
Listing remarks MLS
Ranch Mobile Home Park Community. This Mobile Home Features Washer And Dryer And Refrigerator W/ O Warranty, Sold As Is. Hard Wood Floors. Great Location In The End Of Park. Low Low Rent ! Senior Park, buyer has to be 55 years of age !
Key facts
- Bright kitchen
- Dual-pane windows
- Cathedral ceilings
Tags
Property features AI
Finance
- Other: Listing is active; photos available
- Financial info: Accepts Conventional and Cash financing
- HOA & community: Homeowners association disclosures and CC&R apply; Located in a mobile home park (Ranch Mobile Homes Park-568)
Exterior
- Parking: 1-car carport; No attached garage
- Utilities: Located in Ranch Mobile Homes Park (land-lease type: Other)
- Home design: Manufactured/mobile home (model info available by calling); Built in 1997; Single-story (mobile home)
- Construction: Building area reported as 616 (public records)
- Exterior features: Ground-level entry with steps; No private pool or spa; No significant view
Interior
- Kitchen: Microwave; Range
- Bedrooms: 1 bedroom
- Bathrooms: 1 full bathroom
- Heating & cooling: Heating present
- Interior features: Cathedral ceiling(s); No interior steps; Double pane windows
- Laundry & utility: Laundry in an individual room; Laundry located inside
Neighborhood map
What this means for you Summary
Snapshot
- This is a 1-bed/1.0-bath manufactured listed at $250k.
Deal economics
- At list price, monthly cash flow is $555 ($7k/yr) — positive.
- The deal already cash-flows at list — no discount required.
- Meets the 1% rule at list price ($3k rent vs $250k).
- Cap rate 9.0% vs local median 2.8% in Thousand Oaks — top-decile yield for the area; either an underpriced asset or a hidden risk that comps aren't pricing in. Stress-test before assuming the spread holds.
Location & tenants
- Location reads 70/100 on livability (#226 in CA) — a middle-class / working-renter tenant base. Strengths: crime A+, commute A+, employment A+; Watch: cost of living F, health & safety F.
- Conejo Valley Unified (urban): math 57% / reading 72% proficiency, ranked #59 of 517 in CA (top 11%) — acceptable for families but not a draw, mixed tenant base, ~2y average lease; only 19% free/reduced lunch — higher-income household profile.
- Market conditions: Rents flat; 163 active listings in the ZIP; 7 comparable units currently listed for rent nearby; rentals leasing fast (median 5d on market — plan ~1-2 weeks tenant-placement turnaround); high-income renter base; 1,759 units permitted in Ventura County in 2024 (1,196 in 5+ unit buildings).
Forward outlook
- Local home prices are declining (-3.0%/yr); year-one equity from $2k of loan paydown is wiped out by about $7k of value loss. Plan a longer hold.
- Ventura County population projected at +4% by 2050 — modest demand growth; plan on rents tracking national, not racing it.
Negotiation context
- Only 11 days on market — expect competitive offers; lowballing is unlikely to land.
- 11 sale attempts since 17y ago with the ask held roughly flat each time — persistent listings suggest the price (not the market) is what's stuck; bring a comps-based counter.
- Current owner paid $54k; list at $250k implies a 363% gain — meaningful room to come down on a strong offer.
Risks & watch-outs
- Climate carrying-cost: major wildfire risk — expect insurance premiums to compound above CPI over the hold.
Questions for the listing agent
- Is there a deadline driving the sale (1031 exchange, divorce, estate, relocation)? That informs how much negotiation room exists.
- Schools are B-rated — typically a magnet for longer-tenancy family renters. What's the average tenant stay here, and is there a school-zone premium baked into asking?
- What's the average days-on-market for RENTAL listings here right now (not sales)? A rising rental-DOM trend means longer vacancies and softer asking-rent achievability than the comps imply.
- What's the recent tenant-quality profile in this submarket — average credit score on applications, eviction rate, late-payment / NSF rate, and stable-employment percentage? A property-management company in the area should have these aggregated.
- How much new for-sale + rental construction is in the pipeline within 1–3 miles? Heavy new supply typically softens prices + rents 12–24 months out; constrained supply supports both.
Investment metrics
- 1% rule
- 1.16% ✓
- Cap rate
- 8.96%
- Cash-on-cash
- 9.51%
- DSCR
- 1.42
- GRM
- 7.2
CMA / ARV
- ARV (on-the-fly)
- $187,264
- Comps found
- 4
Show comp detail 4 sales within ~0.75 mi
| Address | Dist | Beds/Ba | Sqft | Sold | Price | $/sf | Match |
|---|---|---|---|---|---|---|---|
| 2080 Seco Ct #46 | 0.02mi | 1/1.0 | 576 (-6%) | 4mo | $175,000 | $304 | 85 |
| 2084 Pavo Ct #60 | 0.06mi | 2/1.0 (+1) | 588 (-4%) | 13mo | $225,000 | $383 | 74 |
| 2094 Rodeo Ct #51 | 0.04mi | 1/1.0 | 675 (+10%) | 14mo | $190,000 | $281 | 71 |
| 2187 Pavo Ct #14 | 0.07mi | 2/1.0 (+1) | 656 (+6%) | 15mo | $140,000 | $213 | 68 |
Match score weights: distance 35% · size 25% · config 20% · recency 20%. Top-matched comps best support the ARV.
Projected returns pro-forma
-3.0% appreciation · 0.07% rent growth · sell at horizon
- IRR
- -5.3%
- Equity multiple
- 0.81×
- Total profit
- $-13,395
- Equity at exit
- $37,268
- IRR
- 0.5%
- Equity multiple
- 1.03×
- Total profit
- $1,996
- Equity at exit
- $21,611
Cash invested: $69,986 (down + closing). Projections, not guarantees.
Landlord ↔ Tenant lean methodology
- Overall (STATE)
- 18 Strongly Tenant-Friendly
- State California
- 18 Strongly Tenant-Friendly · D+13
- County
- — inherits STATE
- City
- — inherits STATE
ZIP-level market 91362
- Rents YoY
- 0.1%
- Active inventory
- 163
- Price-to-rent
- 7.2×
Monthly cashflow live
- Estimated rent
- $2,889 high interval (Pro) →
- Mortgage (P&I)
- −$1,311
- Tax est. 1.5%
- −$312 /mo · $3,749/yr
- Insurance
- −$104
- HOA
- −$0
- Vacancy / Maint / Mgmt
- −$607
- Net cashflow
- $555
Break-even live
Sensitivity live
| Price | -10% $728 | -5% $641 | +0% $555 | +5% $468 | +10% $382 |
|---|---|---|---|---|---|
| Rent | -10% $327 | -5% $441 | +0% $555 | +5% $669 | +10% $783 |
| Rate | -1.0pp $681 | -0.5pp $618 | base $555 | +0.5pp $490 | +1.0pp $424 |
UW: 25.0% down · 7.5% · 30yr · 1.5% tax · 5.0% vac · 8.0% maint · 8.0% mgmt
Financing live
Cash to close
- Down payment
- $62,488
- Closing costs
- $7,498
- Reserves months
- —
- Total cash needed
- —
Loan-product check · same deal, 3 products live
Conventional
25% down · 7.5% · 30yr
- Down + closing
- —
- Monthly P&I
- —
- Monthly cashflow
- —
- DSCR
- —
- Eligible?
- —
Personal DTI + credit; lowest rate.
DSCR
20% down · 8.5% · 30yr
- Down + closing
- —
- Monthly P&I
- —
- Monthly cashflow
- —
- DSCR
- —
- Eligible?
- —
No personal income docs; deal must DSCR.
Hard money
10% down · 12.0% · 12mo
- Down + closing
- —
- Monthly P&I
- —
- Monthly cashflow
- —
- DSCR
- —
- Eligible?
- —
Short-term bridge; refi at stabilization.
Rent comps 7 comps
| Address | Beds | Baths | Sqft | Rent | $/sqft | DOM | Units | Dist |
|---|---|---|---|---|---|---|---|---|
| 235 N Conejo School Rd Thousand Oaks, CA | 2.0 | 1.0–2.0 | 863 | $3,095 | $3.58 | 3d | 1 | 0.08mi |
| 223 Erbes Rd Thousand Oaks, CA | 1.0–2.0 | 1.0–2.0 | 875 | $2,295 | $2.62 | 13d | 5 | 0.30mi |
| 2665 Los Feliz Dr Thousand Oaks, CA | 2.0 | 1.0 | 700 | $3,200 | $4.57 | 25d | 1 | 0.51mi |
| 1394 E Hillcrest Dr Thousand Oaks, CA | 1.0–2.0 | 1.0–2.0 | 912 | $2,549 | $2.79 | 3d | 14 | 0.52mi |
| 1348 E Hillcrest Dr #69 Thousand Oaks, CA | 1.0 | 1.0 | 654 | $2,295 | $3.51 | 45d | 1 | 0.55mi |
| 603 Hampshire Rd Westlake Village, CA | 1.0–3.0 | 1.0–2.0 | 1024 | $2,397 | $2.34 | 4d | 10 | 1.34mi |
| 351 Hodencamp Rd Thousand Oaks, CA | 2.0 | 1.0–2.0 | 627 | $3,002 | $4.79 | 4d | 1 | 1.43mi |
Listing history 8 events
-
2026-06-21days on market $249,950 Active 11 DOM
-
2026-06-18days on market $249,950 Active 8 DOM
-
2026-06-17days on market $249,950 Active 7 DOM
-
2026-06-16days on market $249,950 Active 6 DOM
-
2026-06-15days on market $249,950 Active 5 DOM
-
2026-06-13days on market $249,950 Active 3 DOM
-
2026-06-13remarks 699-char remark
-
2026-06-13$249,950 Active 2 DOM
ⓘ Source: listings_history table (triggers on properties + properties_extension) + one-shot
backfill from property_details.listing_events for pre-trigger history.
Climate risk First Street
- Flood 1/10 Low FEMA zone X (unshaded) · 0% chance over 30 yrs
- Wildfire 7/10 Severe
- Heat 3/10 Moderate 7 d/yr ≥100°F today · 18 d/yr by 30 yrs out
- Wind 1/10 Low
- Air quality 4/10 Moderate 5 unhealthy d/yr today · 5 by 30 yrs out
Nearby sold comps map
Loading sold comps map…
Walkable amenities ~0.75 mi
Loading nearby amenities…
Taxation est. · year 1
- Rental income
- $34,666
- − Mortgage interest
- −$14,001
- − Property taxes
- −$3,749
- − Insurance
- −$1,250
- − Repairs & maintenance
- −$2,773
- − Management
- −$2,773
- − Depreciation
- −$7,271
- Taxable income
- $2,848
- Est. tax owed @ 24.0%
- −$684
- After-tax cash flow
- $5,975/yr
For passive investors: Depreciation is non-cash, so a rental often shows a tax loss while cash-flowing — sheltering income. Rental losses are passive: they offset passive income freely, and up to $25,000/yr can offset ordinary (W-2) income if you actively participate and your MAGI is under $100k (phasing out to $0 by $150k); unused losses carry forward. On sale, claimed depreciation is recaptured at up to 25%, and gains may owe capital-gains tax (a 1031 exchange can defer both). Figures are a year-1 estimate at your 24.0% rate — not tax advice; consult a CPA.
Schools (NCES district)
- District
- Conejo Valley Unified
- NCES district ID
- 0609640
- Math proficiency
- 57% ▬ 0.00%
- Reading proficiency
- 72% ▲ 6.00%
- Median HH income
- $100,413
- Composite
- 59.57/100
- National rank
- #914
- State rank
- #59 of 517 in CA
Livability — Thousand Oaks
- Score
- 70/100
- State rank
- #226
- US rank
- #7364
Category grades
Schools grade is shown separately in the Schools card above.
Census & demographics
- Census place
- Thousand Oaks, CA
- County
- Ventura County · 829,955 people
- City population
- 121,704
- Metro
- Oxnard-Thousand Oaks-Ventura, CA
- Population (ZIP)
- 35,996
- Household income
- $139,800
- Rent vs Own
- Severe rent burden
- 1283.0
Population outlook (Ventura County) Hauer SSP2
- Today (2025)
- 895,754 people
- By 2030
- 912,134 · +1.8%
- By 2040
- 931,454 · +4.0%
- By 2050
- 934,609 · +4.3%
- By 2075
- 924,899 · +3.3%
- By 2100
- 864,712 · -3.5%
Race, ethnicity, and origin ACS 2023
- Neighborhood character
- Predominantly White (68%)
- Race & ethnicity
- White 68% Hispanic / Latino 16% Two or more races 12% Asian 9% Black 2%
- Hispanic origin (detail)
- Mexican 11%
- Common ancestry
- Italian 7% Romanian 3% Scotch-Irish 3%
- Foreign-born
- 19% · Canada, China, South Korea
- Languages at home
- 77% English-only · Spanish 10% Other Indo-European 5% Chinese 3%
Political lean MEDSL · Ventura
- 2024 margin
- D (+15.1) · D 56.1% · R 41.0% · Other 2.9%
- 2008→2024 swing
- +2.8pp toward D · 2008: 12.3pp · 2024: 15.1pp
- All cycles
- 2024: D+15.1 2020: D+21.1 2016: D+16.8 2012: D+5.3 2008: D+12.3
Not yet ingested
- Civics
- —
Market trends
- HPI YoY
- ▼ -880.38%
- Current HPI
- 289.461
- Rent YoY
- ▲ 0.07%
- Metro
- Oxnard-Thousand Oaks-Ventura, CA
- State GDP YoY
- ▲ 3.21%
- F500 in state
- 116
Industry mix (Fortune 500 HQ in CA)
| Industry | F500 HQs | Revenue |
|---|---|---|
| Technology | 27 | $1,492B |
|
||
| Financial Services | 3 | $174B |
|
||
| Retail | 3 | $44B |
|
||
| Insurance | 3 | $26B |
|
||
| Media / Entertainment | 2 | $115B |
|
||
| Pharmaceuticals / Biotech | 2 | $62B |
|
||
Price history
+140.3% since first listed30 events — show timeline
- 2026-06-10 Listed $249,950 CSMAR
- 2014-01-23 Sold (MLS) $54,000 TheMLS
- 2013-12-31 Pending — TheMLS
- 2013-09-17 Relisted — TheMLS
- 2013-09-13 Delisted — TheMLS
- 2013-05-29 Relisted — TheMLS
- 2013-05-18 Pending — TheMLS
- 2013-03-12 Price Changed $59,500 TheMLS
- 2013-02-01 Relisted — TheMLS
- 2013-01-31 Delisted — TheMLS
- 2012-12-01 Price Changed $54,500 TheMLS
- 2012-10-03 Price Changed $59,500 TheMLS
- 2012-07-20 Relisted — TheMLS
- 2012-07-20 Price Changed $69,500 TheMLS
- 2011-12-11 Delisted — TheMLS
- 2011-10-22 Relisted — TheMLS
- 2011-09-04 Delisted — TheMLS
- 2011-06-26 Price Changed $74,500 TheMLS
- 2011-06-14 Relisted — TheMLS
- 2011-06-13 Delisted — TheMLS
- 2011-05-16 Relisted — TheMLS
- 2011-04-23 Delisted — TheMLS
- 2010-12-18 Relisted — TheMLS
- 2010-12-01 Delisted — TheMLS
- 2010-08-29 Price Changed $84,500 TheMLS
- 2010-03-30 Relisted — TheMLS
- 2010-03-29 Delisted — TheMLS
- 2010-03-24 Price Changed $92,000 TheMLS
- 2009-10-13 Price Changed $94,900 TheMLS
- 2009-09-29 Listed $104,000 TheMLS
Property tax history
-0.3%/yrLatest (2025): $78 · +3.8% YoY. Source: county tax records.
Cash-flow waterfall
monthlySold comps — $/sqft
last 12 mo · ≤1 miLoading sold comps…