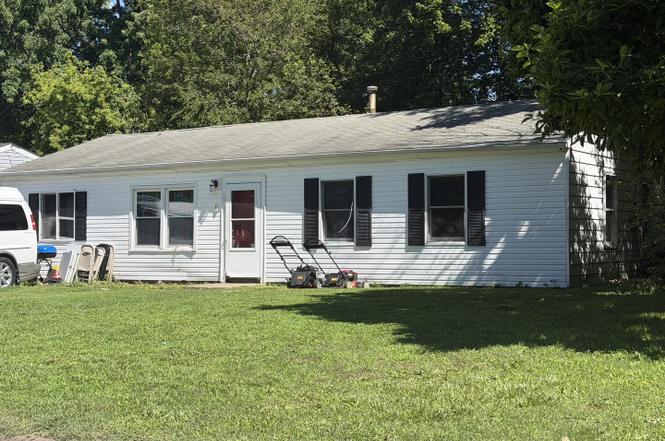
1912 Southwood Dr · Champaign, IL
Flood risk 1/10 · Minimal
- FEMA flood zone
- X (unshaded)
- Chance of flooding over 30 yrs
- 0.0%
- Est. flood insurance / yr
- $507 – $1,088
Fire risk 1/10 · Minimal
- Est. fire insurance / yr
- $804 – $1,492
Heat risk 3/10 · Minor
- Hot days now (above 103°F)
- 7 days/yr
- Hot days in 30 yrs
- 19 days/yr
Wind risk 2/10 · Minimal
- Chance of severe wind over 30 yrs
- 1.0%
Air-quality risk 2/10 · Minimal
- Unhealthy air days now
- 0 days/yr
- Unhealthy air days in 30 yrs
- 1 days/yr
Risk factors via First Street. Map © Google.
Why this score? — see what drove the B- grade
The composite is a weighted blend of 9 inputs, each scored 0–100. Each bar is that input's sub-score; the figure is the points it added to the 100-point composite (weight × sub-score).
- Cash flow +25.4/30.0
- ARV discount +13.0/15.0
- DSCR +8.4/10.0
- 1% rule +6.1/10.0
- Rent growth +4.8/5.0
- Livability +4.2/5.0
- Condition / age +2.5/5.0
- Schools +2.2/10.0
- Appreciation +0.0/10.0
$170,000
🖨 Deal sheet 📄 Offer letter ✓ Due diligence
Listing remarks MLS
Rental Property with Strong Rental Income Available Now! This nicely maintained 4 bedroom home has many recent updates. Interested in Passive Cash Flow? Buy this investment property today and benefit from this long term tenant as well! (Pictures are older when the property was vacant). A Great Property with Fantastic Returns! *Broker Owned
Key facts
- 2 parking spots
- Built 1958
- Listed 2 days
Property features AI
Finance
- Other: Living area recorded from taped measurements
- Financial info: Property is currently leased
- HOA & community: No master association required
Exterior
- Parking: Two parking spaces; Gravel parking (owned)
- Utilities: Public water; Public sewer
- Home design: Detached single-family home; One-story layout; Fee simple ownership; Rehab completed in 2016; Built before 1978 (older construction)
- Construction: Aluminum and vinyl siding; Approximately 61–70 years old
- Exterior features: Yard on a lot measuring approximately 50.19 x 125; Lot smaller than 0.25 acre
Interior
- Kitchen: Kitchen on the main level
- Bedrooms: Four bedrooms (all on the main level); Master bedroom on the main level
- Flooring: Carpet in most bedrooms and master bedroom; Wood laminate in living room; Vinyl flooring in kitchen
- Bathrooms: One full bathroom
- Heating & cooling: Natural gas heating; Central air conditioning
- Interior features: Six total rooms
- Laundry & utility: Laundry room
Neighborhood map
What this means for you Summary
Snapshot
- This is a 4-bed/1.0-bath single-family listed at $170k.
Deal economics
- At list price, monthly cash flow is $394 ($5k/yr) — positive.
- The deal already cash-flows at list — no discount required.
- Meets the 1% rule at list price ($2k rent vs $170k).
- Cap rate 9.1% vs local median 3.8% in Champaign — top-decile yield for the area; either an underpriced asset or a hidden risk that comps aren't pricing in. Stress-test before assuming the spread holds.
Location & tenants
- Location reads 83/100 on livability (#44 in IL, #902 nationally) — a professional / high-income tenant draw. Strengths: commute A+, cost of living A+, housing A+; Watch: crime F.
- Champaign CUSD 4 (urban): math 24% / reading 26% proficiency, ranked #333 of 620 in IL (top 54%) — low school quality limits family demand, transient renter base, plan for 1-2y turnover.
- Zoned schools: Stratton Elementary School (math 12% / reading 2%, grade F, #1,673 of 2,056 statewide, top 84%, 476 students, 0% FRL); Centennial High School (math 26% / reading 27%, grade F, #241 of 693 statewide, top 35%, 1,444 students, 0% FRL) — zoned schools average 0% FRL vs 52% district-wide (52 pts lower); this property's tenant base skews higher-income than the district average.
- Market conditions: Rents rising fast (+9.3%/yr); 89 active listings in the ZIP; 6 comparable units currently listed for rent nearby; rentals leasing fast (median 14d on market — plan ~1-2 weeks tenant-placement turnaround); 573 units permitted in Champaign County in 2024 (359 in 5+ unit buildings).
- This rent runs 32% of the median local income ($71k/yr) — at the standard rent-burdened threshold; future hikes will face affordability resistance.
Forward outlook
- Local home prices are declining (-3.0%/yr); year-one equity from $1k of loan paydown is wiped out by about $5k of value loss. Plan a longer hold.
- Champaign County population projected at +15% by 2050 — modest demand growth; plan on rents tracking national, not racing it.
- At projected returns (-3.0% appreciation + 8.0% rent growth), your $48k cash investment doubles in ~8 years — after that, you're playing with house money.
Negotiation context
- Only 2 days on market — expect competitive offers; lowballing is unlikely to land.
- 4 sale attempts since 10y ago with the ask held roughly flat each time — persistent listings suggest the price (not the market) is what's stuck; bring a comps-based counter.
- Current owner paid $120k; 42% above their basis — modest negotiation headroom, anchor on the comps not their cost.
Risks & watch-outs
- Watch-outs: built in 1958 — expect roof / HVAC / electrical / plumbing capex.
Questions for the listing agent
- Built in 1958 — when were the roof, HVAC, electrical panel, plumbing, and water heater last replaced?
- Is there a deadline driving the sale (1031 exchange, divorce, estate, relocation)? That informs how much negotiation room exists.
- Crime grade is F in this area — have there been break-ins, vandalism, or insurance claims at this property in the last 3 years? What carrier currently insures it and at what premium?
- What's the average days-on-market for RENTAL listings here right now (not sales)? A rising rental-DOM trend means longer vacancies and softer asking-rent achievability than the comps imply.
- What's the recent tenant-quality profile in this submarket — average credit score on applications, eviction rate, late-payment / NSF rate, and stable-employment percentage? A property-management company in the area should have these aggregated.
- How much new for-sale + rental construction is in the pipeline within 1–3 miles? Heavy new supply typically softens prices + rents 12–24 months out; constrained supply supports both.
Investment metrics
- 1% rule
- 1.11% ✓
- Cap rate
- 9.07%
- Cash-on-cash
- 9.92%
- DSCR
- 1.44
- GRM
- 7.5
CMA / ARV
- ARV (on-the-fly)
- $193,550
- Comps found
- 12
Show comp detail 12 sales within ~0.75 mi
| Address | Dist | Beds/Ba | Sqft | Sold | Price | $/sf | Match |
|---|---|---|---|---|---|---|---|
| 2003 W Kirby Ave | 0.19mi | 4/1.0 | 1,130 (-8%) | 1mo | $175,000 | $155 | 77 |
| 1904 Scottsdale Dr | 0.35mi | 3/2.0 (-1) | 1,278 (+4%) | 3mo | $225,000 | $176 | 65 |
| 1608 Chevy Chase Dr | 0.58mi | 3/1.0 (-1) | 1,203 (-2%) | 0mo | $197,500 | $164 | 65 |
| 2412 Lawndale Dr | 0.48mi | 3/1.0 (-1) | 1,167 (-5%) | 1mo | $150,000 | $129 | 64 |
| 1410 S Mattis Ave | 0.40mi | 3/1.5 (-1) | 1,165 (-5%) | 3mo | $174,000 | $149 | 64 |
| 1818 Stratford Dr | 0.63mi | 4/2.0 | 1,194 (-2%) | 1mo | $287,000 | $240 | 61 |
| 1420 S Western Ave | 0.42mi | 3/1.0 (-1) | 1,308 (+7%) | 3mo | $195,000 | $149 | 61 |
| 1212 Cambridge Dr | 0.69mi | 3/1.5 (-1) | 1,222 (-0%) | 1mo | $189,000 | $155 | 60 |
| 1612 Cornell Dr | 0.66mi | 3/1.0 (-1) | 1,192 (-3%) | 2mo | $188,000 | $158 | 58 |
| 1601 Carolyn Dr | 0.32mi | 3/1.0 (-1) | 1,073 (-12%) | 3mo | $157,500 | $147 | 57 |
| 2704 W Kirby Ave | 0.62mi | 3/1.0 (-1) | 1,095 (-11%) | 0mo | $173,000 | $158 | 48 |
| 2705 Willowpark Dr | 0.70mi | 3/1.0 (-1) | 1,053 (-14%) | 1mo | $190,000 | $180 | 38 |
Match score weights: distance 35% · size 25% · config 20% · recency 20%. Top-matched comps best support the ARV.
Projected returns pro-forma
-3.0% appreciation · 8.0% rent growth · sell at horizon
- IRR
- 3.9%
- Equity multiple
- 1.16×
- Total profit
- $7,462
- Equity at exit
- $25,348
- IRR
- 17.4%
- Equity multiple
- 2.77×
- Total profit
- $84,033
- Equity at exit
- $14,698
Cash invested: $47,600 (down + closing). Projections, not guarantees.
Landlord ↔ Tenant lean methodology
- Overall (STATE)
- 43 Moderately Tenant-Leaning
- State Illinois
- 43 Moderately Tenant-Leaning · D+7
- County
- — inherits STATE
- City
- — inherits STATE
ZIP-level market 61821
- Home prices YoY
- -26.1%
- Rents YoY
- 9.3%
- Active inventory
- 89
- Price-to-rent
- 7.5×
Monthly cashflow live
- Estimated rent
- $1,885 high interval (Pro) →
- Mortgage (P&I)
- −$891
- Tax from tax record
- −$133 /mo · $1,598/yr
- Insurance
- −$71
- HOA
- −$0
- Vacancy / Maint / Mgmt
- −$396
- Net cashflow
- $394
Break-even live
UW: 25.0% down · 7.5% · 30yr · 1.5% tax · 5.0% vac · 8.0% maint · 8.0% mgmt
Financing live
Cash to close
- Down payment
- $42,500
- Closing costs
- $5,100
- Reserves months
- —
- Total cash needed
- —
Loan-product check · same deal, 3 products live
Conventional
25% down · 7.5% · 30yr
- Down + closing
- —
- Monthly P&I
- —
- Monthly cashflow
- —
- DSCR
- —
- Eligible?
- —
Personal DTI + credit; lowest rate.
DSCR
20% down · 8.5% · 30yr
- Down + closing
- —
- Monthly P&I
- —
- Monthly cashflow
- —
- DSCR
- —
- Eligible?
- —
No personal income docs; deal must DSCR.
Hard money
10% down · 12.0% · 12mo
- Down + closing
- —
- Monthly P&I
- —
- Monthly cashflow
- —
- DSCR
- —
- Eligible?
- —
Short-term bridge; refi at stabilization.
Rent comps 6 comps
| Address | Beds | Baths | Sqft | Rent | $/sqft | DOM | Units | Dist |
|---|---|---|---|---|---|---|---|---|
| 1915 S Mattis Ave Champaign, IL | 1.0–3.0 | 1.0–2.0 | 971 | $2,099 | $2.16 | 13d | 11 | 0.28mi |
| 1902 Meadow Dr Champaign, IL | 3.0 | 1.0 | 898 | $1,750 | $1.95 | 13d | 1 | 0.32mi |
| 1801 W John St Unit 723 Champaign, IL | 3.0 | 1.5 | 1200 | $1,390 | $1.16 | 21d | 1 | 0.95mi |
| 1801 W John St Unit 1821 Champaign, IL | 3.0 | 1.5 | 1200 | $1,390 | $1.16 | 13d | 1 | 0.95mi |
| 910 S Duncan Rd Champaign, IL | 3.0 | 1.0 | 1050 | $1,400 | $1.33 | 43d | 1 | 1.11mi |
| 618 Dogwood Dr Champaign, IL | 3.0 | 1.0 | 1073 | $2,200 | $2.05 | 13d | 1 | 1.37mi |
Listing history 3 events
-
2026-06-18days on market $170,000 Active 2 DOM
-
2026-06-17remarks 699-char remark
-
2026-06-17$170,000 Active 1 DOM
ⓘ Source: listings_history table (triggers on properties + properties_extension) + one-shot
backfill from property_details.listing_events for pre-trigger history.
Tax reassessment forecast IL · Partial reset (capped growth)
- Current annual tax
- $1,598 · $133/mo
- Projected year-2 tax
- $2,728 · $227/mo
- Expected delta
- +$1,131/yr (+$94/mo · 70.8%)
ⓘ Screening estimate from a state-policy table — verify with the county assessor before closing.
Climate risk First Street
- Flood 1/10 Low FEMA zone X (unshaded) · 0% chance over 30 yrs
- Wildfire 1/10 Low
- Heat 3/10 Moderate 7 d/yr ≥103°F today · 19 d/yr by 30 yrs out
- Wind 2/10 Low 100% chance of damaging wind over 30 yrs
- Air quality 2/10 Low 0 unhealthy d/yr today · 1 by 30 yrs out
Nearby sold comps map
Loading sold comps map…
Walkable amenities ~0.75 mi
Loading nearby amenities…
Taxation est. · year 1
- Rental income
- $22,619
- − Mortgage interest
- −$9,523
- − Property taxes
- −$1,598
- − Insurance
- −$850
- − Repairs & maintenance
- −$1,809
- − Management
- −$1,809
- − Depreciation
- −$4,945
- Taxable income
- $2,084
- Est. tax owed @ 24.0%
- −$500
- After-tax cash flow
- $4,223/yr
For passive investors: Depreciation is non-cash, so a rental often shows a tax loss while cash-flowing — sheltering income. Rental losses are passive: they offset passive income freely, and up to $25,000/yr can offset ordinary (W-2) income if you actively participate and your MAGI is under $100k (phasing out to $0 by $150k); unused losses carry forward. On sale, claimed depreciation is recaptured at up to 25%, and gains may owe capital-gains tax (a 1031 exchange can defer both). Figures are a year-1 estimate at your 24.0% rate — not tax advice; consult a CPA.
Schools (NCES district)
- District
- Champaign CUSD 4
- NCES district ID
- 1709420
- Math proficiency
- 24% ▼ -7.00%
- Reading proficiency
- 26% ▼ -7.00%
- Median HH income
- $45,797
- Composite
- 21.66/100
- National rank
- #8281
- State rank
- #333 of 620 in IL
Livability — Champaign
- Score
- 83/100
- State rank
- #44
- US rank
- #902
Category grades
Schools grade is shown separately in the Schools card above.
Census & demographics
- Census place
- Champaign, IL
- County
- Champaign County · 182,148 people
- City population
- 96,852
- Metro
- Champaign-Urbana, IL
- Population (ZIP)
- 28,611
- Household income
- $70,715
- Rent vs Own
- Severe rent burden
- 1023.0
Population outlook (Champaign County) Hauer SSP2
- Today (2025)
- 223,848 people
- By 2030
- 231,416 · +3.4%
- By 2040
- 244,321 · +9.1%
- By 2050
- 256,432 · +14.6%
- By 2075
- 285,823 · +27.7%
- By 2100
- 296,406 · +32.4%
Race, ethnicity, and origin ACS 2023
- Neighborhood character
- Diverse neighborhood (Simpson 0.61)
- Race & ethnicity
- White 57% Black 23% Asian 8% Hispanic / Latino 8% Two or more races 6%
- Hispanic origin (detail)
- Mexican 4% Puerto Rican 2%
- Common ancestry
- Romanian 4% Lithuanian 2% Slovak 2%
- Foreign-born
- 14% · Canada, China, South Korea
- Languages at home
- 82% English-only · Spanish 5% French/Haitian/Cajun 5% Tagalog/Filipino 2%
Political lean MEDSL · Champaign
- 2024 margin
- Strong D (+24.1) · D 61.3% · R 37.2% · Other 1.5%
- 2008→2024 swing
- +6.6pp toward D · 2008: 17.5pp · 2024: 24.1pp
- All cycles
- 2024: D+24.1 2020: D+22.8 2016: D+18.4 2012: D+6.8 2008: D+17.5
Not yet ingested
- Civics
- —
Market trends
- HPI YoY
- ▼ -78.19%
- Current HPI
- 221.1245
- Rent YoY
- ▲ 9.29%
- Metro
- Champaign-Urbana, IL
- State GDP YoY
- ▲ 1.59%
- F500 in state
- 60
Industry mix (Fortune 500 HQ in IL)
| Industry | F500 HQs | Revenue |
|---|---|---|
| Insurance | 4 | $201B |
|
||
| Consumer Goods | 4 | $87B |
|
||
| Industrial Machinery | 3 | $64B |
|
||
| Healthcare | 2 | $55B |
|
||
| Retail / Pharmacy | 1 | $148B |
|
||
| Agriculture / Food | 1 | $86B |
|
||
Price history
+233.3% since first listed17 events — show timeline
- 2026-06-16 Listed $170,000 MRED as Distributed by MLS Grid
- 2023-03-07 Sold (Public Records) $120,000 Public Records
- 2023-02-28 Sold (MLS) $120,000 MRED as Distributed by MLS Grid
- 2023-01-25 Pending — MRED as Distributed by MLS Grid
- 2022-10-25 Price Changed $120,000 MRED as Distributed by MLS Grid
- 2022-09-26 Price Changed $123,500 MRED as Distributed by MLS Grid
- 2022-09-10 Price Changed $129,900 MRED as Distributed by MLS Grid
- 2022-08-29 Price Changed $124,900 MRED as Distributed by MLS Grid
- 2022-08-20 Price Changed $129,900 MRED as Distributed by MLS Grid
- 2022-07-09 Relisted — MRED as Distributed by MLS Grid
- 2022-07-09 Price Changed $134,900 MRED as Distributed by MLS Grid
- 2022-05-11 Pending — MRED as Distributed by MLS Grid
- 2022-05-09 Price Changed $135,000 MRED as Distributed by MLS Grid
- 2022-04-29 Listed $137,500 MRED as Distributed by MLS Grid
- 2016-06-15 Listing Removed — MRED as Distributed by MLS Grid
- 2016-04-01 Listed — MRED as Distributed by MLS Grid
- 2015-12-01 Sold (Public Records) $51,000 Public Records
Property tax history
-3.6%/yrLatest (2025): $1,598 · +12.5% YoY. Source: county tax records.
Cash-flow waterfall
monthlySold comps — $/sqft
last 12 mo · ≤1 miLoading sold comps…