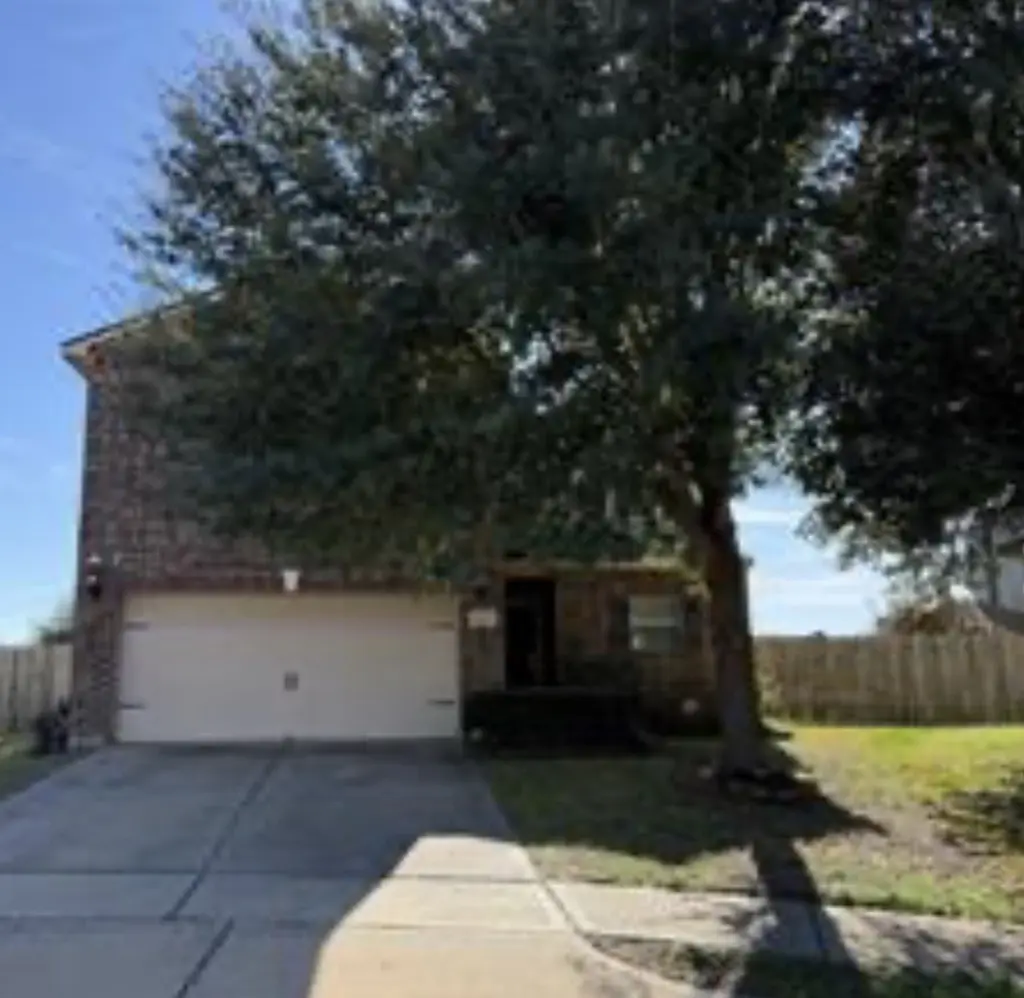
16203 Silver Wing Ln · Houston, TX
Flood risk 1/10 · Minimal
- FEMA flood zone
- X (unshaded)
- Chance of flooding over 30 yrs
- 0.0%
- Est. flood insurance / yr
- $507 – $1,088
Fire risk 5/10 · Moderate
- Est. fire insurance / yr
- $1,222 – $2,270
Heat risk 9/10 · Severe
- Hot days now (above 110°F)
- 7 days/yr
- Hot days in 30 yrs
- 23 days/yr
Wind risk 9/10 · Severe
- Chance of severe wind over 30 yrs
- 99.0%
Air-quality risk 2/10 · Minimal
- Unhealthy air days now
- 1 days/yr
- Unhealthy air days in 30 yrs
- 1 days/yr
Risk factors via First Street. Map © Google.
Why this score? — see what drove the D- grade
The composite is a weighted blend of 9 inputs, each scored 0–100. Each bar is that input's sub-score; the figure is the points it added to the 100-point composite (weight × sub-score).
- ARV discount +15.0/15.0
- Cash flow +5.9/30.0
- Livability +3.7/5.0
- 1% rule +3.0/10.0
- Schools +2.9/10.0
- Condition / age +2.5/5.0
- Rent growth +2.1/5.0
- DSCR +0.2/10.0
- Appreciation +0.0/10.0
$299,000
🖨 Deal sheet (PDF) 📄 Offer letter ✓ Due diligence
Listing remarks
Welcome to this beautifully maintained two-story brick home offering space, comfort, and privacy. Featuring 5 spacious bedrooms, 2.5 bathrooms, and a 2-car garage, this home is designed for family living. The private owner’s suite is located on the main floor and features an en suite bath with double vanities and a relaxing soaking tub. Upstairs, all secondary bedrooms are generously sized and include walk-in closets for ample storage. Enjoy entertaining in the large game room, ideal for movie nights, a play area, or additional living space. The open-concept kitchen features a gas stove, breakfast bar, and seamless flow into the dining and living areas. Situated in a quiet cul-de-sac
Key facts
- Private owners suite
- Open concept kitchen
- En suite bath
Tags
Property features AI
Finance
- Other: Energy-efficient HVAC, thermostat, and windows
- HOA & community: Mallard Crossing HOA with an annual fee of $360
Exterior
- Parking: Attached garage with 2 spaces; Garage door opener
- Security: Owned security system
- Utilities: Public water; Public sewer
- Home design: Residential property; Built in 2010; Slab foundation; Composition roof
- Construction: Brick and wood siding construction
- Exterior features: Fenced backyard; Located on a cul-de-sac within a subdivision
Interior
- Kitchen: Dishwasher; Electric oven; Garbage disposal; Gas range
- Bedrooms: Primary bedroom on the first floor (16x13); Four additional bedrooms on the second floor (16x12; 10x14; 13x14; 12x16); Total of 5 bedrooms
- Flooring: Carpet; Tile
- Bathrooms: 2 full bathrooms; 1 half bathroom
- Heating & cooling: Central heating (gas); Central air conditioning (electric); Attic fan
- Interior features: Breakfast bar; Double vanity; Kitchen/family room combo; Primary bedroom with private bath; Soaking tub; Separate shower; Tub/shower; Ceiling fans; Living/dining room; Programmable thermostat; Low emissivity windows
- Laundry & utility: Washer hookup; Electric dryer hookup
Neighborhood map
What this means for you Summary
Snapshot
- This is a 3-bed/2.5-bath single-family listed at $299k.
Deal economics
- At list price, monthly cash flow is $-591 ($-7k/yr) — negative.
- To cash-flow at today's rent, offer at most $195k (34.9% below list).
- To meet the 1% rule (rent ≥ 1% of price), the offer needs to be $239k (20.1% below list).
- Recommended offer: $195k (34.9% below list) — sets the bar for cash-flow.
- Cap rate 3.9% vs local median 3.2% in Houston — meaningfully above typical; check what's discounted (condition, days-on-market, listing class) to confirm the premium yield is real.
Location & tenants
- Location reads 74/100 on livability (#184 in TX, #4,771 nationally) — a middle-class / working-renter tenant base. Strengths: amenities A+, cost of living A+, housing A+; Watch: crime F.
- Waller ISD (rural): math 30% / reading 35% proficiency, ranked #532 of 826 in TX (top 64%) — families likely to look elsewhere, expect single-tenant / working-renter base with shorter leases.
- Zoned schools: I T Holleman El (math 33% / reading 31%, grade F, #2,268 of 4,322 statewide, top 55%, 688 students, 70% FRL); Waller J H (math 21% / reading 28%, grade F, #1,279 of 1,662 statewide, top 78%, 899 students, 69% FRL); Waller H S (math 25% / reading 40%, grade F, #1,029 of 1,632 statewide, top 64%, 2,639 students, 62% FRL).
- Market conditions: Rents soft (-1.6%/yr); 1791 active listings in the ZIP; 1 comparable units currently listed for rent nearby; high-income renter base; 29,883 units permitted in Harris County in 2024 (8,621 in 5+ unit buildings).
Forward outlook
- Local home prices are declining (-3.0%/yr); year-one equity from $2k of loan paydown is wiped out by about $9k of value loss. Plan a longer hold.
- Harris County population projected at +47% by 2050 — long-run rental-demand tailwind backs the buy-and-hold thesis.
Negotiation context
- It's been on market 37 days — a 3% lower offer ($290k) is reasonable based on typical stale-listing flexibility.
- 3 sale attempts since 15y ago; this cycle's ask has dropped $50k (14%) from the opening price — seller is motivated, your offer sets the floor, not the list.
Risks & watch-outs
- Watch-outs: property tax is 3.0% of price.
- Climate carrying-cost: severe wind risk, 99% chance of damaging wind over 30y; moderate wildfire risk; extreme-heat days projected 7→23/yr by 2055 (HVAC capex compounding) — expect insurance premiums to compound above CPI over the hold.
Questions for the listing agent
- What do current leases actually rent for vs. the listed asking? Can we see a recent rent roll and the last 12 months of T-12 income?
- It's been on market 37 days. Have you received any prior offers? Is the seller open to a 35% concession, seller financing, or rate buy-down credit?
- Property tax is high relative to price — has the assessment been appealed recently, and will the sale trigger a re-assessment?
- What does the HOA fee cover, when was the last increase, and are there any pending special assessments or reserve-fund shortfalls?
- Is there a deadline driving the sale (1031 exchange, divorce, estate, relocation)? That informs how much negotiation room exists.
- Schools are D-rated, which usually means shorter tenancies and higher turnover. Who's the typical renter profile here, and what's been the actual vacancy rate?
- Crime grade is F in this area — have there been break-ins, vandalism, or insurance claims at this property in the last 3 years? What carrier currently insures it and at what premium?
- The area grade is low — what's the realistic commute time and amenity access for the typical tenant pool here? Any planned neighborhood developments (good or bad) we should know about?
- What's the average days-on-market for RENTAL listings here right now (not sales)? A rising rental-DOM trend means longer vacancies and softer asking-rent achievability than the comps imply.
- What's the recent tenant-quality profile in this submarket — average credit score on applications, eviction rate, late-payment / NSF rate, and stable-employment percentage? A property-management company in the area should have these aggregated.
- How much new for-sale + rental construction is in the pipeline within 1–3 miles? Heavy new supply typically softens prices + rents 12–24 months out; constrained supply supports both.
Investment metrics
- 1% rule
- 0.80% ✗
- Cap rate
- 3.92%
- Cash-on-cash
- -8.47%
- DSCR
- 0.62
- GRM
- 10.4
CMA / ARV
- ARV (median comp)
- $417,074
- List price
- $299,000
- Delta
- -28.31%
- Verdict
- UNDERPRICED
- Comps
- 20 within 1.0 mi
Show comp detail 12 sales within ~0.75 mi
| Address | Dist | Beds/Ba | Sqft | Sold | Price | $/sf | Match |
|---|---|---|---|---|---|---|---|
| 16611 Prairie Rose Bend Ln | 0.09mi | 3/2.5 | 2,539 (-1%) | 2mo | $383,990 | $151 | 92 |
| 28955 Rustic Robin Ln | 0.09mi | 3/2.5 | 2,539 (-1%) | 2mo | $393,990 | $155 | 92 |
| 16215 Mallard View Ln | 0.23mi | 4/3.0 (+1) | 2,650 (+3%) | 1mo | $419,841 | $158 | 76 |
| 27234 Wheat Falls Ln | 0.18mi | 4/3.0 (+1) | 2,410 (-6%) | 2mo | $378,990 | $157 | 73 |
| 27103 Sunflower Glen Ln | 0.10mi | 4/3.5 (+1) | 2,800 (+9%) | 1mo | $444,557 | $159 | 70 |
| 27119 Mound Hill Cir | 0.16mi | 4/3.0 (+1) | 2,800 (+9%) | 1mo | $446,207 | $159 | 70 |
| 27111 Sunflower Glen Ln | 0.12mi | 4/3.5 (+1) | 2,800 (+9%) | 1mo | $446,766 | $160 | 70 |
| 27122 Sunflower Glen Ln | 0.15mi | 4/3.5 (+1) | 2,800 (+9%) | 1mo | $424,509 | $152 | 68 |
| 27203 Sunflower Glen Ln | 0.17mi | 4/3.5 (+1) | 2,800 (+9%) | 2mo | $436,733 | $156 | 67 |
| 16207 Mallard View Ln | 0.21mi | 4/3.5 (+1) | 2,800 (+9%) | 0mo | $439,881 | $157 | 66 |
| 27327 Prairie Rush Dr | 0.55mi | 4/3.0 (+1) | 2,529 (-2%) | 1mo | $424,900 | $168 | 63 |
| 27410 Rolling Bluestem Ln | 0.57mi | 4/3.0 (+1) | 2,476 (-4%) | 2mo | $424,900 | $172 | 59 |
Match score weights: distance 35% · size 25% · config 20% · recency 20%. Top-matched comps best support the ARV.
Projected returns pro-forma
-3.0% appreciation · 0.0% rent growth · sell at horizon
- IRR
- -35.4%
- Equity multiple
- -0.11×
- Total profit
- $-92,782
- Equity at exit
- $44,582
- IRR
- -76.9%
- Equity multiple
- -0.85×
- Total profit
- $-155,115
- Equity at exit
- $25,852
Cash invested: $83,720 (down + closing). Projections, not guarantees.
Landlord ↔ Tenant lean methodology
- Overall (STATE)
- 87 Strongly Landlord-Friendly
- State Texas
- 87 Strongly Landlord-Friendly · R+5
- County
- — inherits STATE
- City
- — inherits STATE
ZIP-level market 77447
- Home prices YoY
- -31.1%
- Rents YoY
- -1.6%
- Active inventory
- 1791
- Price-to-rent
- 10.4×
Monthly cashflow live
- Estimated rent
- $2,389 medium interval (Pro) →
- Mortgage (P&I)
- −$1,568
- Tax from tax record
- −$755 /mo · $9,063/yr
- Insurance
- −$125
- HOA
- −$30
- Vacancy / Maint / Mgmt
- −$502
- Net cashflow
- $-591
Break-even live
Sensitivity live
| Price | -10% $-421 | -5% $-506 | +0% $-591 | +5% $-675 | +10% $-760 |
|---|---|---|---|---|---|
| Rent | -10% $-779 | -5% $-685 | +0% $-591 | +5% $-496 | +10% $-402 |
| Rate | -1.0pp $-440 | -0.5pp $-515 | base $-591 | +0.5pp $-668 | +1.0pp $-747 |
UW: 25.0% down · 7.5% · 30yr · 1.5% tax · 5.0% vac · 8.0% maint · 8.0% mgmt
Financing live
Cash to close
- Down payment
- $74,750
- Closing costs
- $8,970
- Reserves months
- —
- Total cash needed
- —
Loan-product check · same deal, 3 products live
Conventional
25% down · 7.5% · 30yr
- Down + closing
- —
- Monthly P&I
- —
- Monthly cashflow
- —
- DSCR
- —
- Eligible?
- —
Personal DTI + credit; lowest rate.
DSCR
20% down · 8.5% · 30yr
- Down + closing
- —
- Monthly P&I
- —
- Monthly cashflow
- —
- DSCR
- —
- Eligible?
- —
No personal income docs; deal must DSCR.
Hard money
10% down · 12.0% · 12mo
- Down + closing
- —
- Monthly P&I
- —
- Monthly cashflow
- —
- DSCR
- —
- Eligible?
- —
Short-term bridge; refi at stabilization.
Rent comps 1 comps
| Address | Beds | Baths | Sqft | Rent | $/sqft | DOM | Units | Dist |
|---|---|---|---|---|---|---|---|---|
| 26207 Glee Meadow Dr Hockley, TX | 4.0 | 3.5 | 3498 | $2,850 | $0.81 | 0d | 1 | 1.48mi |
HOA detail
- Monthly dues
- $30 · $360/yr
- Likely covers
- gas
Listing history 21 events
-
2026-06-21days on market $299,000 Active 37 DOM
-
2026-06-18days on market $299,000 Active 34 DOM
-
2026-06-17days on market $299,000 Active 33 DOM
-
2026-06-16days on market $299,000 Active 32 DOM
-
2026-06-15days on market $299,000 Active 31 DOM
-
2026-06-13days on market $299,000 Active 29 DOM
-
2026-06-09days on market $299,000 Active 25 DOM
-
2026-06-08days on market $299,000 Active 24 DOM
-
2026-06-07days on market $299,000 Active 23 DOM
-
2026-06-04days on market $299,000 Active 20 DOM
-
2026-06-03days on market $299,000 Active 19 DOM
-
2026-06-02days on market $299,000 Active 18 DOM
-
2026-06-01days on market $299,000 Active 17 DOM
-
2026-05-31days on market $299,000 Active 16 DOM
-
2026-05-14$349,000 Active 959-char remark
-
2026-05-12historical
-
2026-04-20price $349,000
-
2026-03-12price $379,000
-
2026-02-23$389,000 Active
-
2011-06-22historical
-
2011-02-09$154,900
ⓘ Source: listings_history table (triggers on properties + properties_extension) + one-shot
backfill from property_details.listing_events for pre-trigger history.
Tax reassessment forecast TX · Resets to sale price
- Current annual tax
- $9,063 · $755/mo
- Projected year-2 tax
- $9,063 · $755/mo
- Expected delta
- $0/yr ($0/mo · 0.0%)
ⓘ Screening estimate from a state-policy table — verify with the county assessor before closing.
Climate risk First Street
- Flood 1/10 Low FEMA zone X (unshaded) · 0% chance over 30 yrs
- Wildfire 5/10 Major
- Heat 9/10 Extreme 7 d/yr ≥110°F today · 23 d/yr by 30 yrs out
- Wind 9/10 Extreme 99% chance of damaging wind over 30 yrs
- Air quality 2/10 Low 1 unhealthy d/yr today · 1 by 30 yrs out
Nearby sold comps map
Loading sold comps map…
Walkable amenities ~0.75 mi
Loading nearby amenities…
Taxation est. · year 1
- Rental income
- $28,666
- − Mortgage interest
- −$16,749
- − Property taxes
- −$9,063
- − Insurance
- −$1,495
- − Repairs & maintenance
- −$2,293
- − Management
- −$2,293
- − HOA
- −$360
- − Depreciation
- −$8,698
- Taxable loss
- −$12,285
- Est. tax savings @ 24.0%
- +$2,949
- After-tax cash flow
- $-4,139/yr
For passive investors: Depreciation is non-cash, so a rental often shows a tax loss while cash-flowing — sheltering income. Rental losses are passive: they offset passive income freely, and up to $25,000/yr can offset ordinary (W-2) income if you actively participate and your MAGI is under $100k (phasing out to $0 by $150k); unused losses carry forward. On sale, claimed depreciation is recaptured at up to 25%, and gains may owe capital-gains tax (a 1031 exchange can defer both). Figures are a year-1 estimate at your 24.0% rate — not tax advice; consult a CPA.
Schools (NCES district)
- District
- Waller ISD
- NCES district ID
- 4844430
- Math proficiency
- 30% ▼ -23.00%
- Reading proficiency
- 35% ▼ -11.00%
- Median HH income
- $58,911
- Composite
- 29.12/100
- National rank
- #6593
- State rank
- #532 of 826 in TX
Livability — Houston
- Score
- 74/100
- State rank
- #184
- US rank
- #4771
Category grades
Schools grade is shown separately in the Schools card above.
Census & demographics
- County
- Harris County · 4,702,590 people
- City population
- 3,226,434
- Metro
- Houston-The Woodlands-Sugar Land, TX
- Population (ZIP)
- 25,231
- Household income
- $116,925
- Rent vs Own
- Severe rent burden
- 265.0
Population outlook (Harris County) Hauer SSP2
- Today (2025)
- 5,571,493 people
- By 2030
- 6,089,821 · +9.3%
- By 2040
- 7,142,806 · +28.2%
- By 2050
- 8,185,864 · +46.9%
- By 2075
- 10,574,329 · +89.8%
- By 2100
- 12,109,958 · +117.4%
Race, ethnicity, and origin ACS 2023
- Neighborhood character
- Diverse neighborhood (Simpson 0.63)
- Race & ethnicity
- White 44% Hispanic / Latino 41% Two or more races 16% Black 9% Asian 1%
- Hispanic origin (detail)
- Mexican 27%
- Common ancestry
- Lithuanian 3% Slovak 1% Romanian 1%
- Foreign-born
- 15% · Canada, Jamaica, Dominican Republic
- Languages at home
- 69% English-only · Spanish 28% Other Indo-European 1% Vietnamese 1%
Political lean MEDSL · Harris
- 2024 margin
- Lean D (+5.5) · D 52.0% · R 46.4% · Other 1.6%
- 2008→2024 swing
- +3.9pp toward D · 2008: 1.6pp · 2024: 5.5pp
- All cycles
- 2024: D+5.5 2020: D+13.3 2016: D+12.4 2012: D+0.1 2008: D+1.6
Not yet ingested
- Civics
- —
Market trends
- HPI YoY
- ▼ -112.73%
- Current HPI
- 249.6969
- Rent YoY
- ▼ -1.58%
- Metro
- Houston-The Woodlands-Sugar Land, TX
- State GDP YoY
- ▲ 3.95%
- F500 in state
- 110
Industry mix (Fortune 500 HQ in TX)
| Industry | F500 HQs | Revenue |
|---|---|---|
| Energy | 16 | $1,198B |
|
||
| Technology | 5 | $198B |
|
||
| Engineering / Construction | 4 | $72B |
|
||
| Energy Services | 3 | $60B |
|
||
| Utilities | 3 | $41B |
|
||
| Healthcare | 2 | $330B |
|
||
Price history
+93.0% since first listed9 events — show timeline
- 2026-05-27 Price Changed $299,000 HARMLS
- 2026-05-19 Price Changed $309,000 HARMLS
- 2026-05-14 Listed $349,000 HARMLS
- 2026-05-12 Listing Removed — HARMLS
- 2026-04-20 Price Changed $349,000 HARMLS
- 2026-03-12 Price Changed $379,000 HARMLS
- 2026-02-23 Listed $389,000 HARMLS
- 2011-06-22 Listing Removed — HARMLS
- 2011-02-09 Listed $154,900 HARMLS
Property tax history
+32.8%/yrLatest (2025): $9,063 · +0.4% YoY. Source: county tax records.
Cash-flow waterfall
monthlySold comps — $/sqft
last 12 mo · ≤1 miLoading sold comps…